| ||||||||||||||||||||||||||||||||||||||||||||
18 of 50 seats on North Hertfordshire District Council 26 seats needed for a majority | ||||||||||||||||||||||||||||||||||||||||||||
---|---|---|---|---|---|---|---|---|---|---|---|---|---|---|---|---|---|---|---|---|---|---|---|---|---|---|---|---|---|---|---|---|---|---|---|---|---|---|---|---|---|---|---|---|
| ||||||||||||||||||||||||||||||||||||||||||||
|
The 1988 North Hertfordshire District Council election was held on 5 May 1988, at the same time as other local elections across England and Scotland. There were 18 out of 50 seats on North Hertfordshire District Council up for election, being the usual third of the council plus a by-election in Codicote ward. [1]
The Conservatives made a net gain of one seat to increase their majority on the council. The former SDP–Liberal Alliance group of eight councillors had fragmented ahead of the election; four joined the new merged party of the Social and Liberal Democrats (renamed the Liberal Democrats the following year), but the other four (including former Alliance group leader, Tony Quinn) joined the breakaway continuing Social Democratic Party opposed to the merger. [2]
The overall results were as follows: [3]
1988 North Hertfordshire District Council election | ||||||||||
---|---|---|---|---|---|---|---|---|---|---|
Party | This election | Full council | This election | |||||||
Seats | Net | Seats % | Other | Total | Total % | Votes | Votes % | +/− | ||
Conservative | 12 | 1 | 66.7 | 15 | 27 | 54.0 | 14,569 | 41.1 | +1.6 | |
Labour | 5 | 27.8 | 8 | 13 | 26.0 | 11,412 | 32.2 | +7.8 | ||
SLD | 0 | 1 | 0.0 | 3 | 3 | 6.0 | 6,094 | 17.2 | -14.5 | |
SDP | 0 | 0.0 | 4 | 4 | 8.0 | 1,363 | 3.8 | new | ||
Ratepayers | 1 | 5.6 | 2 | 3 | 6.0 | 1,869 | 5.3 | +1.2 | ||
Green | 0 | 0.0 | 0 | 0 | 0.0 | 138 | 0.4 | 0.0 |
The results for each ward were as follows. An asterisk(*) indicates a sitting councillor standing for re-election. [3]
Party | Candidate | Votes | % | ±% | |
---|---|---|---|---|---|
Conservative | Michael Tatham* | 667 | 64.6 | +9.2 | |
Labour | Keith Brydon | 253 | 24.5 | -2.7 | |
SLD | Jonathan Heath | 113 | 10.9 | -6.5 | |
Turnout | 50.0 | ||||
Registered electors | 2,046 | ||||
Conservative hold | Swing | +6.0 | |||
Party | Candidate | Votes | % | ±% | |
---|---|---|---|---|---|
Conservative | Bernard Crow | 1,595 | 50.7 | +4.0 | |
Labour | Alan Moir* | 1,327 | 42.2 | +15.1 | |
SLD | Sara Tustin | 221 | 7.0 | -19.1 | |
Turnout | 47.0 | ||||
Registered electors | 6,703 | ||||
Conservative gain from Labour | Swing | -5.6 | |||
Party | Candidate | Votes | % | ±% | |
---|---|---|---|---|---|
Conservative | Richard Lee | 538 | 55.1 | +17.4 | |
Labour | Charles MacNally (Charlie MacNally) | 327 | 33.5 | +6.5 | |
SLD | Richard Canning | 88 | 9.0 | -26.3 | |
SDP | Bernadette Hatch (Bernie Hatch) | 24 | 2.5 | +2.5 | |
Turnout | 54.0 | ||||
Registered electors | 1,801 | ||||
Conservative hold | Swing | +5.5 | |||
Party | Candidate | Votes | % | ±% | |
---|---|---|---|---|---|
Conservative | Edward Ian Smith | 769 | 75.9 | +32.4 | |
Labour | Peter Read | 244 | 24.1 | -0.1 | |
Conservative hold | Swing | +16.3 | |||
The by-election in Codicote ward was triggered by the death of Conservative councillor Denis Winch.
Party | Candidate | Votes | % | ±% | |
---|---|---|---|---|---|
Labour | Judi Billing* | 1,174 | 54.1 | +14.1 | |
Conservative | Norman Frost | 624 | 28.7 | -8.4 | |
SLD | Penelope Cunningham (Penny Cunningham) | 171 | 7.9 | -15.0 | |
Ratepayers | John Edwards | 135 | 6.2 | +6.2 | |
Green | Christopher Studman | 68 | 3.1 | +3.1 | |
Turnout | 48.0 | ||||
Registered electors | 4,500 | ||||
Labour hold | Swing | +11.3 | |||
Party | Candidate | Votes | % | ±% | |
---|---|---|---|---|---|
Conservative | Phillip MacCormack* | 1,092 | 46.2 | -3.1 | |
SLD | Rosemary Read | 471 | 19.9 | -21.2 | |
Labour | David Tizzard | 359 | 15.2 | +5.5 | |
SDP | Carolyn Randall | 294 | 12.4 | +12.4 | |
Ratepayers | Jacqueline Tait | 150 | 6.3 | +6.3 | |
Turnout | 46.0 | ||||
Registered electors | 5,154 | ||||
Conservative hold | Swing | +9.1 | |||
Party | Candidate | Votes | % | ±% | |
---|---|---|---|---|---|
Labour | Joan Kirby | 1,022 | 70.5 | +19.5 | |
SLD | Michael John Edwards | 427 | 29.5 | +5.7 | |
Turnout | 35.0 | ||||
Registered electors | 4,225 | ||||
Labour hold | Swing | +6.9 | |||
Party | Candidate | Votes | % | ±% | |
---|---|---|---|---|---|
Conservative | Francis Howett* (Frank Howett) | 832 | 65.8 | +8.7 | |
SLD | Jennifer Sefton (Jenny Sefton) | 265 | 21.0 | -6.8 | |
Labour | Roger Wood | 167 | 13.2 | -2.0 | |
Turnout | 46.0 | ||||
Registered electors | 2,737 | ||||
Conservative hold | Swing | +7.8 | |||
Party | Candidate | Votes | % | ±% | |
---|---|---|---|---|---|
Ratepayers | Christopher Parker* | 1,584 | 62.0 | +13.8 | |
Labour | Roger Newby | 688 | 26.9 | +6.0 | |
SLD | Paul Clark | 213 | 8.3 | -5.0 | |
Green | Elizabeth Ann Roberts | 70 | 2.7 | +1.1 | |
Turnout | 42.0 | ||||
Registered electors | 6,096 | ||||
Ratepayers hold | Swing | +3.9 | |||
Party | Candidate | Votes | % | ±% | |
---|---|---|---|---|---|
Conservative | Margaret Hilton* | 917 | 62.4 | +4.8 | |
SLD | Michael Stiff (Mike Stiff) | 286 | 19.5 | -6.4 | |
Labour | Jack Nelson | 266 | 18.1 | +1.6 | |
Turnout | 43.0 | ||||
Registered electors | 3,416 | ||||
Conservative hold | Swing | +5.6 | |||
Party | Candidate | Votes | % | ±% | |
---|---|---|---|---|---|
Labour | Lorna Kercher | 1,077 | 53.2 | +11.7 | |
Conservative | David Langridge | 607 | 30.0 | +4.1 | |
SLD | Keith Marr | 340 | 16.8 | -15.7 | |
Turnout | 48.0 | ||||
Registered electors | 4,199 | ||||
Labour hold | Swing | +3.8 | |||
Party | Candidate | Votes | % | ±% | |
---|---|---|---|---|---|
Labour | David Kearns* | 1,302 | 42.6 | +8.6 | |
Conservative | Michael Muir | 861 | 28.2 | +1.1 | |
SLD | Alison Kingman | 729 | 23.9 | -12.6 | |
SDP | Sue Sinclair | 164 | 5.4 | +5.4 | |
Turnout | 58.0 | ||||
Registered electors | 5,215 | ||||
Labour hold | Swing | +3.8 | |||
Party | Candidate | Votes | % | ±% | |
---|---|---|---|---|---|
Conservative | Pauline Wood | 1,158 | 39.1 | +5.8 | |
Labour | David Evans | 812 | 27.4 | +8.2 | |
SDP | James Bray | 707 | 23.9 | +23.9 | |
SLD | Harry Shipley | 287 | 9.7 | -37.9 | |
Turnout | 49.0 | ||||
Registered electors | 6,004 | ||||
Conservative hold | Swing | -1.2 | |||
Party | Candidate | Votes | % | ±% | |
---|---|---|---|---|---|
Conservative | Geoffrey Woods* (Geoff Woods) | 1,203 | 48.3 | -3.7 | |
SLD | Ian Simpson | 697 | 28.0 | -10.0 | |
Labour | Tony McWalter | 418 | 16.8 | +6.7 | |
SDP | Robert Ashton | 174 | 7.0 | +7.0 | |
Turnout | 54.0 | ||||
Registered electors | 4,642 | ||||
Conservative hold | Swing | +3.2 | |||
Party | Candidate | Votes | % | ±% | |
---|---|---|---|---|---|
Labour | Peter Mardell | 1,010 | 46.1 | +8.1 | |
Conservative | Ray Bloxham* | 941 | 42.9 | -0.2 | |
SLD | Derek Hunter | 242 | 11.0 | -7.9 | |
Turnout | 54.0 | ||||
Registered electors | 4,036 | ||||
Labour gain from Conservative | Swing | +4.2 | |||
Party | Candidate | Votes | % | ±% | |
---|---|---|---|---|---|
Conservative | Francis John Smith* | 1,146 | 58.3 | +6.1 | |
SLD | Jennifer Comley | 493 | 25.1 | -9.3 | |
Labour | Christopher Hills | 328 | 16.7 | +3.2 | |
Turnout | 47.0 | ||||
Registered electors | 4,170 | ||||
Conservative hold | Swing | +7.7 | |||
Party | Candidate | Votes | % | ±% | |
---|---|---|---|---|---|
Conservative | Mark Hughes | 1,216 | 46.8 | -1.7 | |
SLD | Gwyn Hardwicke | 855 | 32.9 | -2.2 | |
Labour | Robin King | 525 | 20.2 | +3.9 | |
Turnout | 46.0 | ||||
Registered electors | 5,652 | ||||
Conservative gain from SLD | Swing | +0.3 | |||
Party | Candidate | Votes | % | ±% | |
---|---|---|---|---|---|
Conservative | Robert Evans* | 403 | 56.6 | -4.3 | |
SLD | Stephen Jarvis | 196 | 27.5 | +4.6 | |
Labour | Rodney Leete | 113 | 15.9 | -0.3 | |
Turnout | 57.0 | ||||
Registered electors | 1,248 | ||||
Conservative hold | Swing | -4.5 | |||
Party | Candidate | Votes | % | ±% | |
---|---|---|---|---|---|
Conservative | Timothy Doyle (Tim Doyle) | 801 | 46.6 | -0.2 | |
SLD | Jenny Comley | 455 | 26.5 | -6.5 | |
Labour | Robin King | 363 | 21.1 | +0.9 | |
SDP | Michael Harrison | 100 | 5.8 | +5.8 | |
Turnout | 1000.0 | ||||
Registered electors | |||||
Conservative gain from SLD | Swing | +3.2 | |||
The Royston West by-election was triggered by the resignation of Social and Liberal Democrat councillor Fran Bate. Tim Doyle won the seat for the Conservatives. [4]
Party | Candidate | Votes | % | ±% | |
---|---|---|---|---|---|
Conservative | Richard Thake | ||||
Liberal Democrats | Stephen Harbron | ||||
Labour | David Billing | ||||
Turnout | |||||
Registered electors | |||||
Conservative hold | Swing | ||||
The Hitchin Priory by-election was triggered by the death of Conservative councillor Frank Howett. The seat was retained for the Conservatives by Richard Thake. The number of votes was not reported, but it was said that the Conservative vote was down 20% from the last time the seat was contested and the Liberal Democrat share of the vote was 33%. [5] [6]
North Hertfordshire is one of ten local government districts in the county of Hertfordshire, England. Its council is based in Letchworth. The district borders East Hertfordshire, Stevenage, Welwyn Hatfield, St Albans, Central Bedfordshire, Luton, and South Cambridgeshire.
The 2002 St Albans City and District Council election took place on 2 May 2002 to elect members of St Albans District Council in Hertfordshire, England. One third of the council was up for election and the council stayed under no overall control.
The 2006 St Albans City and District Council election took place on 4 May 2006 to elect members of St Albans District Council in Hertfordshire, England. One third of the council was up for election and the Liberal Democrats gained overall control of the council from no overall control.
The 2007 St Albans City and District Council election took place on 3 May 2007 to elect members of St Albans District Council in Hertfordshire, England. One third of the council was up for election and the Liberal Democrats lost overall control of the council to no overall control.
The 2012 North Hertfordshire Council election was held on 3 May 2012, at the same time as other local elections across England, Scotland and Wales. Of the 49 seats on North Hertfordshire District Council, 15 were up for election.
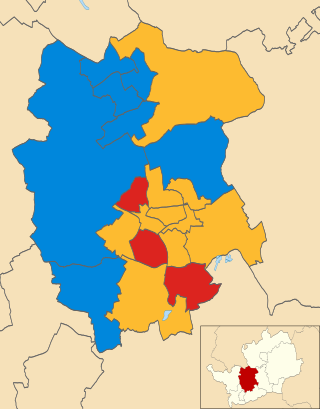
The 2015 North Hertfordshire Council election was held on 5 May 2016, at the same time as other local elections across England. Of the 49 seats on North Hertfordshire District Council, 15 were up for election.
The 2019 North Hertfordshire Council election was held on 2 May 2019, at the same time as other local elections across England and Northern Ireland. Of the 49 seats on North Hertfordshire District Council, 16 were up for election.
The 2018 North Hertfordshire Council election was held on 3 May 2018, at the same time as other local elections across England. Of the 49 seats on North Hertfordshire District Council, 19 were up for election, being the usual third of the council plus a by-election in Letchworth Grange ward.
The 2021 North Hertfordshire District Council election took place on 6 May 2021 to elect 17 of the 49 members of North Hertfordshire District Council in England. This was on the same day as other local elections around the country. This election had originally been due to take place in May 2020, but was postponed due to the COVID-19 pandemic.
The 1973 North Hertfordshire District Council election was held on 7 June 1973. It was the first election to North Hertfordshire District Council, and was held at the same time as other local elections across England for the new non-metropolitan district councils that were created under the Local Government Act 1972. The elected councillors initially formed a shadow authority to oversee the transition to the new system, operating alongside the five outgoing district councils until 1 April 1974 when the new district formally came into being.
The 1976 North Hertfordshire District Council election was held on 6 May 1976, at the same time as other local elections across England and Wales. All 48 seats on North Hertfordshire District Council were up for election.
The 1980 North Hertfordshire District Council election was held on 1 May 1980, at the same time as other local elections across England and Scotland. There were 17 out of 50 seats on North Hertfordshire District Council up for election, being the usual third of the council.
The 1982 North Hertfordshire District Council election was held on 6 May 1982, at the same time as other local elections across England and Scotland. There were 16 out of 50 seats on North Hertfordshire District Council up for election, being the usual third of the council.
The 1983 North Hertfordshire District Council election was held on 5 May 1983, at the same time as other local elections across England and Wales. There were 18 out of 50 seats on North Hertfordshire District Council up for election, being the usual third of the council plus a by-election in Letchworth East ward.
The 1984 North Hertfordshire District Council election was held on 3 May 1984, at the same time as other local elections across England and Scotland. There were 17 out of 50 seats on North Hertfordshire District Council up for election, being the usual third of the council.
The 1986 North Hertfordshire District Council election was held on 8 May 1986, at the same time as other local elections across England and Scotland. There were 16 out of 50 seats on North Hertfordshire District Council up for election, being the usual third of the council.
The 1987 North Hertfordshire District Council election was held on 7 May 1987, at the same time as other local elections across England and Wales. There were 17 out of 50 seats on North Hertfordshire District Council up for election, being the usual third of the council.
The 1990 North Hertfordshire District Council election was held on 3 May 1990, at the same time as other local elections across England and Scotland. There were 16 out of 50 seats on North Hertfordshire District Council up for election, being the usual third of the council.
The 1991 North Hertfordshire District Council election was held on 2 May 1991, at the same time as other local elections across England and Wales. There were 17 out of 50 seats on North Hertfordshire District Council up for election, being the usual third of the council.
The 1992 North Hertfordshire District Council election was held on 7 May 1992, at the same time as other local elections across England and Scotland. There were 17 out of 50 seats on North Hertfordshire District Council up for election, being the usual third of the council.