1989 South Australian state election

Last updated

1989 South Australian state election
Flag of South Australia.svg
  1985 25 November 1989 (1989-11-25) 1993  

All 47 seats in the South Australian House of Assembly
24 seats were needed for a majority
11 (of the 22) seats in the South Australian Legislative Council
 First partySecond partyThird party
  John Charles Bannon 1943-2015.jpg John Olsen (1).jpg
NAT
Leader John Bannon John Olsen Peter Blacker
Party Labor Liberal National
Leader since18 September 197910 November 1982
Leader's seat Ross Smith Custance Flinders
Seats before27171
Seats won22221
Seat changeDecrease2.svg5Increase2.svg5Steady2.svg
Popular vote346,268381,83410,217
Percentage40.09%44.21%1.18%
SwingDecrease2.svg8.10Increase2.svg2.06Decrease2.svg0.54
TPP 48.0%52.0%
TPP swingDecrease2.svg5.2Increase2.svg5.2

Premier before election

John Bannon
Labor

Resulting Premier

John Bannon
Labor

State elections were held in South Australia on 25 November 1989. All 47 seats in the South Australian House of Assembly were up for election. The incumbent Australian Labor Party led by Premier of South Australia John Bannon defeated the Liberal Party of Australia led by Leader of the Opposition John Olsen. Labor won 22 out of 47 seats, and secured a majority of 24 with the support of two Independent Labor members.

Contents

Background

Parliamentary elections for both houses of the Parliament of South Australia were held in South Australia in 1989. John Bannon's Labor government had initially presided over an economic boom, but at the time of the election the economy had slowed due to the late 1980s recession. The Liberals' campaign accused Bannon of inaction during the poor economic conditions, capitalising on the fact that he was national president of Australian Labor Party at the time. [1]

Outcome

The Liberals gained five seats (Adelaide, Bright, Fisher, Hayward and Newland), but Labor held power with of the support of the two "independent Labor" members.

The John Olsen-led Liberal Party of Australia failed to win office despite gaining 52 percent of the two-party vote.

It was only the second time that a Labor government in South Australia had been re-elected for a third term, however it would be the first eleven-year-incumbent Labor government.

In the South Australian Legislative Council, the numbers were unchanged (Labor 10, Liberal 10, Australian Democrats 2). Thus the Democrats retained sole balance of power. They had held sole balance of power since 1985, and would continue to hold it until 1997.

Aftermath

Before the election, the Liberal Party made allegations of a Labor 'gerrymander', due to the perceived unfair state of the electoral boundaries. While Labor had not instituted any type of imbalanced electoral legislation, it had nonetheless not issued a redistribution since 1983 (which it was not required to do, because redistributions were only required after every third election). So while the electoral districts were equal within the required 10 percent tolerances when they were drawn in 1983, population shifts had increased that imbalance substantially. [2] Because of this, a 1991 state referendum made redistributions mandatory by the Electoral Commission of South Australia after each election, and included a 'fairness clause' where the commission should redraw boundaries with the objective that the party which receives over 50 percent of the statewide two-party vote at the forthcoming election should win the two-party vote in a majority of seats.

Olsen was replaced as Liberal leader by Dale Baker in 1990. Baker resigned as leader in 1992 without contesting an election, and the subsequent leadership ballot was won by Dean Brown, ahead of Olsen and Jennifer Cashmore.

The parliament had three by-elections (1990 Custance by-election, the 1992 Alexandra by-election and the 1992 Kavel by-election), but all were retained by the Liberal party, so resulted in no change in the numbers in parliament.

Independent Labor Martyn Evans joined the ALP in 1993 and stood at the 1993 election as an endorsed ALP candidate.

Key dates

Results

House of Assembly

South Australian state election, 25 November 1989 [3]
House of Assembly
<< 19851993 >>

Enrolled voters941,368
Votes cast888,918 Turnout 94.43+0.97
Informal votes25,167Informal2.83+0.64
Summary of votes by party
PartyPrimary votes %SwingSeatsChange
  Liberal 381,83444.21+2.0622+ 5
  Labor 346,26840.09–8.1022– 5
  Democrats 88,27010.27+6.0200
  Call to Australia 10,9741.30+1.3000
  National 10,2171.18–0.5410
  Independent Labor 13,0941.52–0.7720
  Independent 10,6331.23+0.5700
 Other2,0110.23*00
Total863,751  47 
Two-party-preferred
  Labor 414,24647.96–5.21
  Liberal 449,50552.04+5.21

Seats changing hands

SeatPre-1989SwingPost-1989
PartyMemberMarginMarginMemberParty
Adelaide  Labor Mike Duigan 0.63.93.3 Michael Armitage Liberal 
Bright  Labor Derek Robertson 1.62.61.0 Wayne Matthew Liberal 
Davenport  Independent Stan Evans*2.6N/A15.9 Stan Evans Liberal 
Fisher  Labor Philip Tyler 1.14.23.1 Bob Such Liberal 
Hayward  Labor June Appleby 2.83.70.9 Mark Brindal Liberal 
Newland  Labor Di Gayler 1.51.60.1 Dorothy Kotz Liberal 

Legislative Council

South Australian state election, 25 November 1989 [4]
Legislative Council
<< 19851993 >>

Enrolled voters941,368
Votes cast889,896 Turnout 94.5%+1.0%
Informal votes34,612Informal3.9%+0.2%
Summary of votes by party
PartyPrimary votes %SwingSeats
won
Seats
held
  Liberal 351,55941.1%+1.8%510
  Labor 339,96139.7%–8.3%510
  Democrats 91,45610.7%+5.2%12
  Call to Australia 21,6582.5%–0.5%00
  Grey Power 19,4862.3%+2.3%00
  Conservative 7,6570.9%+0.9%00
  National 6,7000.8%–0.8%00
  Independent 16,8072.0%+0.9%00
Total855,284  1122

Post-election pendulum

Government seats (24)
Marginal
Florey Bob Gregory ALP1.8%
Unley Kym Mayes ALP2.3%
Norwood Greg Crafter ALP2.5%
Todd John Klunder ALP2.8%
Henley Beach Don Ferguson ALP4.0%
Mitchell Paul Holloway ALP4.3%
Hartley Terry Groom ALP4.5%
Baudin Don Hopgood ALP5.1%
Fairly safe
Walsh John Trainer ALP6.3%
Gilles Colin McKee ALP6.6%
Mawson Susan Lenehan ALP7.3%
Albert Park Kevin Hamilton ALP8.1%
Playford John Quirke ALP9.1%
Peake Vic Heron ALP10.0%
Safe
Whyalla Frank Blevins ALP10.9%
Briggs Mike Rann ALP11.8%
Semaphore Norm Peterson IND12.8% v ALP
Spence Michael Atkinson ALP14.0%
Ross Smith John Bannon ALP14.1%
Price Murray De Laine ALP16.3%
Ramsay Lynn Arnold ALP16.7%
Elizabeth Martyn Evans IND17.1% v ALP
Napier Terry Hemmings ALP17.2%
Stuart Colleen Hutchison ALP18.0%
Opposition seats (23)
Marginal
Newland Dorothy Kotz LIB0.1%
Hayward Mark Brindal LIB0.9%
Bright Wayne Matthew LIB1.0%
Fisher Bob Such LIB3.1%
Adelaide Michael Armitage LIB3.3%
Fairly safe
Hanson Heini Becker LIB6.1%
Morphett John Oswald LIB10.0%
Safe
Flinders Peter Blacker NAT10.9% v LIB
Mitcham Stephen Baker LIB11.0%
Light Bruce Eastick LIB12.9%
Coles Jennifer Cashmore LIB13.1%
Heysen David Wotton LIB15.1%
Kavel Roger Goldsworthy LIB15.5%
Davenport Stan Evans LIB15.9%
Alexandra Ted Chapman LIB16.0%
Goyder John Meier LIB16.4%
Eyre Graham Gunn LIB18.6%
Bragg Graham Ingerson LIB20.0%
Custance John Olsen LIB20.1%
Chaffey Peter Arnold LIB20.7%
Mount Gambier Harold Allison LIB22.5%
Murray-Mallee Peter Lewis LIB22.6%
Victoria Dale Baker LIB23.2%

See also

Related Research Articles

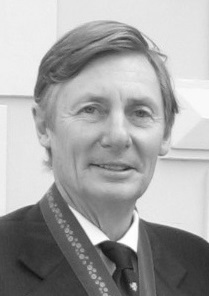
Dean Craig Brown, AO is a politician who served as the Premier of South Australia between 14 December 1993 and 28 November 1996, and also served as 10th Deputy Premier of South Australia between 22 October 2001 and 5 March 2002, representing the South Australian Division of the Liberal Party of Australia. He became premier when he led the party to a landslide win at the 1993 state election, and lost the office when he lost a leadership challenge to John Olsen in November 1996.

<span class="mw-page-title-main">Electoral district of Mitchell (South Australia)</span> Former state electoral district of South Australia

Mitchell is a former electoral district of the House of Assembly in the state of South Australia. It was first created in the redistribution of 1969, taking effect at the 1970 election. Mitchell was replaced by Black at the 2018 election, resulting from the 2016 electoral redistribution.

<span class="mw-page-title-main">Electoral district of Adelaide</span> South Australian state electoral district

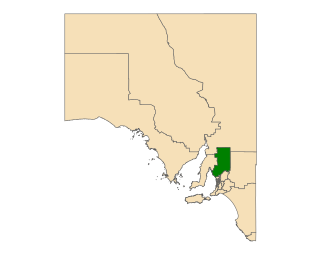
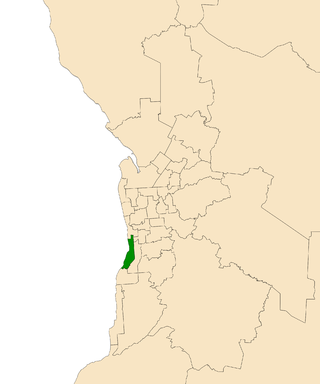
Adelaide is a single-member electoral district for the South Australian House of Assembly. The 22.8 km² state seat of Adelaide currently consists of the Adelaide city centre including North Adelaide and suburbs to the inner north and inner north east: Collinswood, Fitzroy, Gilberton, Medindie, Medindie Gardens, Ovingham, Thorngate, Walkerville, most of Prospect, and part of Nailsworth. The federal division of Adelaide covers the state seat of Adelaide and additional suburbs in each direction.

<span class="mw-page-title-main">Electoral district of Frome</span>

Frome is a single-member electoral district for the South Australian House of Assembly. It is named after Edward Charles Frome, the third surveyor-general of South Australia. The electorate stretches north-eastwards from the Gawler River and Gulf St Vincent in the south, and includes many of the agricultural areas of the Clare and Gilbert Valleys. It covers a total of 12,921 km2 (4,989 sq mi) and takes in the towns of Auburn, Clare, Mintaro, Port Broughton, Saddleworth, Snowtown and Riverton. Prior to the 2020 redistribution, its main population centre was Port Pirie, since transferred to Stuart.

<span class="mw-page-title-main">Electoral district of Davenport</span> State electoral district of South Australia

Davenport is a single-member electoral district for the South Australian House of Assembly. It is named after nineteenth-century pioneer and politician Sir Samuel Davenport. Davenport is a 57.7 km² electorate covering part of outer suburban Adelaide and the southern foothills of the Adelaide Hills. It takes in the suburbs of Aberfoyle Park, Bedford Park, Bellevue Heights, Chandlers Hill, Cherry Gardens, and Flagstaff Hill; and part of Happy Valley.

<span class="mw-page-title-main">Electoral district of Bright</span> Former state electoral district of South Australia

Bright is a former electorate for the South Australian House of Assembly. It was named in honour of Charles Bright, at various times South Australian Supreme Court Judge, Flinders University Chancellor, Health Commission chairman, and Electoral Boundaries Commission chairman. Prior to its 2018 abolition, the seat covered southern coastal suburbs of Adelaide including Brighton, North Brighton, South Brighton, Hallett Cove, Hove, Kingston Park, Marino, Seacliff, Seacliff Park and part of Somerton Park.

<span class="mw-page-title-main">1997 South Australian state election</span>

State elections were held in South Australia on 11 October 1997. All 47 seats in the South Australian House of Assembly were up for election. The incumbent Liberal Party of Australia led by Premier of South Australia John Olsen defeated the Australian Labor Party led by Leader of the Opposition Mike Rann, forming a minority government with the SA Nationals and independent MPs.

State elections were held in South Australia on 11 December 1993. All 47 seats in the South Australian House of Assembly were up for election. The incumbent Labor government, led by Premier Lynn Arnold, was defeated by the Liberal Opposition, led by Dean Brown, in a landslide victory. The Liberals won what is still the largest majority government in South Australian history.

The Playmander was a gerrymandering system, a pro-rural electoral malapportionment in the Australian state of South Australia, which was introduced by the incumbent Liberal and Country League (LCL) government in 1936, and remained in place for 32 years until 1968.

<span class="mw-page-title-main">1985 South Australian state election</span>

State elections were held in South Australia on 7 December 1985. All 47 seats in the South Australian House of Assembly were up for election. The incumbent Australian Labor Party led by Premier of South Australia John Bannon increased its majority, and defeated the Liberal Party of Australia led by Leader of the Opposition John Olsen.

<span class="mw-page-title-main">1982 South Australian state election</span>

State elections were held in South Australia on 6 November 1982. All 47 seats in the South Australian House of Assembly were up for election. The incumbent Liberal Party of Australia led by Premier of South Australia David Tonkin was defeated by the Australian Labor Party led by Leader of the Opposition John Bannon.

<span class="mw-page-title-main">1979 South Australian state election</span>

State elections were held in South Australia on 15 September 1979. All 47 seats in the South Australian House of Assembly were up for election. The incumbent Australian Labor Party led by Premier of South Australia Des Corcoran was defeated by the Liberal Party of Australia led by Leader of the Opposition David Tonkin.

<span class="mw-page-title-main">1977 South Australian state election</span>

State elections were held in South Australia on 17 September 1977. All 47 seats in the South Australian House of Assembly were up for election. The incumbent Australian Labor Party led by Premier of South Australia Don Dunstan won a fourth term in government, defeating the Liberal Party of Australia led by Leader of the Opposition David Tonkin.

<span class="mw-page-title-main">1975 South Australian state election</span>

State elections were held in South Australia on 12 July 1975. All 47 seats in the South Australian House of Assembly were up for election. The incumbent Australian Labor Party led by Premier of South Australia Don Dunstan won a third term in government, defeating the Liberal Party of Australia led by Leader of the Opposition Bruce Eastick.

<span class="mw-page-title-main">2010 Australian federal election</span> Election for the 43rd Parliament of Australia

The 2010 Australian federal election was held on Saturday, 21 August 2010 to elect members of the 43rd Parliament of Australia. The incumbent centre-left Australian Labor Party led by Prime Minister Julia Gillard won a second term against the opposition centre-right Liberal Party of Australia led by Opposition Leader Tony Abbott and Coalition partner the National Party of Australia, led by Warren Truss, after Labor formed a minority government with the support of three independent MPs and one Australian Greens MP.

<span class="mw-page-title-main">1915 South Australian state election</span>

State elections were held in South Australia on 27 March 1915. All 46 seats in the South Australian House of Assembly were up for election. The incumbent Liberal Union government led by Premier of South Australia Archibald Peake was defeated by the opposition United Labor Party led by Leader of the Opposition Crawford Vaughan. Each district elected multiple members, with voters casting multiple votes.

<span class="mw-page-title-main">2014 South Australian state election</span>

The 2014 South Australian state election elected members to the 53rd Parliament of South Australia on 15 March 2014, to fill all 47 seats in the House of Assembly and 11 of 22 seats in the Legislative Council. The 12-year-incumbent Australian Labor Party (SA) government, led by Premier Jay Weatherill, won its fourth consecutive four-year term in government, a record 16 years of Labor government, defeating the opposition Liberal Party of Australia (SA), led by Opposition Leader Steven Marshall.

<span class="mw-page-title-main">2018 South Australian state election</span>

The 2018 South Australian state election to elect members to the 54th Parliament of South Australia was held on 17 March 2018. All 47 seats in the House of Assembly or lower house, whose members were elected at the 2014 election, and 11 of 22 seats in the Legislative Council or upper house, last filled at the 2010 election, were contested. The record-16-year-incumbent Australian Labor Party (SA) government led by Premier Jay Weatherill was seeking a fifth four-year term, but was defeated by the opposition Liberal Party of Australia (SA), led by Opposition Leader Steven Marshall. Nick Xenophon's new SA Best party unsuccessfully sought to obtain the balance of power.

<span class="mw-page-title-main">2017 Queensland state election</span>

The 2017 Queensland state election was held on 25 November 2017 to elect all 93 members of the Legislative Assembly of Queensland, the unicameral Parliament of Queensland.

<span class="mw-page-title-main">2022 South Australian state election</span>

The 2022 South Australian state election was held on 19 March 2022 to elect members to the 55th Parliament of South Australia. All 47 seats in the House of Assembly, and half the seats in the Legislative Council were up for re-election.

References

  1. Power Plays: The real stories of Australian politics, Laurie Oakes, Hachette Australia, 2008
  2. Brooks, David; Gill, Zoe; Weste, John. "South Australian Referenda, 1896-1991" (PDF). Parliament of South Australia. Archived from the original (PDF) on 9 April 2015. Retrieved 16 August 2016.
  3. "Details of SA 1989 Election". Australian Politics and Elections Database.
  4. "History of South Australian elections 1857–2006, volume 2 Legislative Council". ECSA. Archived from the original on 8 March 2016. Retrieved 22 May 2016.