1996 Brighton and Hove Borough Council election

Last updated

1996 Brighton and Hove Borough Council election
Flag of East Sussex.svg
  1995 (Brighton)
1995 (Hove)
9 May 1996 1999  

All 78 seats to Brighton and Hove Borough Council
40 seats needed for a majority
Turnout38.4%
 Majority partyMinority party
 
Party Labour Conservative
Seats won5422
Seat changeIncrease2.svg 10Decrease2.svg 9
Popular vote105,90373,684
Percentage51.0%35.5%

 Third partyFourth party
 
Party Green Ind. Conservative
Seats won11
Seat changeIncrease2.svg 1Increase2.svg 1
Popular vote8,5852,906
Percentage4.1%1.4%

Brighton and Hove UK ward map 1996.svg
Winner of each seat at the 1996 Brighton and Hove Borough Council election

Council control after election


Labour

The 1996 Brighton and Hove Borough Council election was held on 9 May 1996 to elect members to the new unitary authority of Brighton and Hove Borough Council in East Sussex, England. It was the inaugural election to the new council, and was held nearly a year before the council formally came into being on 1 April 1997, replacing the former Brighton Borough Council and Hove Borough Council. The councillors elected in May 1996 served as a shadow authority alongside the outgoing councils, overseeing the transition to the new arrangements, until coming into their powers in April 1997.

Contents

The whole council was up for election, and all 78 councillors were elected from 26 wards. [1] The ward boundaries were the same as the old boundaries used in previous elections for the two predecessor authorities.

The result was a clear Labour victory, with the party winning an overall majority of seats. Labour had previously controlled both predecessor authorities: Brighton Borough Council since 1986, and Hove Borough Council since 1995.

Summary

Comparison with the previous councils

The wards and number of seats in each wards remained the same as the respective borough councils and therefore the swing and incumbents are all technically nominal.

Comparison with Brighton Borough and Hove Borough Councils
PartyBrighton and Hove
Borough Council
1996
Pre merger councils
Brighton Borough (thirds)Hove Borough (all out)Total (nominal)
1992199419951995
Seats%Seats%Seats%Seats%Seats%Seats%
Labour 5446.7332.61249.61355.71144.13945.5
Conservative 2232.61355.1432.6329.71633.83637.8
Green Party 18.604.804.304.805.804.9
Liberal Democrat 09.107.6013.109.2316311.5
Independent 11.3000000.100.200.1

Election result

1996 Brighton and Hove Borough Council election
PartyCandidatesSeatsGainsLossesNet gain/lossSeats %Votes %Votes+/−
  Labour 7854122Increase2.svg 1069.251.0105,903N/A
  Conservative 7722110Decrease2.svg 928.235.573,684N/A
  Green 28110Increase2.svg 11.34.18,585N/A
  Ind. Conservative 9110Increase2.svg 11.31.42,906N/A
  Liberal Democrats 59003Decrease2.svg 30.07.816,260N/A
  Residents 1000Steady2.svg0.00.1227N/A
  Militant Labour 1000Steady2.svg0.00.1162N/A

Council composition

After the inaugural elections the composition of the council was compared to its previous consistent councils.

Brighton Borough Council composition after the election in 1995 was:

2820
LabCon

Hove Borough Council composition after the election in 1995 was:

16113
LabConLD

After the inaugural election in 1996 the composition of the council was:

542211
LabConGI

Ward results

Candidates who were previously councillors in the Brighton Borough Council or Hove Borough Council are indicated with a (*)

Brunswick and Adelaide

Brunswick and Adelaide (3)
PartyCandidateVotes%
Labour Davies C. 941 40.4
Labour Hunt F. Ms. 919 39.5
Labour McGinley J. 841 36.1
Liberal Democrats Hillman J.*74932.2
Liberal Democrats Wakeling J. Ms.*69129.7
Liberal Democrats Vivian P. Ms.67128.8
Conservative Hunter S. Ms.61026.2
Conservative Boustead C.60425.9
Conservative Mitchell J.58325.0
Green Nightengale K.2309.9
Turnout 2,32930.7
Registered electors 7,587
Labour gain from Liberal Democrats

Goldsmid

Goldsmid (3)
PartyCandidateVotes%
Conservative Langston J. Ms.* 1,330 49.5
Conservative Langston S.* 1,294 48.2
Conservative Jordan B.* 1,292 48.1
Labour Bower S. Lab1,14542.6
Labour Visor V. Ms.1,11841.6
Labour Ralfe B.1,06439.6
Liberal Democrats Thomas P. Ms.2469.2
Liberal Democrats Driffill B.2378.8
Green Hudson G.2258.4
Liberal Democrats Taylor S.2248.3
Turnout 2,68636.7
Registered electors 7,318
Conservative hold
Conservative hold
Conservative hold

Hangleton

Hangleton (3)
PartyCandidateVotes%
Labour Keilty G.* 1,421 51.9
Labour Newland D. 1,309 47.8
Labour Walshe B. Ms.* 1,300 47.5
Conservative Willows P.1,09039.8
Conservative Jackson M.1,06639.0
Conservative Jackson G.1,05538.6
Liberal Democrats Walls M. Ms1856.8
Liberal Democrats Bates E.1676.1
Liberal Democrats Bickle P. Ms1646.0
Green McHenry J. Ms.993.6
Turnout 2,73643.1
Registered electors 6,348
Labour hold
Labour hold
Labour hold

Hanover

Hanover (3)
PartyCandidateVotes%
Labour Smith J. Ms.* 2,100 71.5
Labour Schaffer S. Ms.* 1,990 67.8
Labour Morley C. 1,789 60.9
Green Chapman K. Ms.66522.6
Conservative Dudeney R. Ms.38012.9
Conservative Jackson G.33811.5
Conservative Radford-Kirby E. Ms.32311.0
Liberal Democrats Cornelius C.29610.1
Turnout 2,93634.7
Registered electors 8,461
Labour hold
Labour hold
Labour hold

Hollingbury

Hollingbury (3)
PartyCandidateVotes%
Labour David Lepper* 1,891 77.9
Labour Lepper J. Ms. 1,798 74.1
Labour Finch B.* 1,742 71.8
Conservative Franklin C. Ms.38415.8
Conservative McGrath M.37715.5
Conservative Norman K.35914.8
Green Gardner P.27611.4
Liberal Democrats Lamb D.26611.0
Liberal Democrats Powell D.1948.0
Turnout 2,42632.1
Registered electors 7,556
Labour hold
Labour hold
Labour hold

Kings Cliff

Kings Cliff (3)
PartyCandidateVotes%
Labour Duncan I.* 1,577 66.5
Labour Burgess S.* 1,567 66.1
Labour Mitchell G. Ms.* 1,529 64.5
Conservative Radford D. Ms.63426.8
Conservative Sampson S.59325.0
Conservative Amin J.58924.9
Green Hodd J. Ms.2359.9
Liberal Democrats Jones M.2179.2
Turnout 2,37035.4
Registered electors 6,696
Labour hold
Labour hold
Labour hold

Marine

Marine (3)
PartyCandidateVotes%
Labour Marsh M. Ms.* 1,347 59.1
Labour Desmond Turner 1,309 57.4
Labour Johnston M. 1,275 55.9
Conservative Mears M. Ms.*1,00344.0
Conservative Smith D.91640.2
Conservative Fairs B. Ms.90639.8
Militant Labour Dale K.1627.1
Liberal Democrats Clements I.1406.1
Green Coyne B. Ms.1335.8
Liberal Democrats Howard P. Ms.1265.5
Liberal Democrats Howard A.1145.0
Turnout 2,27929.2
Registered electors 7,803
Labour hold
Labour hold
Labour gain from Conservative

Moulsecoomb

Moulsecoomb (3)
PartyCandidateVotes%
Labour Meadows A. Ms.* 1,097 62.9
Labour Hazelgrove J. 1,079 61.9
Labour Tonks F.* 1,019 58.4
Conservative Gunn K. Ms.*40723.3
Conservative Amiet J. Ms.39922.9
Conservative Stevens J.37521.5
Residents Avey C.22713.0
Liberal Democrats Lovatt J.17910.3
Green Mills A. Ms.1277.3
Turnout 1,74427.1
Registered electors 6,435
Labour hold
Labour gain from Conservative
Labour hold

Nevill

Nevill (3)
PartyCandidateVotes%
Conservative Lewis P. 1,406 50.3
Conservative Worgan M. 1,398 50.1
Conservative Wade S. 1,325 48.4
Labour James H. Ms.1,25044.8
Labour Anthony D.1,24244.5
Labour Spillman H.1,13340.6
Liberal Democrats Alldred E.1876.7
Green Phillips J. Ms.1234.4
Turnout 2,79345.3
Registered electors 6,165
Conservative hold
Conservative gain from Labour
Conservative hold

North Portslade

North Portslade (3)
PartyCandidateVotes%
Labour Carden B.* 1,720 70.3
Labour Steer H. 1,686 68.9
Labour Turner D. 1,638 66.9
Conservative Saunders D. Ms.63425.9
Conservative Braybrook B.60824.8
Conservative Hess M.53321.8
Green Gray K.1576.4
Turnout 2,44835.1
Registered electors 6,975
Labour hold
Labour hold
Labour hold

Patcham

Patcham (3)
PartyCandidateVotes%
Conservative Theobald C. Ms.* 2,156 59.3
Conservative Theobald G.* 2,153 59.2
Conservative Sheldon J. 2,076 57.1
Labour Blackwood R.1,11530.6
Labour Blackwood M. Ms.1,11430.6
Labour Miller H.1,00527.6
Liberal Democrats De Souza J. Ms.46912.9
Liberal Democrats Latimer D.3599.9
Liberal Democrats Latimer D. Ms.3569.8
Green Haase A.992.7
Turnout 3,63852.5
Registered electors 6,929
Conservative hold
Conservative hold
Conservative hold

Portslade South

Portslade South (3)
PartyCandidateVotes%
Labour Ivor Caplin* 1,611 61.2
Labour Collier S.* 1,552 59.0
Labour John S. Ms.* 1,434 55.0
Conservative Kemble E.70926.9
Conservative Greenwood C. Ms.70428.8
Conservative Veale M.68125.9
Liberal Democrats Donovan N.30011.4
Liberal Democrats James I.29511.2
Green Mylton-Thorley M. Ms.953.6
Turnout 2,63138.4
Registered electors 6,851
Labour hold
Labour hold
Labour hold

Preston

Preston (3)
PartyCandidateVotes%
Labour McCaffery J. Ms. 1,803 52.2
Labour Austin L. Ms. 1,792 51.9
Labour Spray J. Ms.* 1,756 50.9
Conservative Mallender G. Con1,26436.6
Conservative Marchant V.*1,26236.5
Conservative Nilchiber K.1,26236.5
Liberal Democrats Hunter T.3349.7
Liberal Democrats Potts S.2948.5
Liberal Democrats Schelwald E.2557.4
Green Littman L.2547.4
Turnout 3,45344.9
Registered electors 7,690
Labour hold
Labour gain from Conservative
Labour hold

Queens Park

Queens Park (3)
PartyCandidateVotes%
Labour Lythell J.* 1,623 67.6
Labour Bodfish K. 1,566 65.3
Labour Townsend J.* 1,540 64.2
Conservative Allaway H.62125.9
Conservative Vivian S. Ms.60125.0
Conservative Wells S. Ms.56223.4
Green Chadwick S. Ms27511.5
Liberal Democrats Blease J. Ms.1958.1
Liberal Democrats Blease J.1928.0
Turnout 2,40038.0
Registered electors 6,316
Labour hold
Labour gain from Conservative
Labour hold

Regency

Regency (3)
PartyCandidateVotes%
Labour Ping N.* 1,553 59.2
Labour Pennington R.* 1,430 54.5
Labour Warmington J. 1,404 53.5
Conservative Cameron J.77629.6
Conservative Boggon M.*75828.9
Conservative Cockman D.74128.3
Green Hyde Parker A.34713.2
Liberal Democrats Freeman T.2579.8
Liberal Democrats Guild J.2419.2
Liberal Democrats Cotton E.2037.7
Turnout 2,62336.3
Registered electors 7,227
Labour hold
Labour hold
Labour gain from Conservative

Rottingdean

Rottingdean (3)
PartyCandidateVotes%
Conservative Wrigley S. Ms.* 1,745 54.8
Conservative Hunt B. 1,738 54.6
Conservative Simon Radford-Kirby 1,697 53.3
Labour Bunting M.78324.6
Labour Moriarty J.73223.0
Labour Gray A. Ms.71522.5
Liberal Democrats Davidson D. Ms.47014.8
Liberal Democrats De Souza H.47014.8
Liberal Democrats Edwards P.43713.7
Ind. Conservative Grant M.2016.3
Ind. Conservative Wright N.*1936.1
Ind. Conservative Wright A. Ms.1815.7
Green Berrington J.1133.6
Turnout 3,18341.7
Registered electors 7,633
Conservative hold
Conservative hold
Conservative hold

Seven Dials

Seven Dials (3)
PartyCandidateVotes%
Labour Austin R. 1,784 76.0
Labour Middleton M.* 1,684 71.8
Labour Robinson N.* 1,680 71.6
Conservative Bowes P.43718.6
Conservative Gowans J.43718.6
Conservative Larkin R. Ms.41417.6
Green Needham I.35815.3
Liberal Democrats Heale R.26911.5
Liberal Democrats Oldfield E. Ms.2339.9
Liberal Democrats Huggins B.2319.8
Turnout 2,34631.8
Registered electors 7,377
Labour hold
Labour hold
Labour hold

St. Peters

St. Peters (3)
PartyCandidateVotes%
Green Pete West 1,576 41.9
Labour Charleton S. 1,517 40.4
Labour Gwyn-Jones L. Ms.* 1,451 38.6
Labour Simpson C. Ms.*1,40837.5
Green Whale R. Ms.97325.9
Green Young F. Ms.84522.5
Conservative Brimmell C.3118.3
Conservative Maclean E. Ms.2596.9
Conservative Maclean I.2376.3
Liberal Democrats Fairweather M.1995.3
Liberal Democrats Harden W.1624.3
Liberal Democrats Parker W.1353.6
Turnout 3,75750.1
Registered electors 7,499
Green gain from Labour
Labour hold
Labour hold

Stanford

Stanford (3)
PartyCandidateVotes%
Conservative Adams M. Ms.* 1,572 66.9
Conservative Kapp J.* 1,525 64.9
Conservative Rowe B.* 1,525 64.9
Labour Jones A.47820.3
Labour Montague S.46119.6
Labour Lord S.45919.5
Liberal Democrats Latham B.34214.5
Liberal Democrats Innes D. Ms.33114.1
Liberal Democrats Walls P.27411.7
Green Jester M.923.9
Turnout 2,35136.5
Registered electors 6,441
Conservative hold
Conservative hold
Conservative hold

Stanmer

Stanmer (3)
PartyCandidateVotes%
Labour Framroze T.* 1,597 50.8
Labour Hawkes P. Ms.* 1,589 50.6
Labour Beishon G. Ms. 1,551 49.4
Conservative Careless D.92229.4
Conservative Fairhall D.88628.2
Conservative Pacifico M.85427.2
Liberal Democrats Bailey P.2588.2
Green Tofts P.2317.4
Liberal Democrats Imms D. Ms.2076.6
Liberal Democrats Garrett P.2076.6
Turnout 3,14140.2
Registered electors 7,814
Labour hold
Labour hold
Labour gain from Conservative

Tenantry

Tenantry (3)
PartyCandidateVotes%
Labour Steve Bassam* 1,709 68.4
Labour Ballance J. 1,581 63.2
Labour Durr A.* 1,579 63.2
Conservative Dudeney D.62324.9
Conservative Toner M.*58023.2
Conservative Plater L.54922.0
Green Santamaria L.26010.4
Liberal Democrats Weller P.2419.5
Turnout 2,50033.6
Registered electors 7,539
Labour hold
Labour gain from Conservative
Labour hold

Vallance

Vallance (3)
PartyCandidateVotes%
Labour Battle S. 1,235 48.6
Labour Warman-Brown F. Ms.* 1,217 47.9
Labour Gibbling M.* 1,198 47.1
Conservative Martin P.97338.3
Conservative Peltzer Dunn G.96838.1
Conservative Bennett J. Ms.94137.0
Liberal Democrats Bates K. Ms.2349.2
Liberal Democrats Denyer P.2108.3
Ind. Conservative Hogan V.2088.2
Green Da Costa J. Ms.1686.6
Liberal Democrats Elgood P.1676.6
Turnout 2,54235.6
Registered electors 7,141
Labour hold
Labour hold
Labour hold

Westbourne

Westbourne (3)
PartyCandidateVotes%
Conservative Buttimer A. Ms.* 1,221 47.2
Conservative Brown V. Ms.* 1,186 45.8
Ind. Conservative Oxley B.* 1,041 40.2
Labour Cooper R.1,00839.0
Labour Benians G.99438.4
Labour Gill P.96537.3
Liberal Democrats Bull R. Ms.30511.8
Liberal Democrats Lake J. Ms.28911.2
Liberal Democrats Hayes D.27910.8
Ind. Conservative Furness N.2369.1
Green Mueller M.1134.4
Turnout 2,58735.3
Registered electors 7,330
Conservative hold
Conservative hold
Ind. Conservative gain from Conservative

Westdene

Westdene (3)
PartyCandidateVotes%
Conservative Drake H.* 1,656 47.0
Conservative Drake P. Ms. 1,624 46.1
Conservative Norman A. Ms. 1,514 43.0
Labour Prentice S. Ms.1,40239.8
Labour Allen K.1,40239.8
Labour Matz P.1,28236.4
Ind. Conservative Humphrey J.*3279.3
Ind. Conservative Barrett M.*2998.5
Liberal Democrats McBeth D.2436.9
Liberal Democrats Rimmington J. Ms.2226.3
Ind. Conservative Rogers L. Ms.2206.2
Liberal Democrats Brown P.2186.2
Green Keenan G. Ms.1865.3
Turnout 3,52447.8
Registered electors 7,373
Conservative hold
Conservative hold
Conservative hold

Wish

Wish (3)
PartyCandidateVotes%
Labour Bowden C.* 1,398 51.2
Labour Murphy P.* 1,289 47.2
Labour Pratt A.* 1,276 46.7
Conservative Cruikshank-Robb E.1,21144.3
Conservative Brand S. Ms.1,17042.8
Conservative Brand L.1,16042.5
Liberal Democrats Percy A.2539.3
Liberal Democrats Storey J.2469.0
Green Baker N.1896.9
Turnout 2,73140.8
Registered electors 6,695
Labour hold
Labour hold
Labour hold

Woodingdean

Woodingdean (3)
PartyCandidateVotes%
Labour Moorhouse M. Ms.* 1,635 49.0
Conservative Wells G. 1,608 48.2
Conservative Stiles P. Ms.* 1,515 45.4
Conservative Dudeney D.1,48944.6
Labour Griffiths G.1,38541.5
Labour Newington J.1,32539.7
Liberal Democrats Pearce L. Ms.3259.7
Green Powell V.1414.2
Turnout 3,33944.9
Registered electors 7,437
Labour hold
Conservative hold
Conservative hold

Related Research Articles

<span class="mw-page-title-main">1995 United Kingdom local elections</span>

The 1995 United Kingdom local elections took place on Thursday 6 April 1995 in Scotland, and Thursday 4 May 1995 in England and Wales. The Conservative Party lost over 2,000 councillors in the election, while the Labour Party won 48% of the vote, a record high for the party in local elections.

Brighton and Hove City Council is a unitary authority in East Sussex, England. It was created as Brighton and Hove Borough Council on 1 April 1997 replacing Brighton and Hove Borough Councils. It was granted city status in 2001.

Elections to Slough Borough Council were held on 4 May 2006. One third of the council was up for election. This was the 121st Slough general local authority election since Slough became a local government unit in 1863.

An election to Slough Borough Council was held on 10 June 2004. The whole council was up for election. This was the 120th Slough general local authority election, since Slough became a local government unit in 1863, including both whole Council elections and elections by thirds.

Elections to the Borough Council in Slough, England, were held on 3 May 2007. One third of the council was up for election. This was the 122nd Slough general local authority election since Slough became a local government unit in 1863.

<span class="mw-page-title-main">1996 United Kingdom local elections</span>

The 1996 United Kingdom local elections were held on 2 May 1996. They were the last local elections until 2010 to show a decline in the number of Conservative councillors and an increase in the number of Labour councillors.

<span class="mw-page-title-main">2011 Brighton and Hove City Council election</span>

Elections to Brighton and Hove City Council were held on 5 May 2011, in line with other local elections in the United Kingdom. The whole council, a unitary authority, was up for election with 54 councillors elected from 21 wards.

Milton Keynes City Council is the local authority for the City of Milton Keynes, a unitary authority in Buckinghamshire, England. Until 1 April 1997 it was a non-metropolitan district.

The first election to Rhondda Cynon Taf County Borough Council was held on 4 May 1995. It was followed by the 1999 election. On the same day there were elections to the other 21 local authorities in Wales and community councils in Wales.

Hove was a non-metropolitan district in East Sussex, England. It was abolished on 1 April 1997 and replaced by Brighton and Hove.

Brighton was a non-metropolitan district in East Sussex, England. It was abolished on 1 April 1997 and replaced by Brighton and Hove.

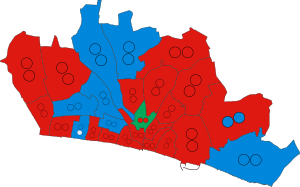
The 1995 Cardiff Council election was the first election to the new unitary County Council of the City and County of Cardiff following the re-organization of local government in Wales. It was held on Thursday 4 May 1995. It was followed by the 1999 elections. On the same day there were elections to the other 21 local authorities in Wales and community councils in Wales. Labour won a majority of the seats. It was preceded in Cardiff by the 1991 elections to Cardiff City Council and the 1993 elections to South Glamorgan County Council.

The 1999 Cardiff Council election was the second election to the post-1996 Cardiff Council following the re-organization of local government in Wales. It was held on Thursday 6 May 1999. It was preceded by the 1995 election and followed by the 2004 elections. On the same day the first elections to the Welsh Assembly were held as well as elections to the other 21 local authorities in Wales. Labour retained a majority of the seats.

The 2019 Bracknell Forest Borough Council election took place on 2 May 2019 to elect all 42 councillors in 18 wards for Bracknell Forest Borough Council in England.

The 1995 Vale of Glamorgan Council election was held on 4 May 1995 to the new Vale of Glamorgan Council unitary authority in Vale of Glamorgan, Wales. It took place on the same day as other council elections in Wales and England. These were the first elections since the re-organization of local government in Wales.

<span class="mw-page-title-main">2022 Barking and Dagenham London Borough Council election</span> 2022 local election in Barking and Dagenham

The 2022 Barking and Dagenham London Borough Council election took place on 5 May 2022. All 51 members of Barking and Dagenham London Borough Council were elected. The elections took place alongside local elections in the other London boroughs and elections to local authorities across the United Kingdom.

<span class="mw-page-title-main">2022 Ealing London Borough Council election</span> 2022 local election in Ealing

The 2022 Ealing London Borough Council election took place on 5 May 2022, under new election boundaries, which increased the number of Ealing London Borough Council councillors to 70. The elections took place alongside local elections in the other London boroughs and elections to local authorities across the United Kingdom.

<span class="mw-page-title-main">2022 Harrow London Borough Council election</span> 2022 local election in Harrow

The 2022 Harrow London Borough Council election took place on 5 May 2022. All 55 members of Harrow London Borough Council were elected. The elections took place alongside local elections in the other London boroughs and elections to local authorities across the United Kingdom.

<span class="mw-page-title-main">2022 Lambeth London Borough Council election</span>

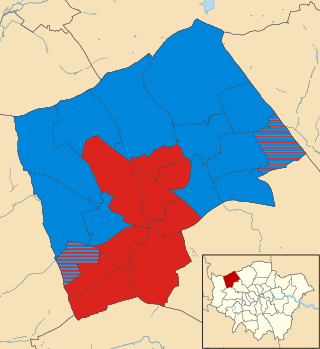
The 2022 Lambeth London Borough Council election took place on 5 May 2022. All 63 members of Lambeth London Borough Council were elected. The elections took place alongside local elections in the other London boroughs and elections to local authorities across the United Kingdom.

<span class="mw-page-title-main">2023 Brighton and Hove City Council election</span> English local election

The 2023 Brighton and Hove City Council election took place on 4 May 2023 to elect members of Brighton and Hove City Council, England. This was at the same time as other local elections in England. Due to a boundary review, there was a change in ward boundaries, but the city council continued to comprise 54 members.

References

  1. "Brighton & Hove City Council Election Results 1996-2011" (PDF). electionscentre.co.uk. Archived (PDF) from the original on 20 September 2018.