A Member of the Senedd is a representative elected to the Senedd. There are sixty members, with forty members chosen to represent individual Senedd constituencies, and twenty to represent the five electoral regions of the Senedd in Wales.
A presidential election is the election of any head of state whose official title is President.

Elections in Mauritania encompass four different types: presidential elections, parliamentary elections, regional elections and local elections.

Elections in Mexico are held every 6 years to elect a president and every 3 years to elect a legislature. These elections determine who, on the national level, takes the position of the head of state – the president – as well as the legislature.
Sri Lanka elects on the national level a head of state – the president – and a legislature. Sri Lanka has a multi-party system, with two dominant political parties. All elections are administered by the Election Commission of Sri Lanka.
At a national level, Greece holds elections for its legislature, the Hellenic Parliament.

Elections in Spain encompass four different types: general elections, regional elections, local elections, and elections to the European Parliament. General elections and regional elections are typically conducted at the conclusion of the national or regional legislative mandate, which usually spans four years since the previous election. However, early elections can be called in certain circumstances. On the other hand, local council elections and elections to the European Parliament follow fixed dates, although some local government bodies, such as provincial councils, are not directly elected. In most elections, a party-list proportional representation (PR) system is employed, while the Senate utilizes the plurality system.

Romania elects on a national level a head of state – the president – and a legislature. The president is elected for a five-year term by the people. The Romanian Parliament has two chambers. The Chamber of Deputies has currently 330 members, elected for a four-year term by party-list proportional representation on closed lists. The Senate has currently 136 members, elected for a four-year term by party-list proportional representation on closed lists.
Cape Verde elects on national level a head of state – the president – and a legislature. The president is elected for a five-year term by the people. The National Assembly has 72 members, elected for a five-year term by proportional representation. Cape Verde has a two-party system, which means that there are two dominant political parties, with extreme difficulty for anybody to achieve electoral success under the banner of any other party.

Elections in Portugal are free, fair, and regularly held, in accordance with election law.

Malta elects on a national level 6 MEPs representing Malta in the European Parliament, on a district level the legislature, On a local level the Local Councils and on a community level the Administrative Committees.
The Isle of Man partially elects its legislature at the national level. The High Court of Tynwald consists of two chambers. The House of Keys has 24 members, elected in a general election for a five-year term in 12 two-seat constituencies. Each voter has two votes and in each constituency the two candidates with the most votes are elected. The Legislative Council has 11 members: three ex-officio members and eight other members who are elected by the House of Keys for a five-year term. Political parties do not play an important role on the Island. The Isle of Man lowered its voting age from 18 to 16 in 2006.

Elections in Namibia determine who holds public political offices in the country. Namibia is a semi-presidential representative democratic republic. It runs direct elections every five years for the position of the president and seats in the National Assembly, and every six years for the Regional Councils and the distribution of seats in local authorities. The National Council is elected indirectly by the constituency councillors of Namibia's 14 regions.
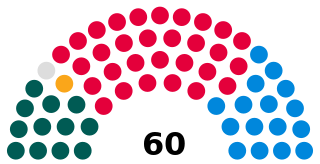
Trinidad and Tobago elects its House of Representatives on the national level. The head of government, the prime minister, is chosen from among the elected representatives on the basis of his or her command of the support of the majority of legislators. The Parliament of the Republic of Trinidad and Tobago has two chambers. The House of Representatives has 41 members, elected for a maximum five-year term in single-seat constituencies. The Senate has 31 members: 16 government senators appointed on the advice of the prime minister, six opposition senators appointed on the advice of the leader of the opposition and nine so-called independent senators appointed by the president to represent other sectors of civil society. The president is elected for a five-year term by an electoral college consisting of the members of both houses of Parliament. Other elected bodies include the local government bodies in Trinidad and the Tobago House of Assembly, which handles local government in the island of Tobago and is entrenched in the constitution.

Elections in Turkey are held for six functions of government: presidential elections (national), parliamentary elections (national), municipality mayors (local), district mayors (local), provincial or municipal council members (local) and muhtars (local). Apart from elections, referendums are also held occasionally.
The wards and electoral divisions in the United Kingdom are electoral districts at sub-national level, represented by one or more councillors. The ward is the primary unit of English electoral geography for civil parishes and borough and district councils, the electoral ward is the unit used by Welsh principal councils, while the electoral division is the unit used by English county councils and some unitary authorities. Each ward/division has an average electorate of about 5,500 people, but ward population counts can vary substantially. As of 2021 there are 8,694 electoral wards/divisions in the UK. An average area of wards in the United Kingdom is 27 km2.

There are five types of elections in the United Kingdom: elections to the House of Commons of the United Kingdom, elections to devolved parliaments and assemblies, local elections, mayoral elections, and Police and Crime Commissioner elections. Within each of those categories, there may also be by-elections. Elections are held on Election Day, which is conventionally a Thursday, and under the provisions of the Dissolution and Calling of Parliament Act 2022 the timing of general elections can be held at the discretion of the prime minister during any five-year period. All other types of elections are held after fixed periods, though early elections to the devolved assemblies and parliaments can occur in certain situations. The five electoral systems used are: the single member plurality system (first-past-the-post), the multi-member plurality, the single transferable vote, the additional member system, and the supplementary vote.

An election to the council of the electoral county of South Dublin within Dublin County to Dublin County Council took place on 27 June 1991 as part of that year's Irish local elections. 26 councillors were elected for a five-year term of office from five local electoral areas on the system of proportional representation by means of the single transferable vote. It was one of three electoral counties within Dublin County at this election, the others being Fingal and Dún Laoghaire–Rathdown. The term was extended twice, first to 1998, then to 1999.
An election to the electoral county of Dublin–Belgard within Dublin County to Dublin County Council took place on 20 June 1985 as part of that year's Irish local elections. Councillors were elected from local electoral areas on the system of proportional representation by means of the single transferable vote voting for a five-year term of office.This term was extended for a further year, to 1991.
An election to the electoral county of Dún Laoghaire–Rathdown within Dublin County to Dublin County Council took place on 20 June 1985 as part of that year's Irish local elections. Councillors were elected from local electoral areas on the system of proportional representation by means of the single transferable vote voting for a five-year term of office. This term was extended for a further year, to 1991.