
Demographic features of the population of Lithuania include population density, ethnicity, level of education, health, economic status, and religious affiliations.

The demographics of Nauru, an island country in the Pacific Ocean, are known through national censuses, which have been analysed by various statistical bureaus since the 1920s. The Nauru Bureau of Statistics have conducted this task since 1977—the first census since Nauru gained independence in 1968. The most recent census of Nauru was on 30 October 2021, when population had reached 11,680 people. The population density is 554 inhabitants per square kilometre, and the overall life expectancy is 63.9 years. The population rose steadily from the 1960s until 2006 when the Government of Nauru repatriated thousands of Tuvaluan and I-Kiribati workers from the country. Since 1992, Nauru's birth rate has exceeded its death rate; the natural growth rate is positive. In terms of age structure, the population is dominated by the 15–59-year-old segment (57%). The median age of the population is 21.6, and the estimated gender ratio of the population is 101.8 males per 100 females.

The demographics of New Zealand encompass the gender, ethnic, religious, geographic, and economic backgrounds of the 5.3 million people living in New Zealand. New Zealanders predominantly live in urban areas on the North Island. The five largest cities are Auckland, Wellington, Christchurch, Hamilton, and Tauranga. Few New Zealanders live on New Zealand's smaller islands. Waiheke Island is easily the most populated smaller island with 9,140 residents, while Great Barrier Island, the Chatham and Pitt Islands, and Stewart Island each have populations below 1,000. New Zealand is part of a realm and most people born in the realm's external territories of Tokelau, the Ross Dependency, the Cook Islands and Niue are entitled to New Zealand passports.

Demographics of the population of Oman include population density, ethnicity, education level, health of the populace, economic status, religious affiliations and other aspects.
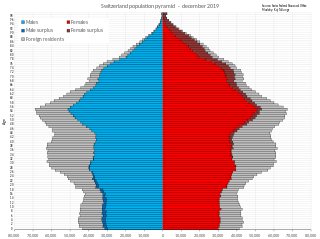
Switzerland has 9 million inhabitants, as of June 2024. Its population quadrupled over the period 1800 to 1990. Population growth was steepest in the period after World War II, it slowed during the 1970s and 1980s but has since increased to 1% during the 2000s.

Education in Indonesia falls under the responsibility of the Ministry of Primary and Secondary Education, Ministry of Higher Education, Science, and Technology, and the Ministry of Religious Affairs. In Indonesia, all citizens must undertake twelve years of compulsory education which consists of six years at elementary level and three each at middle and high school levels. Islamic, Christian, Hinduism, Buddhist and Confucianism schools are under the responsibility of the Ministry of Religious Affairs.

Ngatea is a small town on the Hauraki Plains in the North Island of New Zealand. It is located 18 kilometres southwest of Thames and 70 kilometres southeast of Auckland. Ngatea lies on the Piako River, eight kilometres south of its outflow into the Firth of Thames.
The National Center for Education Statistics (NCES) is the part of the United States Department of Education's Institute of Education Sciences (IES) that collects, analyzes, and publishes statistics on education and public school district finance information in the United States. It also conducts international comparisons of education statistics and provides leadership in developing and promoting the use of standardized terminology and definitions for the collection of those statistics. NCES is a principal agency of the U.S. Federal Statistical System.
Education in Mauritius is managed by the Ministry of Education & Human Resources, which controls the development and administration of state schools funded by government, but also has an advisory and supervisory role in respect of private schools. The Tertiary education is maintained by the Ministry of Tertiary Education, Science, Research and Technology. The government of Mauritius provides free education to its citizens from pre-primary to tertiary levels. Since July 2005, the government also introduced free transport for all students. Schooling is compulsory up to the age of 16. Mauritian students consistently rank top in the world each year for the Cambridge International O Level, International A and AS level examinations. Among sub-Saharan African countries, Mauritius has one of the highest literacy rates. The adult literacy rate was at 91.9% in 2022. According to the 2022 census, the proportion of people with higher education has increased to 8.8%. Mauritius was ranked 57th in the Global Innovation Index in 2023, 1st in Africa.

Fairfield is a suburb to the northeast of central Hamilton, New Zealand. Fairfield is named after the dairy farm of John Davies, who bought 100 acres from F. R. Claude. This area experienced rapid growth in the 1950s and 60s.

The educational attainment of the U.S. population refers to the highest level of education completed. The educational attainment of the U.S. population is similar to that of many other industrialized countries with the vast majority of the population having completed secondary education and a rising number of college graduates that outnumber high school dropouts. As a whole, the population of the United States is spending more years in formal educational programs. As with income, levels differ by race, age, household configuration, and geography.

Literacy in India is a key for social-economic progress. The 2011 census, indicated a 2001–2011 literacy growth of 97.2%, which is slower than the growth seen during the previous decade. An old analytical 1990 study estimated that it would take until 2060 for India to achieve universal literacy at then-current rate of progress.
Education in Kentucky includes elementary school, middle school, high school, and post-secondary institutions. Most Kentucky schools and colleges are accredited through the Southern Association of Colleges and Schools (SACS).

Hinds is a small town in the Mid-Canterbury region of New Zealand's South Island. It is located on the Canterbury Plains on the south bank of the Hinds River, which reaches the Pacific Ocean between the nearby localities of Longbeach and Lowcliffe. Other localities around Hinds include Ealing to the west, Willowby, Windermere, and Winslow to the northeast, and Eiffelton to the southeast.

Ahtahkakoop First Nation is a Cree First Nation band government in Shell Lake, Saskatchewan, Canada belonging to the Wāskahikaniwiyiniwak division of nēhiyawak. The Ahtahkakoop First Nation government and community is located on Ahtahkakoop 104, 72 kilometers northwest of Prince Albert and is 17,347 hectares in size. The community was formerly known as the "Sandy Lake Indian Band", a name which is still used interchangeably when referring to the reserve.

The Education Index is a component of the Human Development Index (HDI) published every year by the United Nations Development Programme. Alongside the economical indicators (GDP) and Life Expectancy Index, it helps measure the educational attainment. GNI (PPP) per capita and life expectancy are also used with the education index to get the HDI of each country.

The 2010 Chinese census, officially the Sixth National Population Census of the People's Republic of China (中华人民共和国第六次全国人口普查), was conducted by the National Bureau of Statistics of the People's Republic of China with a zero hour of November 1, 2010.

The 2020 Indonesian census was the 7th census in Indonesia. It was held in September 2020 by Statistics Indonesia. The resident Indonesia population was projected to be 269.6 million, a 13.4% increase from the 2010 census.

The 1961 Indonesian census was the first census of Indonesia as a sovereign state. With a total population of 97,018,829, Indonesia was the world's fifth-most populous country at the time. The census covered all territories in the country, but no enumeration was done in Indonesian-claimed Western New Guinea because it was under Dutch occupation. Instead, an estimated population for the region was included in the final census numbers. During the 1961 census, its population density was 50.9 inhabitants/km2.
