Political turmoil in Egypt, Libya, Yemen, and Bahrain drove oil prices to $95/barrel in late February 2011. A few days prior, oil prices on the NYMEX closed at $86. Oil prices topped at $103 on February 24 where oil production is curtailed to the political upheaval in Libya.[1]
Oil supplies remained high, and Saudi Arabia assured an increase in production to counteract shutdowns. Still, the Mideast and North African crisis led to a rise in oil prices to the highest level in two years, with gasoline prices following. Though most Libyan oil went to Europe, all oil prices reacted. The average price of gasoline in the United States increased 6 cents to $3.17.[2] On March 1, 2011, a significant drop in Libyan production and fears of more instability in other countries pushed the price of oil over $100 a barrel in New York trading, while the average price of gas reached $3.37. Despite Saudi promises, the sour type oil the country exported could not replace the more desirable sweet Libyan oil.[3] On March 7, 2011, the average price of gas having reached $3.57, individuals were making changes in their driving.[4]
The weakened U.S. Dollar resulted in a spike to $112/barrel with the national average of $3.74/gallon – with expectations of damaging the U.S. economy suggestive of a long-term recession.[5] As of April 26, the national average was $3.87 – with a fear of $4/gallon as the nationwide average prior to the summer driving season.[6]
The national average rose on May 5, 2011 for the 44th straight day, reaching $3.98. However, that same day, West Texas Intermediate crude fell below $100 a barrel, the lowest since March 16.[7] This came after crude oil for June delivery reached $114.83 on May 2, the highest since September 2008, before closing at $97.18 on May 6, a day after dropping 9%, the most dramatic single-day drop in over two years. Gas prices fell slightly on May 6, and experts predicted $3.50 a gallon by summer.[8][9][10]
In mid-June, West Texas Intermediate crude for July delivery fell nearly $2 to $93.01, the lowest price since February. The dollar was up and the euro and other currencies down, and the European economic crisis made investors concerned. London Brent crude fell 81 cents to $113.21. On June 15 the Energy Information Association said oil consumption was down 3.5% from a year earlier, but wholesale gasoline demand was up for the first time in several weeks. The price of gas on June 17 was $3.67.5 a gallon, 25.1 cents lower than a month earlier but 96.8 cents above a year earlier.[11] On June 24, the price of gas was $3.62.8 and expected to go much lower due to the opening of the Strategic Petroleum Reserve. U.S. oil prices fell below $90 before rising again, and Brent crude fell 2%.[12] However, on June 29, West Texas intermediate crude had risen to $94.96, almost $5 above the lowest point reached after the previous week's action. One reason was the falling dollar, as Greece appeared less likely to default on its debt; concern over the Greek debt crisis had caused falling oil prices.[13][14] After another week, oil for August delivery had risen from $90.61 to $98.67 and gas prices were up five cents. Increased worldwide demand was one reason.[15]Brent Crude remained high at $118.38 partly due to supply problems in Europe, including lower North Sea production and the continuing war in Libya.[16]
On August 4, the price of oil dropped 6% to its lowest level in 6 months. On August 5, the price had dropped $8.82 in a week to $86.88 per barrel on the New York Mercantile Exchange. The same pessimistic economic news that caused stock prices to fall also decreased expected energy demand, and experts predicted a gas price drop of 35 cents per gallon from the average of $3.70.[17] On August 8, oil fell over 6%, in its largest drop since May, to $81, its lowest price of the year.[18] On September 24, oil reached $79.85, down 9% for the week, due to concerns about another recession and the overall world economy. The average price of gas was $3.51, with predictions of $3.25 by November, but it was below $3 in some markets.[19]
During October, the price of oil rose 22%, the fastest pace since February, as worries over the U.S. economy decreased, leading to predictions of $4 by early 2012. As of November 8, the price reached $96.80. Gas prices were not following the increase, due to lower demand resulting from the economy, the normal decrease in travel, lower oil prices in other countries, and production of winter blends which cost less. The average rose slightly to $3.41 but predictions of $3.25 were made.[20]
2012
Brent versus WTI
Shortages of oil could have resulted if Iran closed the Strait of Hormuz, through which one-fifth of exported oil travels, as a result of sanctions due to the country's nuclear policies. The price of oil stayed near $100 throughout January because of concerns over supplies, and the European debt situation. The average price of gas was $3.38 on January 20, up 17 cents from a month earlier.[21][22] Another factor was planned closing of refineries in the U.S. and Europe due to lower demand.[23] By early February, the national average was $3.48, though oil prices were at $98, the lowest in six weeks, and U.S. demand was the lowest since September 2001.[24] On February 20, benchmark March crude oil reached $105.21, the highest in nine months. This came one day after Iran's oil ministry announced an end to sales to British and French companies; though this would have little actual impact on supplies, fears resulted in higher prices. Also, approval of the bailout plan for Greece was expected, and China's action to raise the money supply was likely to stimulate the economy.[25] Brent crude was up 11% for the year to $119.58 on February 17, with cold weather in Europe and higher Third World demand, and West Texas Intermediate crude was up 19% to $103.24. The average price of gas was $3.53.[26] On February 29, the average was $3.73.[27] The average peaked at $3.94 early in April,[28][29][30][31] and on April 24, it was $3.85 compared to $3.86 a year earlier; it had been two years since gas prices were lower than the previous year. Crude oil prices were down; West Texas Intermediate was $103.55 a barrel,[32] down from over $107 late in March,[33] and Brent Crude $118.16[32] after peaking above $128 in March.[34] On May 7, benchmark U.S. crude reached $95.34, the lowest price of the year, after voters in France and Greece ousted government officials who would cut spending to solve the debt crisis.[35] Benchmark oil in New York actually rose for two days straight early in June, to $84.29. With U.S. oil supplies the highest since 1990, gas reached $3.57 on June 5.[36] After falling again to its lowest price since October 2011, Benchmark crude rose 5.8% to $82.18 on June 29, with Brent crude up 4.5% to $95.51. European bailout efforts included lending money to banks, decreasing likelihood of failures. Also, European countries decided not to buy Iranian oil. The price of gas was $3.35, the lowest since January 6.[37] On July 17, Benchmark Crude reached $89.22 and Brent crude $104 after good economic news in the United States. Gas rose to $3.40.[38]
On August 7, a California refinery fire contributed to a jump in oil futures. Other refinery problems, a pipeline leak, fears about Iran, the crisis in Syria, North Sea problems, and Tropical Storm Ernesto all contributed to a 20% jump in oil prices in six weeks. The price of gas reached $3.63 but was not expected to go much higher.[39] Good economic news in the United States contributed to oil reaching its highest price since May on August 17, with Benchmark Crude reaching $96.01, while Brent crude fell slightly to $113.71.[40]
Early in September, a mix of bad economic news from the United States and good economic news from Europe caused the price of oil to fall slightly. On September 4, Benchmark Crude reached $95.41, with Brent crude at $114.84. The price of gas went down slightly to $3.82[41] but was still the highest ever for Labor Day weekend.[42]Hurricane Isaac contributed to a temporary spike in gas prices, but on September 12 gas once again rose, to $3.86, as refineries cut production prior to the switch from summer blend gasoline to winter blend. Benchmark Crude also reached its highest level since early May and continued to rise above $99 after Federal Reserve announcements of actions to improve the economy and the 2012 diplomatic missions attacks. Brent crude rose slightly to nearly $116.[43][44][45] Early in October, the average gas price was $3.78 and falling, though still a record for the month.[46] Late in the month, the average reached $3.62 after a 13-cent drop in a week, the most since November 2008. Brent crude was down $8 in the previous month.[47] By the start of November, the average was $3.54, partly due to lower demand after Hurricane Sandy.[48] Crude oil futures fell after Barack Obama was re-elected November 6.[49] After Thanksgiving, lower U.S. oil inventories, good economic news in the United States and good news relating to the Greek bailout helped push Brent crude up to $111.04, and benchmark oil for January delivery to $87.92; benchmark oil reached $86.24 on November 28, and gas was $3.41.[50][51]
On December 13, Brent crude was down to $109.20, while benchmark oil fell slightly due to U.S. fiscal cliff concerns and rose due to Federal Reserve efforts to help the U.S. economy, ending the day at $86.77.[52] In mid-December, gas prices reached $3.25, the lowest for 2012.[53] Oil was trading for between $84 and $90.[54]
2013
On January 17, with good economic news in the United States, Benchmark oil reached its highest level since September, going over $95. Brent crude rose above $110. Gas was at $3.29.[55]
Refinery shutdowns led to a dramatic rise in gas prices. Late in February, gas was at $3.78, up 14 cents from a week earlier.[56][57] On February 25, with European stock markets doing well, Benchmark crude for April rose above $94 after a significant drop the previous week due to news the Federal Reserve might end its stimulus efforts, making the dollar stronger. Brent crude was over $115.[58] Two days later gas reached its highest point, $3.79 a gallon. By mid-April, with low demand expected due to negative economic news, gas was down to $3.56 as Brent crude fell to $103.04, its lowest price since July.[59] With economic problems worldwide leading to low demand, gas prices fell 3% in April, the most in a month in ten years, to the lowest level for that month since 2010.[60]
Before Memorial Day, when gas was $3.63,[61] gas supplies fell even though oil supplies were the highest in 35 years. U.S. economic news was also negative. On May 30, Benchmark crude for July rose slightly to $93.61 after falling the previous day, and Brent crude fell slightly to $102.19.[62] On June 5 the price of oil rose again with supplies lower. Benchmark crude rose above $94. The price of gas was $3.62.[63] On June 12, the International Energy Agency said demand for oil would still rise in 2013, but not as much as previously believed due to the economy. Also, May OPEC production was the highest in seven months. Benchmark crude fell slightly to $95.31, and Brent crude rose to $103.27.[64] On June 20, with the Federal Reserve stating that its stimulus program could end if the U.S. economy continued to improve, as well as economic problems in China, Benchmark crude fell below $97. Brent crude fell to $104.24.[65]
On July 10, oil prices were the highest in more than a year as a result of lower supplies and trouble in Egypt. In the past week, Brent crude had climbed 7% to $108.51. Because too much oil was being produced for the infrastructure to handle it, West Texas Intermediate was lower than Brent crude for several years; it has returned to being consistent with Brent.[66][67] On July 5 it reached $103.22.[68] On July 19 with good economic news in the United States, Benchmark crude reached $108.05, while gas was $3.67, the highest on a Friday since March 22. Brent crude was at $108.07.[69] Gas was $3.63 on August 1, though good economic news in the U.S., China and Europe meant oil was going up again after a decline the previous week. Benchmark crude reached $107.89, while Brent crude was $109.54.[70] On August 16 Benchmark oil was $107.46 after six days of increases as Egypt's problems continued. The concern was access to the Suez Canal, which appears unlikely to be a problem but still concerns companies. Brent crude was $110.48 on August 19.[71] On August 28 West Texas intermediate reached $110.10, the highest since May 2011, and Brent crude reached $116.61, its highest point since February 19, due to concern about U.S. involvement in Syria. Meanwhile, inventories in the United States had their biggest increase in four months.[72] Benchmark crude rose to $107.56 on September 11 due to lower supplies after dropping due to hopes for a peaceful Syria solution; Brent crude rose to $111.50.[73]
Gas was $3.59 at the start of the month, but at the end of September, the price of gas was $3.39, the lowest for the time of year since 2010. The New York Mercantile Exchange price on September 27 was $102.87. Refineries had no hurricanes or other problems.[74][75] Benchmark crude fell to $103.31 on October 3 after the U.S. government shutdown, and Brent crude was $109.[76] On October 21, Benchmark crude was $99.22, the first time below $100 since July. Higher supplies and fewer threats from the Middle East were the reasons. Brent crude was $109.64 and gas reached $3.35.[77] On November 13, Brent crude reached $107.12 and was $13.24 higher than West Texas Intermediate, the largest difference since April, due to trouble in Libya and sanctions against Iran.[78] On November 25, Benchmark crude decreased to $93.92 while Brent crude reached $110.41 after the agreement regarding Iran's nuclear program.[79] On December 16, Benchmark crude rose to $97.44 and Brent crude reached $110.53 with good economic news from Europe and more Libya trouble. Gas was $3.23, three cents higher than a month earlier.[80] On December 27, due to a better economy in the United States leading to higher demand, oil closed about $100 for the first time since October. Gas was $3.27, two cents below a year earlier.[81]
The economy of Alberta is the sum of all economic activity in Alberta, Canada's fourth largest province by population. Alberta's GDP in 2018 was CDN$338.2 billion.
Petroleum, also known as crude oil, or simply oil, is a naturally occurring yellowish-black liquid mixture of mainly hydrocarbons, and is found in geological formations. The name petroleum covers both naturally occurring unprocessed crude oil and petroleum products that consist of refined crude oil. A fossil fuel, petroleum is formed when large quantities of dead organisms, mostly zooplankton and algae, are buried underneath sedimentary rock and subjected to both prolonged heat and pressure.
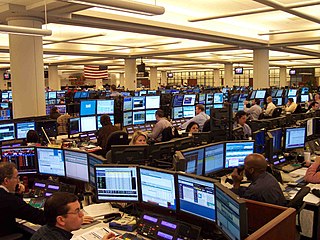
A commodity market is a market that trades in the primary economic sector rather than manufactured products, such as cocoa, fruit and sugar. Hard commodities are mined, such as gold and oil. Futures contracts are the oldest way of investing in commodities. Commodity markets can include physical trading and derivatives trading using spot prices, forwards, futures, and options on futures. Farmers have used a simple form of derivative trading in the commodity market for centuries for price risk management.
The 1979 oil crisis, also known as the 1979 Oil Shock or Second Oil Crisis, was an energy crisis caused by a drop in oil production in the wake of the Iranian Revolution. Although the global oil supply only decreased by approximately four percent, the oil markets' reaction raised the price of crude oil drastically over the next 12 months, more than doubling it to $39.50 per barrel ($248/m3). The sudden increase in price was connected with fuel shortages and long lines at gas stations similar to the 1973 oil crisis.
A fuel tax is an excise tax imposed on the sale of fuel. In most countries the fuel tax is imposed on fuels which are intended for transportation. Fuels used to power agricultural vehicles, and/or home heating oil which is similar to diesel are taxed at a different, usually lower rate. The fuel tax receipts are often dedicated or hypothecated to transportation projects so that the fuel tax is considered by many a user fee. In other countries, the fuel tax is a source of general revenue. Sometimes, the fuel tax is used as an ecotax, to promote ecological sustainability. Fuel taxes are often considered by government agencies such as the Internal Revenue Service as regressive taxes.
West Texas Intermediate (WTI) is a grade or mix of crude oil; the term is also used to refer to the spot price, the futures price, or assessed price for that oil. In colloquial usage, WTI usually refers to the WTI Crude Oil futures contract traded on the New York Mercantile Exchange (NYMEX). The WTI oil grade is also known as Texas light sweet, oil produced from any location can be considered WTI if the oil meets the required qualifications. Spot and futures prices of WTI are used as a benchmark in oil pricing. This grade is described as light crude oil because of its low density and sweet because of its low sulfur content.
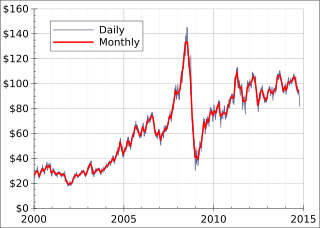
From the mid-1980s to September 2003, the inflation-adjusted price of a barrel of crude oil on NYMEX was generally under US$25/barrel in 2008 dollars. During 2003, the price rose above $30, reached $60 by 11 August 2005, and peaked at $147.30 in July 2008. Commentators attributed these price increases to many factors, including Middle East tension, soaring demand from China, the falling value of the U.S. dollar, reports showing a decline in petroleum reserves, worries over peak oil, and financial speculation.
Light crude oil is liquid petroleum that has a low density and flows freely at room temperature. It has a low viscosity, low specific gravity and high API gravity due to the presence of a high proportion of light hydrocarbon fractions. It generally has a low wax content. Light crude oil receives a higher price than heavy crude oil on commodity markets because it produces a higher percentage of gasoline and diesel fuel when converted into products by an oil refinery.
The economic effects of Hurricane Katrina, which hit Louisiana, Florida, Texas and Mississippi in late August 2005, were far-reaching.
The price of oil, or the oil price, generally refers to the spot price of a barrel of benchmark crude oil—a reference price for buyers and sellers of crude oil such as West Texas Intermediate (WTI), Brent Crude, Dubai Crude, OPEC Reference Basket, Tapis crude, Bonny Light, Urals oil, Isthmus and Western Canadian Select (WCS). Oil prices are determined by global supply and demand, rather than any country's domestic production level.
A benchmark crude or marker crude is a crude oil that serves as a reference price for buyers and sellers of crude oil. There are three primary benchmarks, West Texas Intermediate (WTI), Brent Blend, and Dubai Crude. Other well-known blends include the OPEC Reference Basket used by OPEC, Tapis Crude which is traded in Singapore, Bonny Light used in Nigeria, Urals oil used in Russia and Mexico's Isthmus. Energy Intelligence Group publishes a handbook which identified 195 major crude streams or blends in its 2011 edition.
National Iranian Oil Refining and Distribution Company (NIORDC) is part of the Ministry of Petroleum of Iran. NIORDC was established on 8 March 1991 and undertook to perform all operations relating to refining and distribution of oil products.
The usage and pricing of gasoline results from factors such as crude oil prices, processing and distribution costs, local demand, the strength of local currencies, local taxation, and the availability of local sources of gasoline (supply). Since fuels are traded worldwide, the trade prices are similar. The price paid by consumers largely reflects national pricing policy. Most countries impose taxes on gasoline (petrol), which causes air pollution and climate change; whereas a few, such as Venezuela, subsidize the cost. Some country's taxes do not cover all the negative externalities, that is they do not make the polluter pay the full cost. Western countries have among the highest usage rates per person. The largest consumer is the United States.
The 2000s commodities boom or the commodities super cycle was the rise of many physical commodity prices during the early 21st century (2000–2014), following the Great Commodities Depression of the 1980s and 1990s. The boom was largely due to the rising demand from emerging markets such as the BRIC countries, particularly China during the period from 1992 to 2013, as well as the result of concerns over long-term supply availability. There was a sharp down-turn in prices during 2008 and early 2009 as a result of the credit crunch and sovereign debt crisis, but prices began to rise as demand recovered from late 2009 to mid-2010.
From the mid-1980s to September 2003, the inflation adjusted price of a barrel of crude oil on NYMEX was generally under $25/barrel. Then, during 2004, the price rose above $40, and then $60. A series of events led the price to exceed $60 by August 11, 2005, leading to a record-speed hike that reached $75 by the middle of 2006. Prices then dropped back to $60/barrel by the early part of 2007 before rising steeply again to $92/barrel by October 2007, and $99.29/barrel for December futures in New York on November 21, 2007. Throughout the first half of 2008, oil regularly reached record high prices. Prices on June 27, 2008, touched $141.71/barrel, for August delivery in the New York Mercantile Exchange, amid Libya's threat to cut output, and OPEC's president predicted prices may reach $170 by the Northern summer. The highest recorded price per barrel maximum of $147.02 was reached on July 11, 2008. After falling below $100 in the late summer of 2008, prices rose again in late September. On September 22, oil rose over $25 to $130 before settling again to $120.92, marking a record one-day gain of $16.37. Electronic crude oil trading was temporarily halted by NYMEX when the daily price rise limit of $10 was reached, but the limit was reset seconds later and trading resumed. By October 16, prices had fallen again to below $70, and on November 6 oil closed below $60. Then in 2009, prices went slightly higher, although not to the extent of the 2005–2007 crisis, exceeding $100 in 2011 and most of 2012. Since late 2013 the oil price has fallen below the $100 mark, plummeting below the $50 mark one year later.
Western Canadian Select (WCS) is a heavy sour blend of crude oil that is one of North America's largest heavy crude oil streams and, historically, its cheapest. It was established in December 2004 as a new heavy oil stream by EnCana, Canadian Natural Resources, Petro-Canada and Talisman Energy. It is composed mostly of bitumen blended with sweet synthetic and condensate diluents and 21 existing streams of both conventional and unconventional Alberta heavy crude oils at the large Husky Midstream General Partnership terminal in Hardisty, Alberta. Western Canadian Select—the benchmark for heavy, acidic crudes—is one of many petroleum products from the Western Canadian Sedimentary Basin oil sands. Calgary-based Husky Energy, now a subsidiary of Cenovus, had joined the initial four founders in 2015.
A worldwide increase in inflation began in mid-2021, with many countries seeing their highest inflation rates in decades. It has been attributed to various causes, including pandemic-related economic dislocation; the fiscal and monetary stimulus provided in 2020 and 2021 by governments and central banks around the world in response to the pandemic were also instrumental. Unexpected recovery in demand through 2021 ultimately led to historic and broad supply shortages amid increasing consumer demand. Worldwide construction sectors were also hit.
This page is based on this Wikipedia article Text is available under the CC BY-SA 4.0 license; additional terms may apply. Images, videos and audio are available under their respective licenses.