
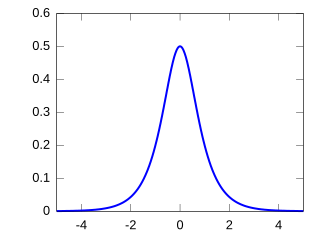
The Cauchy distribution, named after Augustin Cauchy, is a continuous probability distribution. It is also known, especially among physicists, as the Lorentz distribution, Cauchy–Lorentz distribution, Lorentz(ian) function, or Breit–Wigner distribution. The Cauchy distribution is the distribution of the x-intercept of a ray issuing from with a uniformly distributed angle. It is also the distribution of the ratio of two independent normally distributed random variables with mean zero.
In statistics, a location parameter of a probability distribution is a scalar- or vector-valued parameter , which determines the "location" or shift of the distribution. In the literature of location parameter estimation, the probability distributions with such parameter are found to be formally defined in one of the following equivalent ways:

In probability theory and statistics, a probability distribution is the mathematical function that gives the probabilities of occurrence of different possible outcomes for an experiment. It is a mathematical description of a random phenomenon in terms of its sample space and the probabilities of events.
A parameter, generally, is any characteristic that can help in defining or classifying a particular system. That is, a parameter is an element of a system that is useful, or critical, when identifying the system, or when evaluating its performance, status, condition, etc.

In probability theory, a probability density function (PDF), or density of a continuous random variable, is a function whose value at any given sample in the sample space can be interpreted as providing a relative likelihood that the value of the random variable would be equal to that sample. Probability density is the probability per unit length, in other words, while the absolute likelihood for a continuous random variable to take on any particular value is 0, the value of the PDF at two different samples can be used to infer, in any particular draw of the random variable, how much more likely it is that the random variable would be close to one sample compared to the other sample.
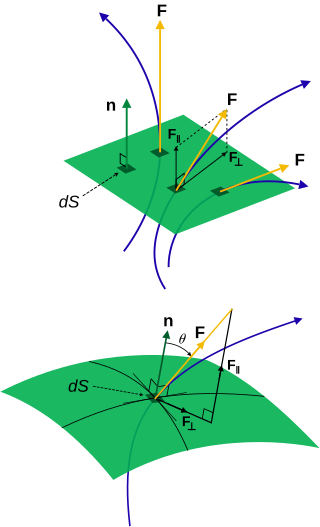
Flux describes any effect that appears to pass or travel through a surface or substance. Flux is a concept in applied mathematics and vector calculus which has many applications to physics. For transport phenomena, flux is a vector quantity, describing the magnitude and direction of the flow of a substance or property. In vector calculus flux is a scalar quantity, defined as the surface integral of the perpendicular component of a vector field over a surface.
The likelihood function represents the probability of random variable realizations conditional on particular values of the statistical parameters. Thus, when evaluated on a given sample, the likelihood function indicates which parameter values are more likely than others, in the sense that they would have made the observed data more probable. Consequently, the likelihood is often written as instead of , to emphasize that it is to be understood as a function of the parameters instead of the random variable .

The Pareto distribution, named after the Italian civil engineer, economist, and sociologist Vilfredo Pareto, is a power-law probability distribution that is used in description of social, quality control, scientific, geophysical, actuarial, and many other types of observable phenomena; the principle originally applied to describing the distribution of wealth in a society, fitting the trend that a large portion of wealth is held by a small fraction of the population. The Pareto principle or "80-20 rule" stating that 80% of outcomes are due to 20% of causes was named in honour of Pareto, but the concepts are distinct, and only Pareto distributions with shape value of log45 ≈ 1.16 precisely reflect it. Empirical observation has shown that this 80-20 distribution fits a wide range of cases, including natural phenomena and human activities.

In probability theory and statistics, the Weibull distribution is a continuous probability distribution. It is named after Swedish mathematician Waloddi Weibull, who described it in detail in 1951, although it was first identified by Maurice René Fréchet and first applied by Rosin & Rammler (1933) to describe a particle size distribution.
In mathematics, a Gaussian function, often simply referred to as a Gaussian, is a function of the base form

Non-uniform rational basis spline (NURBS) is a mathematical model using basis splines (B-splines) that is commonly used in computer graphics for representing curves and surfaces. It offers great flexibility and precision for handling both analytic and modeled shapes. It is a type of curve modeling, as opposed to polygonal modeling or digital sculpting. NURBS curves are commonly used in computer-aided design (CAD), manufacturing (CAM), and engineering (CAE). They are part of numerous industry-wide standards, such as IGES, STEP, ACIS, and PHIGS. Tools for creating and editing NURBS surfaces are found in various 3D graphics and animation software packages.

In materials science, fatigue is the initiation and propagation of cracks in a material due to cyclic loading. Once a fatigue crack has initiated, it grows a small amount with each loading cycle, typically producing striations on some parts of the fracture surface. The crack will continue to grow until it reaches a critical size, which occurs when the stress intensity factor of the crack exceeds the fracture toughness of the material, producing rapid propagation and typically complete fracture of the structure.

A contour line of a function of two variables is a curve along which the function has a constant value, so that the curve joins points of equal value. It is a plane section of the three-dimensional graph of the function parallel to the -plane. More generally, a contour line for a function of two variables is a curve connecting points where the function has the same particular value.

In probability theory and statistics, the Lévy distribution, named after Paul Lévy, is a continuous probability distribution for a non-negative random variable. In spectroscopy, this distribution, with frequency as the dependent variable, is known as a van der Waals profile. It is a special case of the inverse-gamma distribution. It is a stable distribution.
In probability theory and statistics, the hyperbolic secant distribution is a continuous probability distribution whose probability density function and characteristic function are proportional to the hyperbolic secant function. The hyperbolic secant function is equivalent to the reciprocal hyperbolic cosine, and thus this distribution is also called the inverse-cosh distribution.

The term surface roughness has different interpretations and definitions depending from the disciplines considered. For example in Earth Sciences and Ecology surface roughness is interpreted differently from surface metrology.
In statistics, M-estimators are a broad class of extremum estimators for which the objective function is a sample average. Both non-linear least squares and maximum likelihood estimation are special cases of M-estimators. The definition of M-estimators was motivated by robust statistics, which contributed new types of M-estimators. The statistical procedure of evaluating an M-estimator on a data set is called M-estimation. 48 samples of robust M-estimators can be found in a recent review study.
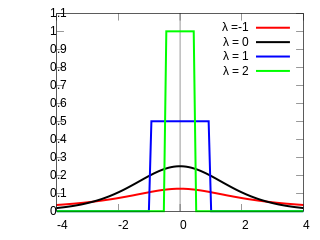
Formalized by John Tukey, the Tukey lambda distribution is a continuous, symmetric probability distribution defined in terms of its quantile function. It is typically used to identify an appropriate distribution and not used in statistical models directly.
Waviness is the measurement of the more widely spaced component of surface texture. It is a broader view of roughness because it is more strictly defined as "the irregularities whose spacing is greater than the roughness sampling length". It can occur from machine or work deflections, chatter, residual stress, vibrations, or heat treatment. Waviness should also be distinguished from flatness, both by its shorter spacing and its characteristic of being typically periodic in nature.
The survival function is a function that gives the probability that a patient, device, or other object of interest will survive past a certain time. The survival function is also known as the survivor function or reliability function. The term reliability function is common in engineering while the term survival function is used in a broader range of applications, including human mortality. The survival function is the complementary cumulative distribution function of the lifetime. Sometimes complementary cumulative distribution functions are called survival functions in general.
