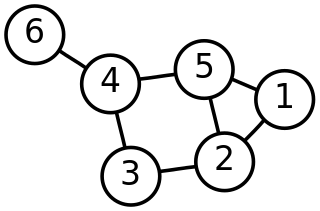
In mathematics, graph theory is the study of graphs, which are mathematical structures used to model pairwise relations between objects. A graph in this context is made up of vertices which are connected by edges. A distinction is made between undirected graphs, where edges link two vertices symmetrically, and directed graphs, where edges link two vertices asymmetrically; see Graph for more detailed definitions and for other variations in the types of graph that are commonly considered. Graphs are one of the prime objects of study in discrete mathematics.
In mathematics, particularly graph theory, and computer science, a directed acyclic graph, is a finite directed graph with no directed cycles. That is, it consists of finitely many vertices and edges, with each edge directed from one vertex to another, such that there is no way to start at any vertex v and follow a consistently-directed sequence of edges that eventually loops back to v again. Equivalently, a DAG is a directed graph that has a topological ordering, a sequence of the vertices such that every edge is directed from earlier to later in the sequence.
Test-driven development (TDD) is a software development process that relies on the repetition of a very short development cycle: requirements are turned into very specific test cases, then the software is improved to pass the new tests, only. This is opposed to software development that allows software to be added that is not proven to meet requirements.
In bioinformatics and evolutionary biology, a substitution matrix describes the rate at which one character in a sequence changes to other character states over time. Substitution matrices are usually seen in the context of amino acid or DNA sequence alignments, where the similarity between sequences depends on their divergence time and the substitution rates as represented in the matrix.

A scatter plot is a type of plot or mathematical diagram using Cartesian coordinates to display values for typically two variables for a set of data. If the points are coded (color/shape/size), one additional variable can be displayed. The data are displayed as a collection of points, each having the value of one variable determining the position on the horizontal axis and the value of the other variable determining the position on the vertical axis.
In genetics, a sequence motif is a nucleotide or amino-acid sequence pattern that is widespread and has, or is conjectured to have, a biological significance. For proteins, a sequence motif is distinguished from a structural motif, a motif formed by the three-dimensional arrangement of amino acids which may not be adjacent.
Data-flow analysis is a technique for gathering information about the possible set of values calculated at various points in a computer program. A program's control flow graph (CFG) is used to determine those parts of a program to which a particular value assigned to a variable might propagate. The information gathered is often used by compilers when optimizing a program. A canonical example of a data-flow analysis is reaching definitions.

A porous medium or a porous material is a material containing pores (voids). The skeletal portion of the material is often called the "matrix" or "frame". The pores are typically filled with a fluid. The skeletal material is usually a solid, but structures like foams are often also usefully analyzed using concept of porous media.
A Gap penalty is a method of scoring alignments of two or more sequences. When aligning sequences, introducing gaps in the sequences can allow an alignment algorithm to match more terms than a gap-less alignment can. However, minimizing gaps in an alignment is important to create a useful alignment. Too many gaps can cause an alignment to become meaningless. Gap penalties are used to adjust alignment scores based on the number and length of gaps. The five main types of gap penalties are constant, linear, affine, convex, and Profile-based.

The growth–share matrix is a chart that was created by Bruce D. Henderson for the Boston Consulting Group in 1970 to help corporations to analyze their business units, that is, their product lines. This helps the company allocate resources and is used as an analytical tool in brand marketing, product management, strategic management, and portfolio analysis. Some analysis of market performance by firms using its principles has called its usefulness into question.
Cohen's kappa coefficient (κ) is a statistic which measures inter-rater agreement for qualitative (categorical) items. It is generally thought to be a more robust measure than simple percent agreement calculation, as κ takes into account the possibility of the agreement occurring by chance. There is controversy surrounding Cohen's kappa due to the difficulty in interpreting indices of agreement. Some researchers have suggested that it is conceptually simpler to evaluate disagreement between items. See the Limitations section for more detail.
Organizing is the establishment of effective authority relationships among selected work, persons and work places in order for the group to work together efficiently. Or it is a process of dividing work into sections and department
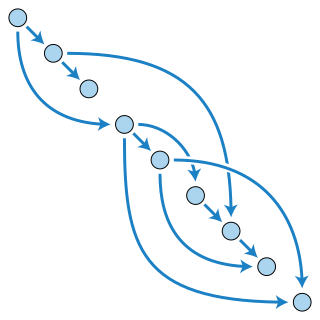
In mathematics, a transitive reduction of a directed graph D is another directed graph with the same vertices and as few edges as possible, such that if there is a (directed) path from vertex v to vertex w in D, then there is also such a path in the reduction. Transitive reductions were introduced by Aho, Garey & Ullman (1972), who provided tight bounds on the computational complexity of constructing them.

A bond graph is a graphical representation of a physical dynamic system. It allows the conversion of the system into a state-space representation. It is similar to a block diagram or signal-flow graph, with the major difference that the arcs in bond graphs represent bi-directional exchange of physical energy, while those in block diagrams and signal-flow graphs represent uni-directional flow of information. Bond graphs are multi-energy domain and domain neutral. This means a bond graph can incorporate multiple domains seamlessly.
This glossary of Unified Modeling Language terms covers all versions of UML. Individual entries will point out any distinctions that exist between versions.
In constraint satisfaction, local consistency conditions are properties of constraint satisfaction problems related to the consistency of subsets of variables or constraints. They can be used to reduce the search space and make the problem easier to solve. Various kinds of local consistency conditions are leveraged, including node consistency, arc consistency, and path consistency.
Computational phylogenetics is the application of computational algorithms, methods, and programs to phylogenetic analyses. The goal is to assemble a phylogenetic tree representing a hypothesis about the evolutionary ancestry of a set of genes, species, or other taxa. For example, these techniques have been used to explore the family tree of hominid species and the relationships between specific genes shared by many types of organisms. Traditional phylogenetics relies on morphological data obtained by measuring and quantifying the phenotypic properties of representative organisms, while the more recent field of molecular phylogenetics uses nucleotide sequences encoding genes or amino acid sequences encoding proteins as the basis for classification. Many forms of molecular phylogenetics are closely related to and make extensive use of sequence alignment in constructing and refining phylogenetic trees, which are used to classify the evolutionary relationships between homologous genes represented in the genomes of divergent species. The phylogenetic trees constructed by computational methods are unlikely to perfectly reproduce the evolutionary tree that represents the historical relationships between the species being analyzed. The historical species tree may also differ from the historical tree of an individual homologous gene shared by those species.

A matrix number is an alphanumeric code stamped or handwritten into the run-out groove area of a phonograph record. This is the non-grooved area between the end of the final band on a record's side and the label, also known as the run-off groove area, end-groove area, matrix area, or "dead wax".
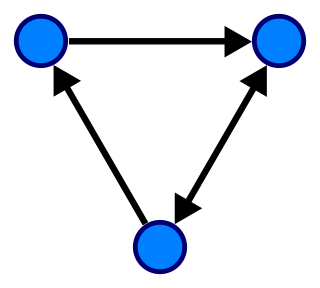
In mathematics, and more specifically in graph theory, a directed graph is a graph that is made up of a set of vertices connected by edges, where the edges have a direction associated with them.
This is a worked-through example showing the use of the analytic hierarchy process (AHP) in a practical decision situation.
