
A mind map is a diagram used to visually organize information into a hierarchy, showing relationships among pieces of the whole. It is often created around a single concept, drawn as an image in the center of a blank page, to which associated representations of ideas such as images, words and parts of words are added. Major ideas are connected directly to the central concept, and other ideas branch out from those major ideas.

Ishikawa diagrams are causal diagrams created by Kaoru Ishikawa that show the potential causes of a specific event.
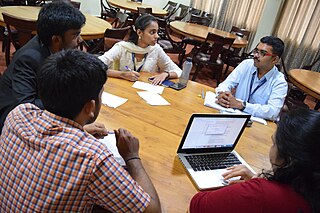
A focus group is a group interview involving a small number of demographically predefined participants. Their reactions to specific researcher/evaluator-posed questions are studied. Focus groups are used in market research to better understand people's reactions to products or services or participants' perceptions of shared experiences. The discussions can be guided or open. In market research, focus groups can explore a group's response to a new product or service. As a program evaluation tool, they can elicit lessons learned and recommendations for performance improvement. The idea is for the researcher to understand participants' reactions. If group members are representative of a larger population, those reactions may be expected to reflect the views of that larger population. Thus, focus groups constitute a research or evaluation method that researchers organize to collect qualitative data through interactive and directed discussions.

Brainstorming is a creativity technique in which a group of people interact to suggest ideas spontaneously in response to a prompt. Stress is typically placed on the volume and variety of ideas, including ideas that may seem outlandish or "off-the-wall". Ideas are noted down during the activity, but not assessed or critiqued until later. The absence of criticism and assessment is intended to avoid inhibiting participants in their idea production. The term was popularized by advertising executive Alex Faickney Osborn in the classic work Applied Imagination (1953).
In project management, a schedule is a listing of a project's milestones, activities, and deliverables. Usually dependencies and resources are defined for each task, then start and finish dates are estimated from the resource allocation, budget, task duration, and scheduled events. A schedule is commonly used in the project planning and project portfolio management parts of project management. Elements on a schedule may be closely related to the work breakdown structure (WBS) terminal elements, the Statement of work, or a Contract Data Requirements List.
Scenario planning, scenario thinking, scenario analysis, scenario prediction and the scenario method all describe a strategic planning method that some organizations use to make flexible long-term plans. It is in large part an adaptation and generalization of classic methods used by military intelligence.
Ideation is the creative process of generating, developing, and communicating new ideas, where an idea is understood as a basic element of thought that can be either visual, concrete, or abstract. Ideation comprises all stages of a thought cycle, from innovation, to development, to actualization. Ideation can be conducted by individuals, organizations, or crowds. As such, it is an essential part of the design process, both in education and practice.
A concept map or conceptual diagram is a diagram that depicts suggested relationships between concepts. Concept maps may be used by instructional designers, engineers, technical writers, and others to organize and structure knowledge.
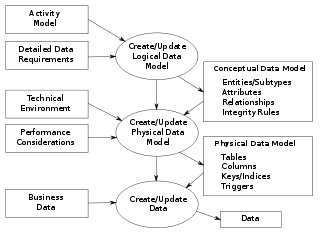
Data modeling in software engineering is the process of creating a data model for an information system by applying certain formal techniques. It may be applied as part of broader Model-driven engineering (MDE) concept.
Creativity techniques are methods that encourage creative actions, whether in the arts or sciences. They focus on a variety of aspects of creativity, including techniques for idea generation and divergent thinking, methods of re-framing problems, changes in the affective environment and so on. They can be used as part of problem solving, artistic expression, or therapy.

Group concept mapping is a structured methodology for organizing the ideas of a group on any topic of interest and representing those ideas visually in a series of interrelated maps. It is a type of integrative mixed method, combining qualitative and quantitative approaches to data collection and analysis. Group concept mapping allows for a collaborative group process with groups of any size, including a broad and diverse array of participants. Since its development in the late 1980s by William M.K. Trochim at Cornell University, it has been applied to various fields and contexts, including community and public health, social work, health care, human services, and biomedical research and evaluation.
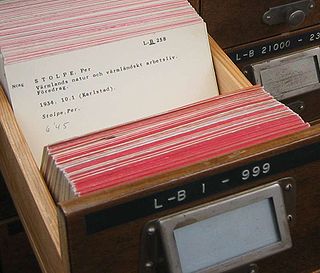
An index card consists of card stock cut to a standard size, used for recording and storing small amounts of discrete data. A collection of such cards either serves as, or aids the creation of, an index for expedited lookup of information. This system is said to have been invented by Carl Linnaeus, around 1760.
The seven management and planning tools have their roots in operations research work done after World War II and the Japanese total quality control (TQC) research.
Card sorting is a technique in user experience design in which a person tests a group of subject experts or users to generate a dendrogram or folksonomy. It is a useful approach for designing information architecture, workflows, menu structure, or web site navigation paths.
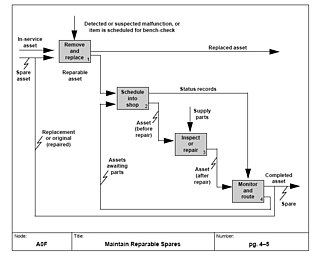
In systems engineering, software engineering, and computer science, a function model or functional model is a structured representation of the functions within the modeled system or subject area.
The following outline is provided as an overview of and topical guide to project management:
Idea networking is a qualitative method of doing a cluster analysis of any collection of statements, developed by Mike Metcalfe at the University of South Australia. Networking lists of statements acts to reduce them into a handful of clusters or categories. The statements might be source from interviews, text, websites, focus groups, SWOT analysis or community consultation. Idea networking is inductive as it does not assume any prior classification system to cluster the statements. Rather keywords or issues in the statements are individually linked (paired). These links can then be entered into network software to be displayed as a network with clusters. When named, these clusters provide emergent categories, meta themes, frames or concepts which represent, structure or sense-make the collection of statements.
Jiro Kawakita was an ethnographer, a pioneer in participation of remote Nepalese villagers in researching their problems, resulting in practical benefits of portable water supplies and rapid rope-way transport across mountain gorges. He was awarded the Ramon Magsaysay Award in 1984.
In computer supported brainstorming, team members contribute their ideas through electronic means either synchronously or asynchronously. The brainstorming software selected by the team mediates the individual interactions and helps to organize and shape the products of the brainstorming session. Computer supported brainstorming can be implemented using a wide variety of electronic technologies.
Harbarian process modeling (HPM) is a method for obtaining internal process information from an organization and then documenting that information in a visually effective, simple manner.
