Air pollution in India

Last updated

Dust & Construction contribute about 59% to the air pollution in India, which is followed by Waste Burning. Crafting activities are mostly in the urban areas while Waste Burning is in the rural areas (agriculture). Sources of Air Pollution.png
Dust & Construction contribute about 59% to the air pollution in India, which is followed by Waste Burning. Crafting activities are mostly in the urban areas while Waste Burning is in the rural areas (agriculture).

Air pollution in India is a serious environmental issue. [1] Of the 30 most polluted cities in the world, 21 were in India in 2019. [2] [3] As per a study based on 2016 data, at least 140 million people in India breathe air that is 10 times or more over the WHO safe limit [4] and 13 of the world's 20 cities with the highest annual levels of air pollution are in India. [5] 51% of the pollution is caused by industrial pollution, 27% by vehicles, 17% by crop burning and 5% by other sources. [6] Air pollution contributes to the premature deaths of 2 million Indians every year. Emissions come from vehicles and industry, whereas in rural areas, much of the pollution stems from biomass burning for cooking and keeping warm. In autumn and spring months, large scale crop residue burning in agriculture fields – a cheaper alternative to mechanical tilling – is a major source of smoke, smog and particulate pollution. [7] [8] [9] India has a low per capita emissions of greenhouse gases but the country as a whole is the third largest greenhouse gas producer after China and the United States. [10] A 2013 study on non-smokers has found that Indians have 30% weaker lung function than Europeans. [11]

Contents

The Air (Prevention and Control of Pollution) Act was passed in 1981 to regulate air pollution but has failed to reduce pollution because of poor enforcement of the rules. [12]

In 2015, Government of India, together with IIT Kanpur launched the National Air Quality Index. [13] In 2019, India launched 'The National Clean Air Programme' with tentative national target of 20%-30% reduction in PM2.5 and PM10 concentrations by 2024, considering 2017 as the base year for comparison. It will be rolled out in 102 cities that are considered to have air quality worse than the National Ambient Air Quality Standards. [14] There are other initiatives such as a 1,600-kilometre-long and 5-kilometre-wide The Great Green Wall of Aravalli green ecological corridor along Aravalli range from Gujarat to Delhi which will also connect to Shivalik hill range with planting of 1.35 billion (135 crore) new native trees over 10 years to combat the pollution. [6] In December 2019, IIT Bombay, in partnership with the McKelvey School of Engineering of Washington University in St. Louis, launched the Aerosol and Air Quality Research Facility to study air pollution in India. [15] According to a Lancet study, nearly 1.67 million deaths and an estimated loss of US$28.8 billion worth of output were India's prices for worsening air pollution in 2019. [16]

Causes

Cooking fuel in rural India is prepared from a wet mix of dried grass, fuelwood pieces, hay, leaves and mostly livestock dung. When it burns, it produces smoke and numerous indoor air pollutants at concentrations 5 times higher than coal Drying cow dung.jpg
Cooking fuel in rural India is prepared from a wet mix of dried grass, fuelwood pieces, hay, leaves and mostly livestock dung. When it burns, it produces smoke and numerous indoor air pollutants at concentrations 5 times higher than coal

Fuel and biomass burning

A rural aburo stove using biomass cakes, fuelwood and trash as cooking fuel. Surveys suggest over 100 million households in India use such stoves (cuulhaa) every day, 2-3 times a day. Clean burning fuels and electricity are unavailable in rural parts and small towns of India because of poor rural highways and energy infrastructure. The rural stove,smoky,pollution,TamilNadu-230.jpeg
A rural aburo stove using biomass cakes, fuelwood and trash as cooking fuel. Surveys suggest over 100 million households in India use such stoves (चूल्हा) every day, 2–3 times a day. Clean burning fuels and electricity are unavailable in rural parts and small towns of India because of poor rural highways and energy infrastructure.
Burning of rice residues after harvest, to quickly prepare the land for wheat planting, around Sangrur, Punjab, India NP India burning 48 (6315309342).jpg
Burning of rice residues after harvest, to quickly prepare the land for wheat planting, around Sangrur, Punjab, India

Fuel wood and biomass burning is the primary reason for near-permanent haze and smoke observed above rural and urban India, and in satellite pictures of the country. Fuelwood and biomass cakes are used for cooking and general heating needs. These are burnt in cook stoves known as chulha (also chullha or chullah) in some parts of India. These cook stoves are present in over 100 million Indian households, and are used two to three times a day, daily. Some reports, including one by the World Health Organization, claim 300,000 to 400,000 people die of indoor air pollution and carbon monoxide poisoning in India because of biomass burning and use of chullhas. [19] The carbon containing gases released from biomass fuels are many times more reactive than cleaner fuels such as liquefied petroleum gas. [20] Air pollution is also the main cause of the Asian brown cloud, which is delaying the start of the monsoon. The Burning of biomass and firewood will not stop until electricity or clean burning fuel and combustion technologies become reliably available and widely adopted in rural and urban India.

India is the world's largest consumer of fuelwood, agricultural waste and biomass for energy purposes. From the most recent available nationwide study, India used 148.7 million tonnes coal replacement worth of fuel-wood and biomass annually for domestic energy use. India's national average annual per capita consumption of fuel wood, agricultural waste and biomass cakes was 206 kilogram coal equivalent. [21] The overall contribution of fuelwood, including sawdust and wood waste, was about 46% of the total, the rest being agricultural waste and biomass dung cakes. Traditional fuel (fuelwood, crop residue and dung cake) dominates domestic energy use in rural India and accounts for about 90% of the total. In urban areas, this traditional fuel constitutes about 24% of the total. [21] India burns tenfold more fuelwood every year than the United States; the fuelwood quality in India is different from the dry firewood of the United States; and, the Indian stoves in use are less efficient, thereby producing more smoke and air pollutants per kilogram equivalent.

The unsanctioned tyre pyrolysis plants, which recycle rubber tyres into low-grade oil and carbon black are widespread in India and contribute to severe air pollution and health problems. [22]

Fuel adulteration

Some Indian taxis and auto-rickshaws run on adulterated fuel blends. Adulteration of gasoline and diesel with lower-priced fuels is common in South Asia, including India. [23] Some adulterants increase emissions of harmful pollutants from vehicles, worsening urban air pollution. Financial incentives arising from differential taxes are generally the primary cause of fuel adulteration. In India and other developing countries, gasoline carries a much higher tax than diesel, which in turn is taxed more than kerosene meant as a cooking fuel, while some solvents and lubricants carry little or no tax.

As fuel prices rise, the public transport driver cuts costs by blending the cheaper hydrocarbon into highly taxed hydrocarbon. The blending may be as much as 20–30 percent. For a low wage driver, the adulteration can yield short term savings that are significant over the month. The consequences to long term air pollution, quality of life and effect on health are simply ignored. Also ignored are the reduced life of vehicle engine and higher maintenance costs, particularly if the taxi, auto-rickshaw or truck is being rented for a daily fee.

Adulterated fuel increases tailpipe emissions of hydrocarbons (HC), carbon monoxide (CO), oxides of nitrogen (NOx) and particulate matter (PM). Air toxin emissions — which fall into the category of unregulated emissions — of primary concern are benzene and polyaromatic hydrocarbons (PAHs), both well-known carcinogens. Kerosene is more difficult to burn than gasoline, its addition results in higher levels of HC, CO and PM emissions even from catalyst-equipped cars. The higher sulfur level of kerosene is another issue.

Traffic congestion

Traffic congestion is severe in India's cities and towns. [24] Traffic congestion is caused by several reasons, some of which are: increase in number of vehicles per kilometre of available roads, a lack of intra-city divided-lane highways and intra-city expressways networks, lack of inter-city expressways, traffic accidents and chaos due to poor enforcement of traffic laws.

Traffic congestion reduces the average traffic speed. At low speeds, scientific studies reveal that vehicles burn fuel inefficiently and pollute more per trip. For example, a study in the United States found that for the same trip, cars consumed more fuel and polluted more if the traffic was congested, than when traffic flowed freely. An average trip speeds between 20 and 40 kilometres per hour, the cars pollutant emission was twice as much as when the average speed was 55 to 75 kilometres per hour. At average trip speeds between 5 and 20 kilometres per hour, the cars pollutant emissions were 4 to 8 times as much as when the average speed was 55 to 70 kilometres per hour. [25] Fuel efficiencies similarly were much worse with traffic congestion.

Traffic gridlock in Delhi and other Indian cities is extreme. [26] This has been shown to result in a build up of local pollution, particularly under stagnant conditions. [27] The average trip speed on many Indian city roads is less than 20 kilometres per hour; a 10-kilometre trip can take 30 minutes, or more. At such speeds, vehicles in India emit air pollutants 4 to 8 times more than they would with less traffic congestion; Indian vehicles also consume a lot more carbon footprint fuel per trip, than they would if the traffic congestion was less. Emissions of particles and heavy metals increase over time because the growth of the fleet and mileage outpaces the efforts to curb emissions. [28]

In cities like Bangalore, around 50% of children suffer from asthma. [29]

Greenhouse gas emissions

Satpura coal-fired power station Satpura thermal power plant.jpg
Satpura coal-fired power station

India is ranked fourth among the list of countries most affected by climate change in 2015. [30] India emits about 3 gigatonnes (Gt) CO2eq of greenhouse gases each year; about two and a half tons per person, which is less than the world average. [31] The country emits 7% of global emissions, despite having 17% of the world population. [32] Temperature rises on the Tibetan Plateau are causing Himalayan glaciers to retreat, threatening the flow rate of the Ganges, Brahmaputra, Yamuna and other major rivers. A 2007 World Wide Fund for Nature (WWF) report states that the Indus River may run dry for the same reason. [33] Heat waves' frequency and intensity are increasing in India because of climate change. Severe landslides and floods are projected to become increasingly common in such states as Assam. [34] The climate change performance index of India ranks eighth among 63 countries which account for 92% of all GHG emissions in the year 2021. [35]

Temperatures in India have risen by 1.94 °C (3.5 °F) between 1901 and 2018. [36]

According to some current projections, the number and severity of droughts in India will have markedly increased by the end of the present century. [37]

Effects

Health costs of air pollution

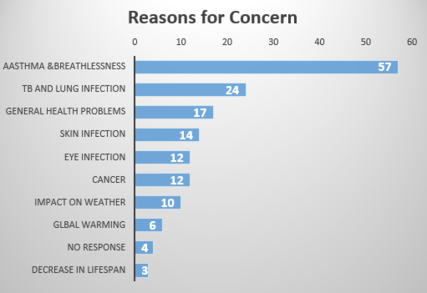
Asthma is the leading health problem faced by Indians. Not surprisingly, it accounts for more than 50% of the health problems caused by air pollution. Reasons for Concern.png
Asthma is the leading health problem faced by Indians. Not surprisingly, it accounts for more than 50% of the health problems caused by air pollution.

The most important reason for concern over the worsening air pollution in the country is its effect on the health of individuals. Exposure to particulate matter for a long time can lead to respiratory and cardiovascular diseases such as asthma, bronchitis, COPD, lung cancer and heart attack. [38] The Global Burden of Disease Study for 2010, published in 2013, had found that outdoor air pollution was the fifth-largest killer in India and around 620,000 early deaths occurred from air pollution-related diseases in 2010. [39] According to a WHO study, 13 of the 20 most-polluted cities in the world are in India; however, the accuracy and methodology of the WHO study was questioned by the Government of India. [39] India also has one of the highest number of COPD patients and the highest number of deaths due to COPD.

Over a million Indians die prematurely every year due to air pollution, according to the non-profit Health Effects Institute. [40] Over two million children—half the children in Delhi—have abnormalities in their lung function, according to the Delhi Heart and Lung Institute. [40] Over the past decade air pollution has increased in India significantly. Asthma is the most common health problem faced by Indians and it accounts for more than half of the health issues caused by air pollution. [41] [42] Air pollution is believed to be one of the key factors in accelerating the onset of Alzheimer's disease in India. [43]

The Global Burden of Disease Study of 2017 analysed in a report by The Lancet indicated that 76.8% of Indians are exposed to higher ambient particulate matter over 40 μg/m3, which is significantly above the national limit recommenced by national guidelines on ambient air pollution. The study estimated that of 480.7 million Disability-Adjusted Life Years in India 4.4% of could be ascribed to ambient particulate matter pollution and 15.8 million of them were the result of polluted air in households. In terms of average life expectancy it is suggested that average life expectancy in India would increase by 1.7 years if exposure was limited to national minimum recommendations. [44]

Ambient air pollution in India is estimated to cause 670,000 deaths annually and particularly aggravates respiratory and cardiovascular conditions including chronic bronchitis, lung cancer and asthma. Ambient air pollution is linked to an increase in hospital visits, with a higher concentration of outdoor pollution particulates resulting in emergency room visit increases of between 20 and 25% for a range of conditions associated with higher exposure to air pollution. Approximately 76% of households in rural India are reliant on solid biomass for cooking purposes which contributes further to the disease burden of ambient air pollution experienced by the population of India. [45]

According to the WHO, India has 14 out of the 15 most polluted cities in the world in terms of PM 2.5 concentrations. Other Indian cities that registered very high levels of PM2.5 pollutants are Delhi, Patna, Agra, Muzaffarpur, Srinagar, Gurgaon, Jaipur, Patiala and Jodhpur, followed by Ali Subah Al-Salem in Kuwait and a few cities in China and Mongolia. [46]

Air Quality Index (AQI) is a number used to communicate the level of pollution in the air and it essentially tells you the level of pollution in the air in a given city on a given day. The AQI of Delhi was placed under the "severe-plus category" when it touched 574, by the System of Air Quality and Weather Forecasting And Research. [47] In May 2014 the World Health Organization announced New Delhi as the most polluted city in the world. [48] In November 2016, the Great smog of Delhi was an environmental event which saw New Delhi and adjoining areas in a dense blanket of smog, which was the worst in 17 years.

2018 Air Pollution in New Delhi (PM2.5 AQI). A surge on June 14 was caused by dust storms brought on by a combination of extreme heat and powerful downdraft winds.
@media(min-width:720px){.mw-parser-output .columns-start .column{float:left;min-width:20em}.mw-parser-output .columns-2 .column{width:50%}.mw-parser-output .columns-3 .column{width:33.3%}.mw-parser-output .columns-4 .column{width:25%}.mw-parser-output .columns-5 .column{width:20%}}
.mw-parser-output .legend{page-break-inside:avoid;break-inside:avoid-column}.mw-parser-output .legend-color{display:inline-block;min-width:1.25em;height:1.25em;line-height:1.25;margin:1px 0;text-align:center;border:1px solid black;background-color:transparent;color:black}.mw-parser-output .legend-text{}
Hazardous
Very Unhealthy
Unhealthy
Unhealthy for Sensitive Groups
Moderate
Good 2018 Air Pollution in NewDelhi (PM2.5 AQI).svg
2018 Air Pollution in New Delhi (PM2.5 AQI). A surge on June 14 was caused by dust storms brought on by a combination of extreme heat and powerful downdraft winds.
   Hazardous
   Very Unhealthy
   Unhealthy
   Unhealthy for Sensitive Groups
   Moderate
  Good
Top 13 Cities in India with the highest level of PM 2.5
CitiesPM2.5 Levels
Delhi153
Patna149
Gwalior144
Raipur134
Ahmedabad100
Lucknow96
Firozabad96
Kanpur93
Amritsar92
Ludhiana91
Prayagraj88
Agra88
Khanna88

India's Central Pollution Control Board now routinely monitors four air pollutants namely sulphur dioxide (SO2), oxides of nitrogen (NOx), suspended particulate matter (SPM) and respirable particulate matter (PM10). These are target air pollutants for regular monitoring at 308 operating stations in 115 cities/towns in 25 states and 4 Union Territories of India. The monitoring of meteorological parameters such as wind speed and direction, relative humidity and temperature has also been integrated with the monitoring of air quality. The monitoring of these pollutants is carried out for 24 hours (4-hourly sampling for gaseous pollutants and 8-hourly sampling for particulate matter) with a frequency of twice a week, to yield 104 observations in a year.

The key findings of India's central pollution control board are: [50]

Steps taken

See also

Related Research Articles

<span class="mw-page-title-main">Smog</span> Smoke-like, fog-like air pollutions

Smog, or smoke fog, is a type of intense air pollution. The word "smog" was coined in the early 20th century, and is a portmanteau of the words smoke and fog to refer to smoky fog due to its opacity, and odor. The word was then intended to refer to what was sometimes known as pea soup fog, a familiar and serious problem in London from the 19th century to the mid-20th century, where it was commonly known as a London particular or London fog. This kind of visible air pollution is composed of nitrogen oxides, sulfur oxide, ozone, smoke and other particulates. Man-made smog is derived from coal combustion emissions, vehicular emissions, industrial emissions, forest and agricultural fires and photochemical reactions of these emissions.
<span class="mw-page-title-main">Exhaust gas</span> Gases emitted as a result of fuel reactions in combustion engines

Exhaust gas or flue gas is emitted as a result of the combustion of fuels such as natural gas, gasoline (petrol), diesel fuel, fuel oil, biodiesel blends, or coal. According to the type of engine, it is discharged into the atmosphere through an exhaust pipe, flue gas stack, or propelling nozzle. It often disperses downwind in a pattern called an exhaust plume.
<span class="mw-page-title-main">Diesel exhaust</span> Gaseous exhaust produced by a diesel engine

Diesel exhaust is the gaseous exhaust produced by a diesel type of internal combustion engine, plus any contained particulates. Its composition may vary with the fuel type or rate of consumption, or speed of engine operation, and whether the engine is in an on-road vehicle, farm vehicle, locomotive, marine vessel, or stationary generator or other application.

<span class="mw-page-title-main">Air quality index</span> Measure of air pollution

An air quality index (AQI) is an indicator developed by government agencies to communicate to the public how polluted the air currently is or how polluted it is forecast to become. As air pollution levels rise, so does the AQI, along with the associated public health risk. Children, the elderly and individuals with respiratory or cardiovascular problems are typically the first groups affected by poor air quality. When the AQI is high, governmental bodies generally encourage people to reduce physical activity outdoors, or even avoid going out altogether. When wildfires result in a high AQI, the use of a mask outdoors and an air purifier indoors are also encouraged.

<span class="mw-page-title-main">Air pollution</span> Presence of dangerous substances in the atmosphere

Air pollution is the contamination of air due to the presence of substances called pollutants in the atmosphere that are harmful to the health of humans and other living beings, or cause damage to the climate or to materials. It is also the contamination of the indoor or outdoor environment either by chemical, physical, or biological agents that alters the natural features of the atmosphere. There are many different types of air pollutants, such as gases, particulates, and biological molecules. Air pollution can cause diseases, allergies, and even death to humans; it can also cause harm to other living organisms such as animals and crops, and may damage the natural environment or built environment. Air pollution can be caused by both human activities and natural phenomena.

<span class="mw-page-title-main">Environmental issues in India</span> Overview of the environmental issues in India

There are multiple environmental issues in India. Air pollution, water pollution, garbage, domestically prohibited goods and pollution of the natural environment are all challenges for India. Nature is also causing some drastic effects on India. The situation was worse between 1947 through 1995. According to data collected and environmental assessments studied by World Bank experts, between 1995 through 2010, India has made some of the fastest progress in addressing its environmental issues and improving its environmental quality in the world. However, pollution still remains a major challenge and opportunity for the country.

<span class="mw-page-title-main">Road space rationing</span> Travel demand management strategy

Road space rationing, also known as alternate-day travel, driving restriction and no-drive days, is a travel demand management strategy aimed to reduce the negative externalities generated by urban air pollution or peak urban travel demand in excess of available supply or road capacity, through artificially restricting demand by rationing the scarce common good road capacity, especially during the peak periods or during peak pollution events. This objective is achieved by restricting traffic access into an urban cordon area, city center (CBD), or district based upon the last digits of the license number on pre-established days and during certain periods, usually, the peak hours.

Air pollution is the introduction of chemicals, particulate matter, or biological materials into the atmosphere, causing harm or discomfort to humans or other living organisms, or damaging ecosystems. Air pollution can cause health problems including, but not limited to, infections, behavioral changes, cancer, organ failure, and premature death. These health effects are not equally distributed across the U.S. population; there are demographic disparities by race, ethnicity, socioeconomic status, and education. Air pollution can derive from natural sources, or anthropogenic sources. Anthropogenic air pollution has affected the United States since the beginning of the Industrial Revolution.

<span class="mw-page-title-main">Pollution in California</span> Overview of pollution in the U.S. state of California

Pollution in California relates to the degree of pollution in the air, water, and land of the U.S. state of California. Pollution is defined as the addition of any substance or any form of energy to the environment at a faster rate than it can be dispersed, diluted, decomposed, recycled, or stored in some harmless form. The combination of three main factors is the cause of notable unhealthy levels of air pollution in California: the activities of over 39 million people, a mountainous terrain that traps pollution, and a warm climate that helps form ozone and other pollutants. Eight of the ten cities in the US with the highest year-round concentration of particulate matter between 2013 and 2015 were in California, and seven out of the ten cities in the US with the worst ozone pollution were also in California. Studies show that pollutants prevalent in California are linked to several health issues, including asthma, lung cancer, birth complications, and premature death. In 2016, Bakersfield, California recorded the highest level of airborne pollutants of any city in the United States.

The Ecopass program was a traffic pollution charge implemented in Milan, Italy, as an urban toll for some motorists traveling within a designated traffic restricted zone or ZTL, corresponding to the central Cerchia dei Bastioni area and encircling around 8.2 km2 (3.2 sq mi). The Ecopass was implemented as a one-year trial program on 2 January 2008, and later extended until 31 December 2009. A public consultation was planned to be conducted early in 2009 to decide if the charge becomes permanent. Subsequently, the charge-scheme was prolonged until 31 December 2011. Starting from 16 January 2012, a new scheme was introduced, converting it from a pollution-charge to a conventional congestion charge.

Bharat stage emission standards (BSES) are emission standards instituted by the Government of India to regulate the output of air pollutants from compression ignition engines and Spark-ignition engines equipment, including motor vehicles. The standards and the timeline for implementation are set by the Central Pollution Control Board under the Ministry of Environment, Forest and Climate Change.

<span class="mw-page-title-main">Air quality law</span> Type of law

Air quality laws govern the emission of air pollutants into the atmosphere. A specialized subset of air quality laws regulate the quality of air inside buildings. Air quality laws are often designed specifically to protect human health by limiting or eliminating airborne pollutant concentrations. Other initiatives are designed to address broader ecological problems, such as limitations on chemicals that affect the ozone layer, and emissions trading programs to address acid rain or climate change. Regulatory efforts include identifying and categorising air pollutants, setting limits on acceptable emissions levels, and dictating necessary or appropriate mitigation technologies.

<span class="mw-page-title-main">Air pollution in Mexico City</span> Poor quality of air in the capital and largest city of Mexico

Air Pollution in Mexico City has been of concern to the city's population and health officials for decades. In the 20th century, Mexico City's population rapidly increased as industrialization brought thousands of migrants from all over the world. Such a rapid and unexpected growth led to the UN declaring Mexico City as the most polluted city in the world in 1992. This was partly due to Mexico City's high altitude, which causes its oxygen levels to be 25% lower. Carbon-based fuels also do not combust completely. Other factors include the proliferation of vehicles, rapid industrial growth, and the population boom. The Mexican government has several active plans to reduce emission levels which require citizen participation, vehicular restrictions, increase of green areas, and expanded bicycle accessibility.

Environmental problems in Delhi, India, are a threat to the well-being of the city's and area's inhabitants as well as the flora and fauna. Delhi, the ninth-most populated metropolis in the world (second largest if the entire NCR includes especially Faridabad and Gurugram– Haryana, is one of the most heavily polluted cities in India, having for instance one of the country's highest volumes of particulate matter pollution. The air quality index of Delhi is generally Good, Satisfactory and Moderate levels between March and September, and then it drastically deteriorates to Poor, Severe, or Hazardous levels in five months between October and February, due to various factors including stubble burning, burning of effigies during Vijayadashami, bursting of firecrackers burning during Diwali and cold weather. In May 2014 the World Health Organization announced New Delhi as the most polluted city in the world.
<span class="mw-page-title-main">Air pollution in Canada</span> Overview of the air pollution in Canada

Air pollution is the release of pollutants into the air that are detrimental to human health and the Earth. In Canada, air pollution is regulated by standards set by the Canadian Council of Ministers of the Environment (CCME), an inter-governmental body of federal, provincial and territorial Ministers responsible for the environment. Air pollution from the United States and to lesser extent Canada; caused by metal smelting, coal-burning for utilities, and vehicle emissions has resulted in acid rain, has severely impacted Canadian waterways, forest growth, and agricultural productivity.

<span class="mw-page-title-main">Particulates</span> Microscopic solid or liquid matter suspended in the Earths atmosphere

Particulates or atmospheric particulate matter are microscopic particles of solid or liquid matter suspended in the air. The term aerosol commonly refers to the particulate/air mixture, as opposed to the particulate matter alone. Sources of particulate matter can be natural or anthropogenic. They have impacts on climate and precipitation that adversely affect human health, in ways additional to direct inhalation.

<span class="mw-page-title-main">Stubble burning</span> Agricultural practice

Stubble burning is the practice of intentionally setting fire to the straw stubble that remains after grains, such as rice and wheat, have been harvested. The technique is still widespread today. Stubble burning is a common practice in India that has been increasing greenhouse gases over the past few decades fueling climate change due to the particulate matter contamination it distributes into the atmosphere.

The health of a mother directly affects the fetus during pregnancy. High levels of vehicle pollution where pregnant women reside can have adverse health effects on fetuses.

<span class="mw-page-title-main">Air pollution in Delhi</span> Overview of the air pollution in the Indian city of Delhi

The air quality in Delhi, the capital territory of India, according to a WHO survey of 1,650 world cities, and a survey of 7,000 world cities by the US-based Health Effects Institute in August 2022, is the worst of any major city in the world. It also affects the districts around Delhi. Air pollution in India is estimated to kill about 2 million people every year; it is the fifth largest killer in India. India has the world's highest death rate from chronic respiratory diseases and asthma, according to the WHO. In Delhi, poor quality air irreversibly damages the lungs of 2.2 million or 50 percent of all children.

Particulate pollution is pollution of an environment that consists of particles suspended in some medium. There are three primary forms: atmospheric particulate matter, marine debris, and space debris. Some particles are released directly from a specific source, while others form in chemical reactions in the atmosphere. Particulate pollution can be derived from either natural sources or anthropogenic processes.

References

  1. "State of global air 2019". Archived from the original on 14 May 2019. Retrieved 29 April 2019.
  2. Regan, Helen. "21 of the world's 30 cities with the worst air pollution are in India". CNN. Archived from the original on 2020-02-25. Retrieved 2020-02-26.
  3. Lowry, LeeAnne. "21 Of Top 30 Air Polluted Cities Last Year Were In India". Newsy. Archived from the original on 2020-02-26. Retrieved 2020-02-26.
  4. Bernard, Steven; Kazmin, Amy (December 11, 2018). "Dirty air: how India became the most polluted country on earth". ig.ft.com. Archived from the original on 2019-09-30. Retrieved 2019-03-04.
  5. "India's air pollution, health burden get NIEHS attention (Environmental Factor, September 2018)". National Institute of Environmental Health Sciences. Archived from the original on 2019-03-06. Retrieved 2019-03-04.
  6. 1 2 Want govt to build 1600 km green wall along Aravalli Archived 2019-12-24 at the Wayback Machine , Indian Express, 24 December 2019.
  7. Badarinath, K.V.S; Kharol, Shailesh Kumar & Sharma, Anu Rani (2009). "Long-range transport of aerosols from agriculture crop residue burning in Indo-Gangetic Plains—a study using LIDAR, ground measurements and satellite data". Journal of Atmospheric and Solar-Terrestrial Physics. 71 (1): 112–120. doi:10.1016/j.jastp.2008.09.035 . Retrieved October 14, 2023.
  8. Agricultural Fires in India Archived 2017-01-18 at the Wayback Machine NASA, United States (2012)
  9. Bob Weinhold , Fields and Forests in Flames: Vegetation Smoke damages and Human Health Archived 2017-06-29 at the Wayback Machine , National Institutes of Health
  10. "CO2 EMISSIONS FROM FUEL COMBUSTION HIGHLIGHTS, 2011 Edition" (PDF). International Energy Agency, France. 2011. Archived (PDF) from the original on 2012-02-02. Retrieved 2012-09-05.
  11. "Indians have 30% weaker lungs than Europeans". Times of India. Sep 2, 2013. Archived from the original on July 24, 2019. Retrieved September 2, 2013.
  12. "Air pollution law languishes toothless when air pollution surges". Mongabay-India. 2020-11-10. Archived from the original on 2021-02-02. Retrieved 2021-01-26.
  13. Mohan, Vishwa (2015-04-07). "Choking India gets air quality index". The Economic Times. Archived from the original on 2019-03-02. Retrieved 2019-11-09.
  14. "National Clean Air Programme". 2019. Archived from the original on 20 December 2019. Retrieved 18 January 2019.
  15. "McKelvey Engineering, IIT Bombay partner to study air pollution | The Source | Washington University in St. Louis". The Source. 2019-12-04. Archived from the original on 2020-05-10. Retrieved 2020-02-14.
  16. Aggarwal, Piyush (September 29, 2021). "Will an extended ban on firecrackers help improve the air we breathe?". India Today. Archived from the original on 2021-10-19. Retrieved 2021-10-13.
  17. Stewart, Gareth J.; Acton, W. Joe F.; Nelson, Beth S.; Vaughan, Adam R.; Hopkins, James R.; Arya, Rahul; Mondal, Arnab; Jangirh, Ritu; Ahlawat, Sakshi; Yadav, Lokesh; Sharma, Sudhir K. (2021-02-18). "Emissions of non-methane volatile organic compounds from combustion of domestic fuels in Delhi, India". Atmospheric Chemistry and Physics. 21 (4): 2383–2406. Bibcode:2021ACP....21.2383S. doi: 10.5194/acp-21-2383-2021 . ISSN   1680-7316. Archived from the original on 2023-04-05. Retrieved 2021-03-02.
  18. Stewart, Gareth J.; Nelson, Beth S.; Acton, W. Joe F.; Vaughan, Adam R.; Farren, Naomi J.; Hopkins, James R.; Ward, Martyn W.; Swift, Stefan J.; Arya, Rahul; Mondal, Arnab; Jangirh, Ritu (2021-02-18). "Emissions of intermediate-volatility and semi-volatile organic compounds from domestic fuels used in Delhi, India". Atmospheric Chemistry and Physics. 21 (4): 2407–2426. Bibcode:2021ACP....21.2407S. doi: 10.5194/acp-21-2407-2021 . ISSN   1680-7316. Archived from the original on 2023-02-27. Retrieved 2021-03-02.
  19. "Green stoves to replace chullahs". The Times of India . December 3, 2009. Archived from the original on July 1, 2012.
  20. Stewart, Gareth J.; Nelson, Beth S.; Acton, W. Joe F.; Vaughan, Adam R.; Hopkins, James R.; Yunus, Siti S. M.; Hewitt, C. Nicholas; Nemitz, Eiko; Mandal, Tuhin K.; Gadi, Ranu; Sahu, Lokesh K. (2021-02-25). "Comprehensive organic emission profiles, secondary organic aerosol production potential, and OH reactivity of domestic fuel combustion in Delhi, India". Environmental Science: Atmospheres. 1 (2): 104–117. doi: 10.1039/D0EA00009D . ISSN   2634-3606.
  21. 1 2 Devendra Pandey (2002). Fuelwood Studies in India: Myth and Reality (PDF). Center for International Forestry Research. ISBN   979-8764-92-7. Archived (PDF) from the original on 2017-08-10. Retrieved 2012-09-05.
  22. "Burning tires: the murky oil business polluting parts of Asia". Reuters . May 31, 2019. Retrieved October 16, 2023.
  23. "Urban Air Pollution, Catching gasoline ad diesel adulteration" (PDF). The World Bank. 2002. Archived (PDF) from the original on 2016-03-04. Retrieved 2012-09-05.
  24. Akbar, Prottoy A.; Couture, Victor; Duranton, Gilles; Ghani, Ejaz; Storeygard, Adam (August 2018). "Mobility and Congestion in Urban India" (PDF). Macroeconomics, Trade and Investment Global Practice. World Bank Group. Archived (PDF) from the original on 2020-03-31. Retrieved 2021-03-07.
  25. Matthew Barth; Kanok Boriboonsomsin (November 2009). "Real-World CO2 Impacts of Traffic Congestion". Transportation Research Record: Journal of the Transportation Research Board. 2058: 163–171. doi:10.3141/2058-20. S2CID   2173204. Archived from the original on 2016-05-30.
  26. "Gridlocked Delhi: six years of career lost in traffic jams". India Today. September 5, 2010. Archived from the original on February 13, 2017. Retrieved September 5, 2012.
  27. Stewart, Gareth J.; Nelson, Beth S.; Drysdale, Will S.; Acton, W. Joe F.; Vaughan, Adam R.; Hopkins, James R.; Dunmore, Rachel E.; Hewitt, C. Nicholas; Nemitz, Eiko; Mullinger, Neil; Langford, Ben (2020-08-13). "Sources of non-methane hydrocarbons in surface air in Delhi, India". Faraday Discussions. 226: 409–431. doi: 10.1039/D0FD00087F . ISSN   1364-5498. PMID   33336656.
  28. Kumari, R; Attri, AK; Panis, LI; Gurjar, BR (April 2013). "Emission estimates of particulate matter and heavy metals from mobile sources in Delhi (India)". Journal of Environmental Science & Engineering. 55 (2): 127–42. PMID   25464689.
  29. "50% Bangalore kids hit by asthma". The Times of India . 6 November 2007. Archived from the original on 29 July 2012.
  30. Kreft, Sönke; Eckstein, David; Melchior, Inga (November 2016). Global Climate Risk Index 2017 (PDF). Bonn: Germanwatch e.V. ISBN   978-3-943704-49-5. Archived from the original (PDF) on 25 September 2017. Retrieved 10 July 2017.
  31. "Greenhouse Gas Emissions in India" (PDF). September 2018. Archived (PDF) from the original on 2020-02-14. Retrieved 10 June 2021.
  32. "Emissions Gap Report 2019". UN Environment Programme. 2019. Archived from the original on 2019-11-20. Retrieved 10 June 2021.
  33. "How climate change hits India's poor". BBC News. 1 Feb 2007. Retrieved 10 June 2021.
  34. "Warmer Tibet can see Brahmaputra flood Assam | India News - Times of India". The Times of India. 3 February 2007. Retrieved 2021-03-11.
  35. "Climate Change Performance Index" (PDF). November 2022. Retrieved 15 November 2022.
  36. Sharma, Vibha (15 June 2020). "Average temperature over India projected to rise by 4.4 degrees Celsius: Govt report on impact of climate change in country". Tribune India . Retrieved 30 November 2020.
  37. Gupta, Vivek; Jain, Manoj Kumar (2018). "Investigation of multi-model spatiotemporal mesoscale drought projections over India under climate change scenario". Journal of Hydrology . 567: 489–509. Bibcode:2018JHyd..567..489G. doi:10.1016/j.jhydrol.2018.10.012. ISSN   0022-1694. S2CID   135053362.
  38. "Air Pollution in India – A Brief Highlight". 2021-04-24. Archived from the original on 2021-06-13. Retrieved 2021-05-26.
  39. 1 2 Rao, Kirthi V.; Raj, Amrit; Sethi, Neha (2014-05-12). "Emission panel for pan-India shift to Bharat Stage V fuel by 2020". livemint.com. Archived from the original on 2019-08-17. Retrieved 2019-08-17.
  40. 1 2 Tammy Webber; Katy Daigle. "US exporting dirty fuel to pollution-choked India". San Jose Mercury-News. Bay Area News Group. AP. p. A4.
  41. Bhome, Arvind B. (2012-06-14). "COPD in India: Iceberg or volcano?". Journal of Thoracic Disease. 4 (3): 298–309–309. doi:10.3978/j.issn.2072-1439.2012.03.15. PMC   3378191 . PMID   22754670.
  42. "Chennai's air quality pretty bad, says respiratory physician". The Hindu. 2019-11-05. ISSN   0971-751X. Archived from the original on 2019-12-27. Retrieved 2019-11-09.
  43. Taniya Dutta (2023-09-21). "Indian experts urge government to curb air pollution linked to Alzheimer's disease". The National.
  44. Balakrishnan, K (January 1, 2019). "The impact of air pollution on deaths, disease burden, and life expectancy across the states of India: the Global Burden of Disease Study 2017". The Lancet Planetary Health. 1 (3): e26–e39. doi: 10.1016/S2542-5196(18)30261-4 . PMC   6358127 . PMID   30528905.
  45. Rajak, Rahul (May 9, 2019). "Short and long-term exposure to ambient air pollution and impact on health in India: a systematic review7". International Journal of Environmental Health Research. 1 (25): 593–617. doi:10.1080/09603123.2019.1612042. PMID   31070475. S2CID   148570538.
  46. "India tops world in bad air quality: Kanpur, Delhi among 15 worst cities, Mumbai 4th most polluted megacity - Times of India". The Times of India. Archived from the original on 2019-05-22. Retrieved 2019-03-09.
  47. "Delhi records worst air quality of year after rampantly bursting crackers". India Today. Ist. Archived from the original on 2019-01-06. Retrieved 2019-03-13.
  48. Madhok, Madhok (16 October 2014). "Here is why India has no clue how bad its air pollution problem is". Quartz India. Archived from the original on 8 December 2015. Retrieved December 4, 2015.
  49. "New Delhi's Air Pollution Went Off the Scale This Week". 15 June 2018. Archived from the original on 21 April 2019. Retrieved 14 March 2019.
  50. "NATIONAL AIR QUALITY MONITORING PROGRAMME". Ministry of Environment & Forests, Government of India. 2011. Archived from the original on 2008-01-11. Retrieved 2012-09-05.
  51. "Odd-Even Rule: 5 Things You Need to Know - NDTV CarAndBike". CarAndBike. Archived from the original on 2020-08-06. Retrieved 2019-03-13.
  52. "WHO | India takes steps to curb air pollution". Bulletin of the World Health Organization. 94 (7): 487–8. 2016. doi: 10.2471/BLT.16.020716 . PMC   4933146 . PMID   27429486.
  53. "Searching for solutions to Delhi's air pollution problem". Chemical & Engineering News. Archived from the original on 2019-07-13. Retrieved 2019-03-09.
  54. "India drives global rise in CO2 emissions: Report". The Indian Express. 2018-12-06. Archived from the original on 2018-12-06. Retrieved 2019-03-13.
  55. Agarwal, Dhruv; Iyengar, Srinivasan; Swaminathan, Manohar; Sharma, Eash; Raj, Ashish; Hatwar, Aadithya (2020). Modulo: Drive-by Sensing at City-scale on the Cheap . COMPASS '20. Ecuador: Association for Computing Machinery. pp. 187–197. doi:10.1145/3378393.3402275. ISBN   9781450371292.

Further reading