Air pollution in Mexico City

Last updated

Air Pollution in Mexico City MexCityPolution.JPG
Air Pollution in Mexico City
A NASA satellite image of smog in the Valley of Mexico in 1985 Smog boven mexico city november 1985.jpg
A NASA satellite image of smog in the Valley of Mexico in 1985

Air Pollution in Mexico City has been of concern to the city's population and health officials for decades. In the 20th century, Mexico City's population rapidly increased as industrialization brought thousands of migrants from all over the world. [1] Such a rapid and unexpected growth led to the UN declaring Mexico City as the most polluted city in the world in 1992. This was partly due to Mexico City's high altitude (7382 ft above sea level), which causes its oxygen levels to be 25% lower. Carbon-based fuels also do not combust completely. Other factors include the proliferation of vehicles, rapid industrial growth, and the population boom. The Mexican government has several active plans to reduce emission levels which require citizen participation, vehicular restrictions, increase of green areas, and expanded bicycle accessibility.

Contents

Air pollution causes about one in seventeen (5.9%) of all deaths in the country. It is the eighth largest cause of death, after factors such as diet, overweight, high blood pressure, alcohol and drugs, smoking and lack of exercise.

The air pollution of the Mexico City Metropolitan Area, contained within the Valley of Mexico, is measured by the Índice Metropolitano de la Calidad del Aire (Metropolitan Index of Air Quality).

History

Trends in population, vehicular fleet, energy consumption and ozone concentration in the Mexico City Metropolitan Area (1990-2006) Trends in population, vehicular fleet, energy consumption and ozone concentration in the Mexico City Metropolitan Area (1990-2006).gif
Trends in population, vehicular fleet, energy consumption and ozone concentration in the Mexico City Metropolitan Area (1990–2006)

In 1992, the United Nations named Mexico City "the most polluted city on the planet" and "the most dangerous city for children" six years later. From 1950 to 2015, the population in Mexico City increased from three million to twenty million. This population boom occurred mainly because of migrants that were looking for better opportunities, and as a consequence, the industrialization era began. This industrial growth was responsible for emitting over 11,000 tons of waste material into the atmosphere every day. [2] As a result, the economy boomed as did the proliferation of vehicles. In 1980, there were 124 cars and light-duty trucks per 1000 residents. By 2010, there were 267. [3] Population growth, increasing motorization and industrial activities, a constrained basin and intense solar radiation combined to cause intense air-quality problems of both primary and secondary pollutants. The automatic air-quality monitoring network, established in the late 1980s, revealed high concentrations of all criteria pollutants: lead, carbon monoxide, nitrogen dioxide, sulphur dioxide, ozone and particulate matter (PM). Ozone exceeded the air quality standards more than 90 percent of days and peaked above 300 parts per billion (about three times the standard) 40–50 days a year, among the worst in the world. [1]

In 1990, the Mexican government decided to implement some air quality management programs to reduce emissions. Some of the programs included removal of lead from gasoline and the implementation of catalytic converters in automobiles, reduction of sulphur content in diesel transportation fuel, substitution of fuel oil in industry and power plants with natural gas, reformulation of liquified petroleum gas used for heating and cooking.

In 1993, the government mandated the replacement of lead-octane additives with MTBE and PEMEX, the state-run petroleum company, replacing underground storage tanks at all of its petrol stations.

In 2012, ozone and other air pollutants ranked at about the same level as Los Angeles. [4] This improvement in air quality was achieved through the Mexican government's requirement that gasoline be reformulated, that polluting factories be closed or moved, and that drivers be prohibited from using their car one day per week. More recently there has been an expansion of public transportation. [4] Air pollution has been a major issue in Mexico City for decades.

Alongside a doubling of the vehicle fleet in Mexico City from 1992 to 2012, and the slow implementation of low-sulphur standards, the use of fuel ethers contributed greatly to an 86% decrease in CO, a 53% decrease in ozone, and a 32% decrease in particulate matter in that 20-year span.

Sources

Air pollution is defined as the presence of substances in the atmosphere that can be harmful to life when they are found in high quantities. In Mexico City's atmosphere, the pollutants are found as primary and secondary pollutants. Primary Pollutants are known as those that are emitted directly to the environment, such as Carbon Monoxide and Sulfur Dioxide. Secondary Pollutants are created in the atmosphere due to chemical reactions, such as Sulfate and Ozone.

Causes and consequences of major pollutants

Present day air pollution

In April–May 2016, ozone and suspended matter pollution in Mexico City reached levels that were detrimental to health, though the criterion to signal a pollution alert was lower in 2016 than in the 1980s. [6] The city's population continues to grow, to spread out, which lengthens automobile trips, and the number of autos in the city increases yearly. [7]

The air-quality monitor system (IMECA) is the tool used by the Mexican Authorities to measure air quality. A total of 8 system monitors, located all around Mexico City measure the levels for the 6 main pollutants that are found in the atmosphere of the city. The measured pollutants are: O3, PM10, PM2.5, CO, NO2, SO2. In addition, the stations have a meteorological tower, equipped with sensors that measure the ambient temperature, wind speed and direction, precipitation, solar radiation, relative humidity and barometric pressure.

Indicators for each pollutant allow to assess the state of air quality, with respect to specific pollution events. Indicators of the maximum hourly concentrations and daily mobile averages were used to evaluate the behavior of the concentrations presented by the criteria pollutants and their reference to health protection standards. IMECA is the index used to display the level of pollution and the level of risk that represents to the human health in the greater Mexico City as well as the time of the measurements or the actions recommended for protection.

To report the quality of the air, the IMECA uses 5 index categories:

Imeca Scale for Air Quality MexicoCityImecaScale.JPG
Imeca Scale for Air Quality

Concentration of pollutants during the last decade

Mexico and its Air Pollution Toluca y su Mugre Air Pollution in Toluca (3327018635).jpg
Mexico and its Air Pollution

PM10: According to the NOM, the annual limit for PM10 was 50 μg/m3 before 2014 and 40 μg/m3 from 2015 to present day. In Mexico City, the annual concentration of PM10 has been above the limit for the last 10 years .The highest concentration occurred in November 2019, when the PM10 levels were found to be over 110 μg/m3. Failure to comply with this NOM indicates that it is necessary to carry out actions to reduce the concentration of particulate material in the ambient air, given that it is not observed that there is a tendency to decrease in the concentrations registered for this pollutant criterion in recent years.

PM2.5: The values have exceeded the regulated limits (15 μg / m3 before and during 2014 and 12 μg / m3 as of 2015 ) since 2011. In May 2019, the level of PM2.5 reached levels between 150 and 160 μg / m3. This concentrations were reached due to burning of organic matter such as forest fires, firewood, fuel burning, especially diesel and some industrial processes. This concentrations amounts to the equivalent of Mexico City's inhabitants (of all ages) smoking nearly three-and-a-half cigarettes those days. [8]

Smog Mexico City AerialViewPhotochemicalSmogMexicoCity 2.jpg
Smog Mexico City

Ozone (O3): The limits for Ozone according to the NOM were 0.11 Parts Per Million before 2014 and 0.095 ppm from 2015 to present times. Over the past two decades, ozone levels gradually fell below government limits as authorities moved factories out of the capital and tightened regulations on fuel and cars. In 2015, 37% of the total days showed poor air quality due to O3, 2016 brought a small improvement to 35% of the days. And again in 2017, 35% of the days were recorded as "bad" due to O3 levels. At times during the past two years, ozone concentration levels in the city reached such extreme levels that officials issued environmental risk alerts, urging people to stay indoors. [9]

Sulfur dioxide (SO2): The NOM has three different limits to be met for concentrations of SO2: 8 hours (moving average), 24 hours (daily average) and annual average of the hourly data. During the last 10 years, concentrations below the three limits were recorded. However, in all stations the concentrations of this pollutant as a daily average are above the guideline value recommended by the World Health Organization, which is 0.008 ppm. From 2015 to 2017, the % of days with regular amounts of SO2 are minimal (above 5%).

Nitrogen dioxide (NO2): The NOM defines that the maximum allowable limit is 0.210 ppm as an hourly average. To comply with the standard, the established limit must not be exceeded more than once a year. In all monitoring stations in Mexico City where this NOM was evaluated, concentrations below the limit were recorded during 2015 to 2017. However, this NOM has not been updated since 1993 and the World Health Organization recommends as a guide that the limit of the hourly average for NO2: be set to 0.106 ppm. Regarding the distribution of air quality by NO2, monitoring stations dominated the days with good air quality in Mexico City between 2015 and 2017. In each of the years more than 90% of the days presented good air quality.

Carbon monoxide (CO): NOM establishes that the maximum permissible limit for CO is 11 ppm as a moving average of 8 hours. To comply with the standard, the established limit must not be exceeded more than once a year. Since 2011, the limit established in the NOM for CO in stations located within Mexico City has not been exceeded. Good air quality due to carbon monoxide predominate in all monitoring stations where it was possible to evaluate this pollutant.

Environmental contingency

On 16 May 2019, The government of Mexico City declared an extraordinary atmospheric environmental contingency, which indicates that the level of harmful particles in the air has exceeded the accepted standards (160 ppm for PM2.5). After a few hours, the same government would announce another "environmental contingency" for Ozone, so it would be necessary to reduce the number of vehicles circulating in the city. The Head of Federal government of Mexico, Claudia Sheinbaum, commented that the main cause behind the current levels of pollution were a series of Fires that have affected regions near the capital since the weekend. Schools were closed for two days and it was recommended by the authorities that citizens stayed home until the levels decreased.

"The Government knows that these particles generate problems in those with lung diseases, those who suffer from allergies, rhinitis, conjunctivitis and also for those who do not have regular discomfort: irritation of eyes or runny nose, because the body defends itself from these toxic elements", explains the expert in environmental toxicology and respiratory damage Carlos Falcón.

"They are not taking it seriously enough, they have simply kept things as they go and we do not see a substantial advance in all the measures that have been proposed to improve air quality", says the researcher at the Science Center of the Atmosphere, Ricardo Torres. "We did know that this could happen. There are bad conditions of dispersion of pollutants, but also a slow response from the authorities: during this weekend and until this Tuesday we had problems of atmospheric turbidity and according to what we have calculated, in one week we passed the World Health Organization standard 150 times", adds Torres. [10]

Awareness

One strategy to reduce health effects associated with poor air quality is to enhance public awareness and education of air quality and monitoring tools. In 2005, a survey was administered by members of the BMC Public Health with the purpose of finding out the levels of awareness from the general population in Mexico City about air pollution and its consequences. This study consisted of randomly selecting 800 individuals from Mexico City using a polling company named Parametria and asking them some Spanish-translated versions of the United States 2005 Behavioral Risk Factor Surveillance System.

The survey consisted of 17 questions about Demography, geographic, lifestyle and general knowledge about Air Pollution.

The response rate of the survey was 21%, which compares favorably to the average response rate of phone-based surveys administered in the United States. The demographic information recorded by respondents in terms of gender and age distribution mirrors that of publicly available Mexico City census data. Beyond participant demographic information, it was found that 15.5% of respondents either had a respiratory illness or a family member with a respiratory illness living in their household. This was determined through a question asking if a responder, or anyone in their home, had been diagnosed with a respiratory illness such as asthma.

Results indicate that respondents with a respiratory illness themselves or in the home, compared to those who did not, were 14% more likely to be aware of the IMECA index. Respondents with a respiratory illness in the home were more likely to have had a healthcare provider discuss the Air quality index with them. Following the assessment of air quality index awareness, analyses considered whether those who knew of this resource modified their behavior to reduce exposure to air pollution. To gauge this application of IMECA knowledge among respondents, the number of days modified, defined as avoiding exercise or strenuous activity outdoors in response to poor air quality over a 12-month period, was assessed.

Perceived air pollution behavior modification was further separated by air quality index awareness status. It was found that 23.8% of respondents modified their behavior based on perceived poor air quality and were familiar with the index, and only 11.2% of respondents modified their behavior and were unfamiliar with this tool. Finally, 26.2% of respondents modified their behavior in response to an air quality report at least once over the course of 1 year. [11]

Plan of action

In efforts to reduce the pollution, in 1989 the Mexican Government introduced "No-Drive Days", or Hoy No Circula, which prohibited drivers using their vehicles on one weekday per week, and in 2008 this was changed to include Saturdays. There is also large promotions for alternatives for driving, such as bus rapid transit lines and bike-sharing systems.

To address the city's disastrous pollution levels, the city's administration and the Metropolitan Environmental Commission (MEC) have mutually implemented two successive programs: the Comprehensive Programme Against Air Pollution (PICCA), which was launched in 1990, and ProAire, launched in 1995. The purpose of each was to improve the air quality of the metropolitan area of the valle de México (the Metropolitan Area of Mexico City). [12]

ProAire is now into ProAire IV, which addresses eight themes:

See also

Related Research Articles

<span class="mw-page-title-main">Smog</span> Smoke-like, fog-like air pollutions

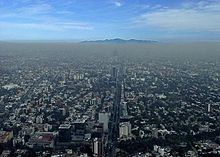
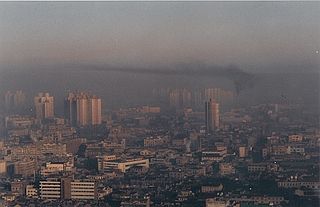
Smog, or smoke fog, is a type of intense air pollution. The word "smog" was coined in the early 20th century, and is a portmanteau of the words smoke and fog to refer to smoky fog due to its opacity, and odor. The word was then intended to refer to what was sometimes known as pea soup fog, a familiar and serious problem in London from the 19th century to the mid-20th century. This kind of visible air pollution is composed of nitrogen oxides, sulfur oxide, ozone, smoke and other particulates. Man-made smog is derived from coal combustion emissions, vehicular emissions, industrial emissions, forest and agricultural fires and photochemical reactions of these emissions.

<span class="mw-page-title-main">Indoor air quality</span> Air quality within and around buildings and structures

Indoor air quality (IAQ) is the air quality within and around buildings and structures. IAQ is known to affect the health, comfort, and well-being of building occupants. Poor indoor air quality has been linked to sick building syndrome, reduced productivity, and impaired learning in schools. Common pollutants of indoor air include: Secondhand tobacco smoke, air pollutants from indoor combustion, radon, molds and other allergens, carbon monoxide, volatile organic compounds, legionella and other bacteria, asbestos fibers, carbon dioxide, ozone and particulates. Source control, filtration, and the use of ventilation to dilute contaminants are the primary methods for improving indoor air quality in most buildings.

<span class="mw-page-title-main">Exhaust gas</span> Gases emitted as a result of fuel reactions in combustion engines

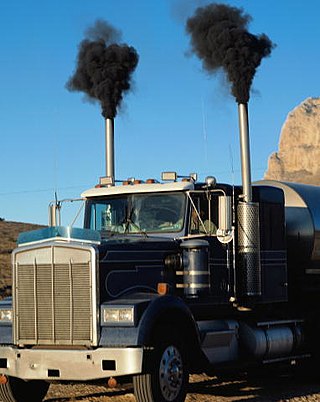
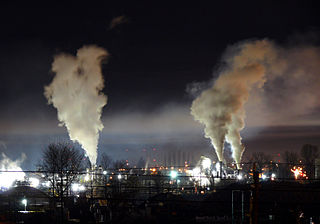
Exhaust gas or flue gas is emitted as a result of the combustion of fuels such as natural gas, gasoline (petrol), diesel fuel, fuel oil, biodiesel blends, or coal. According to the type of engine, it is discharged into the atmosphere through an exhaust pipe, flue gas stack, or propelling nozzle. It often disperses downwind in a pattern called an exhaust plume.

<span class="mw-page-title-main">National Ambient Air Quality Standards</span> US EPA limits on certain air pollutants

The U.S. National Ambient Air Quality Standards are limits on atmospheric concentration of six pollutants that cause smog, acid rain, and other health hazards. Established by the United States Environmental Protection Agency (EPA) under authority of the Clean Air Act, NAAQS is applied for outdoor air throughout the country.

<span class="mw-page-title-main">Air quality index</span> Measure of air pollution

An air quality index (AQI) is used by government agencies to communicate to the public how polluted the air currently is or how polluted it is forecast to become. AQI information is obtained by averaging readings from an air quality sensor, which can increase due to vehicle traffic, forest fires, or anything that can increase air pollution. Pollutants tested include ozone, nitrogen dioxide, sulphur dioxide, among others.

<span class="mw-page-title-main">Air Pollution Index</span> Air quality measurement in Malaysia

The Air Pollution Index is a simple and generalized way to describe the air quality, which is used in Malaysia. It is calculated from several sets of air pollution data and was formerly used in mainland China and Hong Kong. In mainland China the API was replaced by an updated air quality index in early 2012 and on 30 December 2013 Hong Kong moved to a health based index.

<span class="mw-page-title-main">Air pollution</span> Presence of dangerous substances in the atmosphere

Air pollution is the contamination of air due to the presence of substances in the atmosphere that are harmful to the health of humans and other living beings, or cause damage to the climate or to materials. It is also the contamination of indoor or outdoor surrounding either by chemical activities, physical or biological agents that alters the natural features of the atmosphere. There are many different types of air pollutants, such as gases, particulates, and biological molecules. Air pollution can cause diseases, allergies, and even death to humans; it can also cause harm to other living organisms such as animals and food crops, and may damage the natural environment or built environment. Air pollution can be caused by both human activities and natural phenomena.

Air pollution is the introduction of chemicals, particulate matter, or biological materials into the atmosphere, causing harm or discomfort to humans or other living organisms, or damaging ecosystems. Air pollution can cause health problems including, but not limited to, infections, behavioral changes, cancer, organ failure, and premature death. These health effects are not equally distributed across the U.S population; there are demographic disparities by race, ethnicity, socioeconomic status, and education. Air pollution has affected the United States since the beginning of the Industrial Revolution.


The Índice Metropolitano de la Calidad del Aire or IMECA, in English meaning the Metropolitan Index of Air Quality, is the reference value system for the levels of air pollution in the Mexico City Metropolitan Area, within the Valley of Mexico.

<span class="mw-page-title-main">Pollution in California</span> Overview of pollution in the U.S. state of California

Pollution in California relates to the degree of pollution in the air, water, and land of the state of California. Pollution is defined as the addition of any substance or any form of energy to the environment at a faster rate than it can be dispersed, diluted, decomposed, recycled, or stored in some harmless form. The combination of three main factors are the cause of notable unhealthy levels of air pollution in California: the activities of over 39 million people, a mountainous terrain that traps pollution, and a warm climate that helps form ozone and other pollutants. Eight of the ten cities in the US with the highest year-round concentration of particulate matter between 2013 and 2015 were in California, and seven out of the ten cities in the US with the worst ozone pollution were also in California. Studies show that pollutants prevalent in California are linked to several health issues, including asthma, lung cancer, birth complications, and premature death. In 2016, Bakersfield, California recorded the highest level of airborne pollutants of any city in the United States.

<span class="mw-page-title-main">Air quality law</span> Type of law

Air quality laws govern the emission of air pollutants into the atmosphere. A specialized subset of air quality laws regulate the quality of air inside buildings. Air quality laws are often designed specifically to protect human health by limiting or eliminating airborne pollutant concentrations. Other initiatives are designed to address broader ecological problems, such as limitations on chemicals that affect the ozone layer, and emissions trading programs to address acid rain or climate change. Regulatory efforts include identifying and categorising air pollutants, setting limits on acceptable emissions levels, and dictating necessary or appropriate mitigation technologies.

Inhalation is a major route of exposure that occurs when an individual breathes in polluted air which enters the respiratory tract. Identification of the pollutant uptake by the respiratory system can determine how the resulting exposure contributes to the dose. In this way, the mechanism of pollutant uptake by the respiratory system can be used to predict potential health impacts within the human population.

<span class="mw-page-title-main">Air pollution in Canada</span> Overview of the air pollution in Canada

Air pollution is the release of pollutants into the air that are detrimental to human health and the Earth. In Canada, air pollution is regulated by standards set by the Canadian Council of Ministers of the Environment (CCME), an inter-governmental body of federal, provincial and territorial Ministers responsible for the environment. Air pollution from the United States and to lesser extent Canada; caused by metal smelting, coal-burning for utilities, and vehicle emissions has resulted in acid rain, has severely impacted Canadian waterways, forest growth, and agricultural productivity.

<span class="mw-page-title-main">Particulates</span> Microscopic solid or liquid matter suspended in the Earths atmosphere

Particulates – also known as atmospheric aerosol particles, atmospheric particulate matter, particulate matter (PM) or suspended particulate matter (SPM) – are microscopic particles of solid or liquid matter suspended in the air. The term aerosol commonly refers to the particulate/air mixture, as opposed to the particulate matter alone. Sources of particulate matter can be natural or anthropogenic. They have impacts on climate and precipitation that adversely affect human health, in ways additional to direct inhalation.

The Air Quality Health Index (AQHI) is a scale designed in Canada to help understand the impact of air quality on health. It is a health protection tool used to make decisions to reduce short-term exposure to air pollution by adjusting activity levels during increased levels of air pollution. The Air Quality Health Index also provides advice on how to improve air quality by proposing behavioral change to reduce the environmental footprint. This index pays particular attention to people who are sensitive to air pollution. It provides them with advice on how to protect their health during air quality levels associated with low, moderate, high and very high health risks.

Air pollution measurement is the process of collecting and measuring the components of air pollution, notably gases and particulates. The earliest devices used to measure pollution include rain gauges, Ringelmann charts for measuring smoke, and simple soot and dust collectors known as deposit gauges. Modern air pollution measurement is largely automated and carried out using many different devices and techniques. These range from simple absorbent test tubes known as diffusion tubes through to highly sophisticated chemical and physical sensors that give almost real-time pollution measurements, which are used to generate air quality indexes.

<span class="mw-page-title-main">Nitrogen dioxide poisoning</span> Medical condition

Nitrogen dioxide poisoning is the illness resulting from the toxic effect of nitrogen dioxide. It usually occurs after the inhalation of the gas beyond the threshold limit value. Nitrogen dioxide is reddish-brown with a very harsh smell at high concentrations, at lower concentrations it is colorless but may still have a harsh odour. Nitrogen dioxide poisoning depends on the duration, frequency, and intensity of exposure.

<span class="mw-page-title-main">Air quality guideline</span>

The World Health Organization guidelines were most recently updated in 2021. The guidelines offer guidance about these air pollutants: particulate matter (PM), ozone (O3), nitrogen dioxide (NO2), sulfur dioxide (SO2) and carbon monoxide (CO). The WHO first released the air quality guidelines in 1987, then updated them in 1997. The reports provide guidelines intending to give guidelines to reduce the health effects of air pollution.

<span class="mw-page-title-main">Air pollution in Taiwan</span>

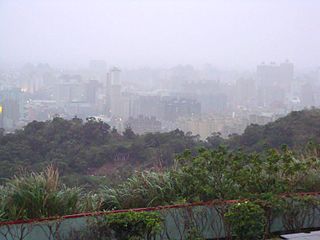
Air pollution in Taiwan is mostly derived from sources of domestic combustion, primarily the burning of fossil fuels. Taiwan's topography has been noted to be a contributing factor to its air pollution problem, leading to poor dispersal and trapping pollutants. Taipei, Taiwan's capital and largest city for example, is surrounded by mountains, and other industrial centers along the northern and western coasts of Taiwan are surrounded by high mountains.

Particulate pollution is pollution of an environment that consists of particles suspended in some medium. There are three primary forms: atmospheric particulate matter, marine debris, and space debris. Some particles are released directly from a specific source, while others form in chemical reactions in the atmosphere. Particulate pollution can be derived from either natural sources or anthropogenic processes.

References

  1. 1 2 "Air Quality, Weather and Climate in Mexico City". Bulletin. Retrieved 9 June 2009.
  2. Riding, Alan; Times, Special To the New York (15 May 1983). "Problems of Mexico City: Warning to Third World". The New York Times.
  3. Guerra, Erick (1 February 2015). "The geography of car ownership in Mexico City: a joint model of households' residential location and car ownership decisions". Journal of Transport Geography. 43: 171–180. doi: 10.1016/j.jtrangeo.2015.01.014 .
  4. 1 2 Cave, Damien (9 April 2012). "Vertical Gardens in Mexico a Symbol of Progress". The New York Times.
  5. "Efectos de la contaminación atmosférica en la salud y su importancia en la ciudad de México" (PDF). 2 September 2002. Retrieved 30 November 2019.
  6. "Mexico City declares 3rd day of traffic cuts over high smog". Associated Press. 4 May 2016. Retrieved 9 March 2017.
  7. Campbell, Monica (12 May 2016). "Why Mexico City's bad air can't be ignored – or easily fixed". PRI's The World. Retrieved 9 March 2017.
  8. "Mexico City's air is bad for you". Latin America Reports. 1 March 2019. Retrieved 9 December 2019.
  9. Schachar, Natalie. "Mexico City Tries New Tactics Against an Old Enemy: Smog". CityLab. Retrieved 9 December 2019.
  10. Reina, Elena (16 May 2019). "Ciudad de México anuncia la suspensión de clases dos días consecutivos por la contaminación". El País (in Spanish). ISSN   1134-6582 . Retrieved 9 December 2019.
  11. Borbet, Timothy C.; Gladson, Laura A.; Cromar, Kevin R. (23 April 2018). "Assessing air quality index awareness and use in Mexico City". BMC Public Health. 18 (1): 538. doi:10.1186/s12889-018-5418-5. ISSN   1471-2458. PMC   5913808 . PMID   29688852.
  12. "Mexico City's ProAire programme – Centre for Public Impact (CPI)". centreforpublicimpact.org. Retrieved 10 December 2019.
  13. Gobierno del Estado de México (2018). Program de Gestión para Mejorar la Calidad del Aire en el Estado de México. Ciudad de Mexico, Mexico: Gobierno del Estado de México. pp. 195–207.