Angle-resolved low-coherence interferometry

Last updated

Angle-resolved low-coherence interferometry (a/LCI) is an emerging[ when? ] biomedical imaging technology which uses the properties of scattered light to measure the average size of cell structures, including cell nuclei. The technology shows promise as a clinical tool for in situ detection of dysplastic, or precancerous tissue.

Contents

Introduction

A/LCI combines low-coherence interferometry with angle-resolved scattering to solve the inverse problem of determining scatterer geometry based on far field diffraction patterns. Similar to optical coherence domain reflectometry (OCDR) and optical coherence tomography (OCT), a/LCI uses a broadband light source in an interferometry scheme in order to achieve optical sectioning with a depth resolution set by the coherence length of the source. Angle-resolved scattering measurements capture light as a function of the scattering angle, and invert the angles to deduce the average size of the scattering objects via a computational light scattering model such as Mie theory, which predicts angles based on the size of the scattering sphere. Combining these techniques allows construction of a system that can measure average scatter size at various depths within a tissue sample.

At present the most significant medical application of the technology is determining the state of tissue health based on measurements of average cell nuclei size. It has been found that as tissue changes from normal to cancerous, the average cell nuclei size increases. [1] Several recent studies [2] have shown that via cell nuclei measurements, a/LCI can detect the presence of low- and high-grade dysplasia with 91% sensitivity and distinguish between normal and dysplastic with 97% specificity.

History

Since 2000, light scattering systems have been used for biomedical applications such as the study of cellular morphology [3] as well as the diagnosis of dysplasia. [4] Variations in scattering distributions as a function of angle or wavelength have been used to deduce information regarding the size of cells and subcellular objects such as nuclei and organelles. These size measurements can then be used diagnostically to detect tissue changes—including neoplastic changes (those leading to cancer).

Light scattering spectroscopy has been used to detect dysplasia in the colon, bladder, cervix, and esophagus of human patients. [2] Light scattering has also been used to detect Barrett's esophagus, a metaplastic condition with a high probability of leading to dysplasia. [5]

However, in contrast with a/LCI, these techniques all rely on total intensity based measurements, which lack the ability to provide results as a function of depth in the tissue.

Early a/LCI models

Path of light in a Michelson interferometer. Interferometer.svg
Path of light in a Michelson interferometer.

The first implementation of a/LCI [6] used a Michelson interferometer, the same model used in the famous Michelson–Morley experiment. The Michelson interferometer splits one beam of light into two paths, one reference path and one sampling path, and recombines them again to produce a waveform resulting from interference. The difference between the reference beam and the sampling beam thus reveal the properties of the sample in the way it scatters light.

The early a/LCI device used a movable mirror and lens in the reference arm so that researchers could replicate different angles and depths in the reference beam as they occurred in the collected backscattered light. This allowed isolation of the backscattered light at varying depths of reflection in the sample. In order to transform the data into measurements of cell structure, angular scattering distributions are then compared to the predictions of Mie theory—which calculates the size of spheres relative to their light scattering patterns.

The a/LCI technique was first validated in studies of polystyrene microspheres, [6] the sizes of which were known and relatively homogeneous. A later study expanded the signal processing method to compensate for the nonspherical and inhomogeneous nature of cell nuclei. [7]

This early system required up to 40 minutes to acquire the data for a 1 mm² point in a sample, but proved the feasibility of the idea.

Fourier-domain implementation

Like OCT, the early implementations of a/LCI relied on physically changing the optical path length (OPL) to control the depth in the sample from which data are acquired. However, it has been demonstrated [8] that it is possible to use a Fourier domain implementation to yield depth resolution in a single data acquisition. A broadband light source is used to produce a spectrum of wavelengths at once, and the backscattered light is collected by a coherent optical fiber in the return path to capture different scattering angles simultaneously. [9] Intensity is then measured via a spectrometer: a single frame from the spectrometer contains scattering intensity as a function of wavelength and angle. Finally the data is Fourier transformed on a line-by-line basis to generate scattering intensity as a function of OPL and angle. In the resulting image, the x axis represents the OPL and the y axis the angle of reflection, thus yielding a 2D map of reflection intensities.

Using this method, the acquisition speed is limited only by the integration time of the spectrometer and can be as short at 20 ms. The same data that initially required tens of minutes to acquire can be acquired ~105 times faster. [9]

Schematic description

Schematic of a/LCI system. Light is provided by SLD, sample and reference light are generated by fiber splitter (FS), while lenses L2, L3, and L4 provide collimation. The beamsplitter (BS) combines sample and reference arm light, which is then incident on the imaging spectrometer. On the right is the optical geometry of probe tip with illumination fiber (DF), lens L1, and collection fiber (FB). ALCI Schematic.PNG
Schematic of a/LCI system. Light is provided by SLD, sample and reference light are generated by fiber splitter (FS), while lenses L2, L3, and L4 provide collimation. The beamsplitter (BS) combines sample and reference arm light, which is then incident on the imaging spectrometer. On the right is the optical geometry of probe tip with illumination fiber (DF), lens L1, and collection fiber (FB).

The Fourier-domain version of the a/LCI system uses a superluminescent diode (SLD) with a fiber-coupled output as the light source. A fiber splitter separates the signal path at 90% intensity and the reference path at 10%.

The light from the SLD passes through an optical isolator and subsequently a polarization controller. It has been shown that control of light polarization is important for maximizing optical signal and comparing angular scattering with the Mie scattering model. [10] A polarization-maintaining fiber is used to carry the illumination light to the sample. A second polarization controller is similarly used to control the polarization of the light passing through the reference path.

The output of the fiber on the right is collimated using lens L1 and illuminates the tissue. But because the delivery fiber is offset from the optical axis of the lens, the beam is delivered to the sample at an oblique angle. Backscattered light is then collimated by the same lens and collected by the fiber bundle. The fibers are one focal length from the lens, and the sample is one focal length on the other side. This configuration captures light from the maximum range of angles and minimizes light noise due to specular reflections.

At the distal end of the fiber bundle, light from each fiber is imaged onto the spectrometer. Light from the sample and reference arms are mixed by a beamsplitting cube (BS), and are incident on the entrance slit of an imaging spectrometer. Data from the imaging spectrometer are transferred to a computer via USB interface for signal processing and display of results. The computer also provides control of the imaging spectrometer.

Clinical device prototype

Picture of portable a/LCI system with handheld fiber probe on the right and the optical engine on the left. The computer is not shown. Alci clinical picture.jpg
Picture of portable a/LCI system with handheld fiber probe on the right and the optical engine on the left. The computer is not shown.

The a/LCI system has recently been enhanced to allow operation in a clinical setting with the addition of a handheld wand. [11] By carefully controlling the polarization in the delivery fiber, using polarization-maintaining fibers and inline polarizers, the new system allows manipulation of the handheld wand without signal degradation due to birefringence effects. In addition, the new system employed an anti-reflection coated ball lens in the probe tip, which reduces reflections that otherwise limit the depth range of the system.

The portable system uses a 2 ft by 2 ft optical breadboard as the base, with the source, fiber optic components, lens, beamsplitter, and imaging spectrometer mounted to the breadboard. An aluminum cover protects the optics. A fiber probe with a handheld probe enables easy access to tissue samples for testing. On the left side sits a white sample platform, where tissue is placed for testing. The handheld probe is used by the operator to select specific sites on the tissue from which a/LCI readings are acquired.

See also

Related Research Articles

<span class="mw-page-title-main">Spectroscopy</span> Study involving matter and electromagnetic radiation

Spectroscopy is the field of study that measures and interprets the electromagnetic spectra that result from the interaction between electromagnetic radiation and matter as a function of the wavelength or frequency of the radiation. In simpler terms, spectroscopy is the precise study of color as generalized from visible light to all bands of the electromagnetic spectrum.

Fourier-transform spectroscopy is a measurement technique whereby spectra are collected based on measurements of the coherence of a radiative source, using time-domain or space-domain measurements of the radiation, electromagnetic or not. It can be applied to a variety of types of spectroscopy including optical spectroscopy, infrared spectroscopy, nuclear magnetic resonance (NMR) and magnetic resonance spectroscopic imaging (MRSI), mass spectrometry and electron spin resonance spectroscopy.

<span class="mw-page-title-main">Raman spectroscopy</span> Spectroscopic technique

Raman spectroscopy is a spectroscopic technique typically used to determine vibrational modes of molecules, although rotational and other low-frequency modes of systems may also be observed. Raman spectroscopy is commonly used in chemistry to provide a structural fingerprint by which molecules can be identified.

<span class="mw-page-title-main">Interferometry</span> Measurement method using interference of waves

Interferometry is a technique which uses the interference of superimposed waves to extract information. Interferometry typically uses electromagnetic waves and is an important investigative technique in the fields of astronomy, fiber optics, engineering metrology, optical metrology, oceanography, seismology, spectroscopy, quantum mechanics, nuclear and particle physics, plasma physics, biomolecular interactions, surface profiling, microfluidics, mechanical stress/strain measurement, velocimetry, optometry, and making holograms.

Optics is the branch of physics which involves the behavior and properties of light, including its interactions with matter and the construction of instruments that use or detect it. Optics usually describes the behavior of visible, ultraviolet, and infrared light. Because light is an electromagnetic wave, other forms of electromagnetic radiation such as X-rays, microwaves, and radio waves exhibit similar properties.

<span class="mw-page-title-main">Michelson interferometer</span> Common configuration for optical interferometry

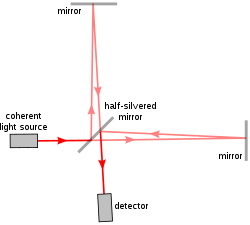
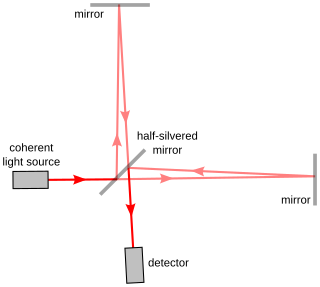
The Michelson interferometer is a common configuration for optical interferometry and was invented by the 19/20th-century American physicist Albert Abraham Michelson. Using a beam splitter, a light source is split into two arms. Each of those light beams is reflected back toward the beamsplitter which then combines their amplitudes using the superposition principle. The resulting interference pattern that is not directed back toward the source is typically directed to some type of photoelectric detector or camera. For different applications of the interferometer, the two light paths can be with different lengths or incorporate optical elements or even materials under test.

<span class="mw-page-title-main">Optical coherence tomography</span> Imaging technique

Optical coherence tomography (OCT) is an imaging technique that uses interferometry with short-coherence-length light to obtain micrometer-level depth resolution and uses transverse scanning of the light beam to form two- and three-dimensional images from light reflected from within biological tissue or other scattering media. Short-coherence-length light can be obtained using a superluminescent diode (SLD) with a broad spectral bandwidth or a broadly tunable laser with narrow linewidth. The first demonstration of OCT imaging was published by a team from MIT and Harvard Medical School in a 1991 article in the journal Science. The article introduced the term “OCT” to credit its derivation from optical coherence-domain reflectometry, in which the axial resolution is based on temporal coherence. The first demonstrations of in vivo OCT imaging quickly followed.

<span class="mw-page-title-main">Backscatter</span> Reflection which reverses the direction of a wave, particle, or signal

In physics, backscatter is the reflection of waves, particles, or signals back to the direction from which they came. It is usually a diffuse reflection due to scattering, as opposed to specular reflection as from a mirror, although specular backscattering can occur at normal incidence with a surface. Backscattering has important applications in astronomy, photography, and medical ultrasonography. The opposite effect is forward scatter, e.g. when a translucent material like a cloud diffuses sunlight, giving soft light.

<span class="mw-page-title-main">Profilometer</span> Measuring instrument for surface profile and roughness

A profilometer is a measuring instrument used to measure a surface's profile, in order to quantify its roughness. Critical dimensions as step, curvature, flatness are computed from the surface topography.

<span class="mw-page-title-main">Neutron spin echo</span> Neutron scattering technique

Neutron spin echo spectroscopy is an inelastic neutron scattering technique invented by Ferenc Mezei in the 1970s and developed in collaboration with John Hayter. In recognition of his work and in other areas, Mezei was awarded the first Walter Haelg Prize in 1999.

Diffusing-wave spectroscopy (DWS) is an optical technique derived from dynamic light scattering (DLS) that studies the dynamics of scattered light in the limit of strong multiple scattering. It has been widely used in the past to study colloidal suspensions, emulsions, foams, gels, biological media and other forms of soft matter. If carefully calibrated, DWS allows the quantitative measurement of microscopic motion in a soft material, from which the rheological properties of the complex medium can be extracted via the microrheology approach.

Speckle, speckle pattern, or speckle noise is a granular noise texture degrading the quality as a consequence of interference among wavefronts in coherent imaging systems, such as radar, synthetic aperture radar (SAR), medical ultrasound and optical coherence tomography. Speckle is not external noise; rather, it is an inherent fluctuation in diffuse reflections, because the scatterers are not identical for each cell, and the coherent illumination wave is highly sensitive to small variations in phase changes.

The technique of vibrational analysis with scanning probe microscopy allows probing vibrational properties of materials at the submicrometer scale, and even of individual molecules. This is accomplished by integrating scanning probe microscopy (SPM) and vibrational spectroscopy. This combination allows for much higher spatial resolution than can be achieved with conventional Raman/FTIR instrumentation. The technique is also nondestructive, requires non-extensive sample preparation, and provides more contrast such as intensity contrast, polarization contrast and wavelength contrast, as well as providing specific chemical information and topography images simultaneously.

Optical coherence tomography (OCT) is a technique that displays images of the tissue by using the backscattered light.

Multiple scattering low coherence interferometry (ms/LCI) is an imaging technique that relies on analyzing multiply scattered light in order to capture depth-resolved images from optical scattering media. With current applications primarily in medical imaging, has the advantage of a higher range since forward scattered light attenuates less with depth when compared to the specularly reflected light that is assessed in more conventional imaging methods such as optical coherence tomography. This allows ms/LCI to image through up to 90 mean free scattering paths, compared to roughly 27 scattering MFPs in OCT and 1–2 scattering MFPs in confocal microscopy.

Speckle variance optical coherence tomography (SV-OCT) is an imaging algorithm for functional optical imaging. Optical coherence tomography is an imaging modality that uses low-coherence interferometry to obtain high resolution, depth-resolved volumetric images. OCT can be used to capture functional images of blood flow, a technique known as optical coherence tomography angiography (OCT-A). SV-OCT is one method for OCT-A that uses the variance of consecutively acquired images to detect flow at the micron scale. SV-OCT can be used to measure the microvasculature of tissue. In particular, it is useful in ophthalmology for visualizing blood flow in retinal and choroidal regions of the eye, which can provide information on the pathophysiology of diseases.

Spectroscopic optical coherence tomography (SOCT) is an optical imaging and sensing technique, which provides localized spectroscopic information of a sample based on the principles of optical coherence tomography (OCT) and low coherence interferometry. The general principles behind SOCT arise from the large optical bandwidths involved in OCT, where information on the spectral content of backscattered light can be obtained by detection and processing of the interferometric OCT signal. SOCT signal can be used to quantify depth-resolved spectra to retrieve the concentration of tissue chromophores, characterize tissue light scattering, and/or used as a functional contrast enhancement for conventional OCT imaging.

Light scattering spectroscopy (LSS) is a spectroscopic technique typically used to evaluate morphological changes in epithelial cells in order to study mucosal tissue and detect early cancer and precancer.

Dual-axis optical coherence tomography (DA-OCT) is an imaging modality that is based on the principles of optical coherence tomography (OCT). These techniques are largely used for medical imaging. OCT is non-invasive and non-contact. It allows for real-time, in situ imaging and provides high image resolution. OCT is analogous to ultrasound but relies on light waves, which makes it faster than ultrasound. In general, OCT has proven to be compact and portable. It is compatible with arterial catheters and endoscopes, which helps diagnose diseases within long internal cavities, including the esophagus and coronary arteries.

References

  1. Pyhtila, J; Chalut, K; Boyer, J; Keener, J; Damico, T; Gottfried, M; Gress, F; Wax, A (2007). "In situ detection of nuclear atypia in Barrett's esophagus by using angle-resolved low-coherence interferometry". Gastrointestinal Endoscopy. 65 (3): 487–91. doi:10.1016/j.gie.2006.10.016. PMID   17321252.
  2. 1 2 Wax, Adam; Pyhtila, John W.; Graf, Robert N.; Nines, Ronald; Boone, Charles W.; Dasari, Ramachandra R.; Feld, Michael S.; Steele, Vernon E.; Stoner, Gary D. (2005). "Prospective grading of neoplastic change in rat esophagus epithelium using angle-resolved low-coherence interferometry". Journal of Biomedical Optics. 10 (5): 051604. Bibcode:2005JBO....10e1604W. doi:10.1117/1.2102767. hdl: 1721.1/87657 . PMID   16292952.
  3. Backman, V.; Gopal, V.; Kalashnikov, M.; Badizadegan, K.; Gurjar, R.; Wax, A.; Georgakoudi, I.; Mueller, M.; et al. (2001). "Measuring cellular structure at submicrometer scale with light scattering spectroscopy". IEEE Journal of Selected Topics in Quantum Electronics. 7 (6): 887–893. Bibcode:2001IJSTQ...7..887B. doi:10.1109/2944.983289.
  4. Wallace, M; Perelman, LT; Backman, V; Crawford, JM; Fitzmaurice, M; Seiler, M; Badizadegan, K; Shields, SJ; et al. (2000). "Endoscopic Detection of Dysplasia in Patients with Barrett's Esophagus Using Light-Scattering Spectroscopy". Gastroenterology. 119 (3): 677–82. doi:10.1053/gast.2000.16511. PMID   10982761.
  5. Lovat, Laurence B.; Pickard, David; Novelli, Marco; Ripley, Paul M.; Francis, Helen; Bigio, Irving J.; Bown, Stephen G. (2000-04-01). "4919 A novel optical biopsy technique using elastic scattering spectroscopy for dysplasia and cancer in Barrett's esophagus". Gastrointestinal Endoscopy. 51 (4): AB227. doi:10.1016/S0016-5107(00)14616-4. ISSN   0016-5107.
  6. 1 2 Wax, A; Yang, C; Backman, V; Kalashnikov, M; Dasari, RR; Feld, MS (2002). "Determination of particle size by using the angular distribution of backscattered light as measured with low-coherence interferometry" (PDF). Journal of the Optical Society of America A . 19 (4): 737–44. Bibcode:2002JOSAA..19..737W. doi:10.1364/JOSAA.19.000737. PMID   11934166. S2CID   15388301.
  7. Wax, A; Yang, C; Backman, V; Badizadegan, K; Boone, CW; Dasari, RR; Feld, MS (2002). "Cellular organization and substructure measured using angle-resolved low-coherence interferometry". Biophysical Journal. 82 (4): 2256–64. Bibcode:2002BpJ....82.2256W. doi:10.1016/S0006-3495(02)75571-9. PMC   1302018 . PMID   11916880.
  8. Choma, M; Sarunic, M; Yang, C; Izatt, J (2003). "Sensitivity advantage of swept source and Fourier domain optical coherence tomography" (PDF). Optics Express. 11 (18): 2183–9. Bibcode:2003OExpr..11.2183C. doi: 10.1364/OE.11.002183 . PMID   19466106.
  9. 1 2 Pyhtila, John W.; Boyer, Jeffrey D.; Chalut, Kevin J.; Wax, Adam (2006). "Fourier-domain angle-resolved low coherence interferometry through an endoscopic fiber bundle for light-scattering spectroscopy". Optics Letters. 31 (6): 772–4. Bibcode:2006OptL...31..772P. doi:10.1364/OL.31.000772. PMID   16544619.
  10. Pyhtila, John W.; Wax, Adam (2007). "Polarization effects on scatterer sizing accuracy analyzed with frequency-domain angle-resolved low-coherence interferometry". Applied Optics. 46 (10): 1735–41. Bibcode:2007ApOpt..46.1735P. doi:10.1364/AO.46.001735. PMID   17356616.
  11. "Oncoscope".