Bacterioplankton counting methods

Last updated

Bacterioplankton counting is the estimation of the abundance of bacterioplankton in a specific body of water, which is useful information to marine microbiologists. Various counting methodologies have been developed over the years to determine the number present in the water being observed. Methods used for counting bacterioplankton include epifluorescence microscopy, flow cytometry, measures of productivity through frequency of dividing cells (FDC), thymidine incorporation, and leucine incorporation.

Contents

Factors such as salinity, temperature, latitude, various nutrient levels, water movement and the presence of other organisms can affect bacterioplankton enumeration. [1] [2] [3] [4] [5] Changes in these factors affect the bacterioplankton count, causing it to vary by body of water, location, distance from shore and season. [6] [7] [8]

Bacterioplankton count is usually expressed in cells per ml (cells ml−1).

Uses

In understanding marine microbiology and the aquatic ecosystem, bacterioplankton counts can be useful. Observation of bacterioplankton number can provide more information in the following:

Epifluorescence microscopy

Fluorescence microscope light pathway FluorescenceFilters 2008-09-28.svg
Fluorescence microscope light pathway

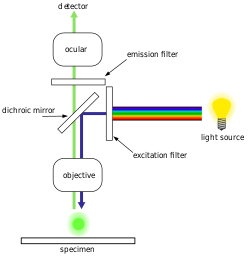
Epifluorescence microscopy is an advanced optical microscope technique that relies on the use of fluorescent dyes that bind to specific biological markers, which then emit a distinctive emission spectra that is identified through the lens. Fluorescent dyes include DAPI, Acridine Orange, SYBR Green 1, and YO-PRO-1, all of which are capable of staining both DNA and RNA structures in biological samples such as bacteria and viruses. [18] [19] [20] [21] However, DNA staining is primarily used for bacterial cell identification. With modern epifluorescence microscopy, the industry standard for estimating and counting bacterial cell quantities is by the use of a DAPI stain. [22] This technique can be performed for samples from a wide range of environments and locations, such as seawater, various sources of freshwater, as well as soils and sediments. [22]

Enumeration technique

In a standard experiment, prepared bacterial samples are placed onto counting slides and then viewed under an epifluorescence microscope. Magnification is set to a level where the 0.1 X 0.1 mm square units on the counting slide are clearly visible. [23] To quantify the bacteria, cells are counted in 5-30 random square unit field-of-views and an average bacteria count per field is tabulated. [22] This value is then extrapolated to estimate the total bacterial cell-count per mL by determining the total number of fields-of-view on the slide deposition area and multiplying this by the average bacterial count per counting unit. [23]

Reliability

To enumerate bacterial cell quantities, only small portions of bacteria in a sample are physically counted for logistical reasons, upon which total abundances are estimated by extrapolation. Mean values are then used for comparison among samples. However the accuracy of this technique, where tabulation of only a small subset is used to estimate total abundance quantities, has been brought into question. [22] Primarily, it has been shown that the distribution of bacterial cells on counting slides can be uneven and inconsistent. [22] In addition, to get a legitimate estimate of bacterial counts by using this technique, it has been suggested that more than 350 individual cells, from 20 fields of view must be measured. [22] This can be not only time-consuming, but difficult to achieve in certain samples.

Flow Cytometry

The inner working of a flow cytometer Flow cytometer.png
The inner working of a flow cytometer

Flow cytometric analysis (or, flow cytometry) is a common procedure in many clinical applications. However, despite its discovery more than three decades ago, its adoption by aquatic microbial ecology in enumeration of bacterioplankton, has been relatively slow. [24] Its use is yet to surpass epifluorescence microscopy. [25] Despite both abundance estimation techniques being relatively accurate, flow cytometry is less prone to human error, more precise, pertains a higher resolution and is capable of examining tens of thousands of cells in a matter of minutes. [24] Flow cytometry is also able to provide information regarding size, activity and morphology of cells besides abundance of cells. [26]

Flow cytometry can be used to distinguish and quantify both photosynthetic and non-photosynthetic bacterioplankton. [26] Quantification of photosynthetic prokaryotes such as cyanobacteria and picoeukaryotic algae is made possible by the ability of photosynthetic pigments to fluoresce. [27] For instance, the different formation of photosynthetic pigments in the two major photosynthetic prokaryotes, Prochlorococcus and Synechococcus , enable their very distinction. [28] [29] [30] Prochlorococcus contains divynyl-chlorophylls a and b which display solely red fluorescence under excitation by blue or UV light, while Synechococcus emits both orange and red fluorescence; orange from phycobilins and red from chlorophyll. Besides fluorescence, Prochlorococcus and Synechococus are of significantly different sizes and hence deliver different scatter signals upon flow cytometric analysis. This further helps in their differentiation. [31] Quantification of prochlorococcus is considered a major breakthrough as it has almost only been possible through flow cytometry. This is due to the inability of epifluorescence microscopy to detect the low chlorophyll autofluorescence present in Prochlorococcus. [26]

Besides photosynthetic bacterioplankton, non-photosynthetic bacterioplankton can also be enumerated by flow cytometry. This is done via DNA or food vacuole staining. [27] Flow cytometry has especially been successful at differentiating Prochloroccocus from heterotrophic bacteria, whose counts were initially confounded due to their similar size.

Use of epifluorescence microscopy over flow cytometry in many microbial ecology labs can be blamed on a number of economic and practical factors. First, the use of commercial flow cytometers requires the expertise of a rigorously trained technician. Second, flow cytometers are fairly expensive in comparison to epi-fluorescence microscopy apparatus. Third, many flow cytometers are designed to examine blood cells; oceanic bacteria are relatively small and hence approach limit of resolution in many commercial flow cytometers. [32]

Enumeration Process

Flow cytometric quantification of bacterioplankton involves four steps: fixation, staining, data processing and data interpretation.

Fixation

Fixation is done to not only preserve sample, but also to increase permeability of cells to stains. [24] However, most common fixation agents have the capacity to alter cells by changing certain aspects such as size, how light is scattered, autofluorescence and nucleic acids. This is problematic as flow cytometric distinction of cells relies on these qualities. Some fixatives also lead to complete loss of cells. [24] Presently, some of the agents used in the fixation process include two variations of formaldehyde (formalin and paraformaldehyde), 70% ethanol, glutaraldehyde and TCA. [33] It is presumed that the best fixation agent for protein and nucleic acids is paraformaldehyde due to its ability to swiftly enter cells. [24]

Staining

In flow cytometry, staining enables distinction of bacterioplankton from non-bacterial particles. It involves the incubation of sample in the wide array of fluorochromes such as UV-excited dyes (DAPI and Hoechst 33342) and blue-light-excited nucleic acid dyes (TO-PRO-1,TOTO-1, SYBR Green I). [31] For a long time, flow cytometers utilized UV-excited dyes to examine bacterioplankton which could be used in either low-cost flow cytometers with limited sensitivity, or expensive flow cytometers with the high sensitivity needed to distinguish heterotrophic bacteria from autotrophs. The introduction of blue-excited dyes such as SYBR Green I, enabled high quality flow cytometric analysis of bacterioplankton on low-cost, high-sensitivity flow cytometers. [31]

Incubation times for optimum staining varies from compound to compound. UV-excited dyes can require an hour or more while blue-light-excited dyes require a mere 15 minutes. [24]

Staining can be accompanied by buffers such as Triton X-100 which make cells more permeable to stains. They are especially used in cell-impermeant dyes like TO-PRO-1. Buffers are also used to dilute dyes sensitive to ionic strength such as Picogreen, YO-PRO-1 and YOYO-1. The use of buffers however, can be harmful to cells as buffers like Triton-X-100 can not only extinguish chlorophyll fluorescence, but also create unwanted background fluorescence. This can increase the difficulty of distinguishing between heterotrophic bacteria and autotrophic prokaryotes. [24]

Counting

Cytometric analysis of cyanobacteria Picoplancton cytometrie.jpg
Cytometric analysis of cyanobacteria

In a flow cytometric analysis, over 200 cells pass in front of a laser beam or mercury lamp every second, a cell at a time. Photomultipliers gather the amount of light each particle scatters and the fluorescence emitted upon excitation. This information is then internalized and interpreted by the system as an event. However, despite the ability of flow cytometers to count cells with very little effort, most have no way of determining actual concentration of cells. This can be determined through a variety of methods including, use of reference beads whose quantity is pre-determined (helps determine the ratio of bacteria to beads), weight measurements before and after experiment and daily calibration of flow. [24]

A big advantage of flow cytometers is their ability to identify different populations of bacterioplankton. This discrimination is done via analysis of four factors; light scatter, green fluorescence, blue fluorescence and red fluorescence. Light scatter analysis is inadequate alone and is often examined alongside fluorescence for a number of reasons; first, sea water contains many particles that scatter light like bacteria. Second, the sizes of many oceanic bacteria approach limit of resolution. The amount of light scattered by cells is determined by not only size of cells, but also internal structure, refractive index, shape and orientation of particle. Scattered light is classified into either forward scatter (FSC) or side scatter (SSC). The former has been associated with cell volume and mass while the latter has been associated with index of refraction, content and granularity of cells [24]

When cell concentrations are higher than 2.5 × 10⁶ cells per ml, the likelihood of more than once cell passing in close proximity and being recorded as a single event is magnified. This is known as coincidence and can be easily avoided by diluting sample before hand [31]

Measures of productivity

Frequency of dividing cells

Frequency of dividing cells (FDC) is a method used to predict the average growth rate of an aquatic heterotrophic bacterial community. [34] The method uses cell division, specifically septum formation, as a proxy for growth rate. [34] Cells are considered divided, when cavities between individual cells (invagination) are observed under epifluorescence microscopy. [34] FDC is based on the assumption that there relationship between the proportion of cells currently dividing and the growth rate in a bacterial community. [35]

Thymidine incorporation

Thymidine incorporation is one of the most extensively used methods to estimate bacterial growth. [36] Thymidine is a precursor for DNA, and DNA synthesis can be measured by tritiated thymidine incorporation into nucleic acids. [37] Thymidine incorporation measures growth based on rates of DNA synthesis, using the assumption that only growing cells can incorporate the radioactive thymidine to synthesize DNA. [38]

Weaknesses of this procedure include labeling of other molecules besides DNA when tritiated thymidine is added to a sample. [36] In cases of carbon limitation, thymidine may also be used as a carbon source instead of as a DNA precursor. [36] Results of thymidine incorporation experiments may be misleading when the proportion of thymidine incorporated into DNA compared to other molecules is not known. [36]

Leucine incorporation

Leucine incorporation is used as a measure of protein synthesis in aquatic bacteria communities. [39] Radio-labeled leucine is added to samples, and its accumulation into proteins, the hot trichloroacetic acid (CA)-insoluble parts of the cell is determined. [39] The samples are then collected on membrane filter. [39] Leucine protein is taken up by more than 50% of aquatic bacterial populations, and leucine incorporation can be used to estimate nitrogen utilization in the bacterial community. [39]

Marine seasonal succession dynamics

As bacterial populations have unique metabolisms and resource preferences, the use of high-resolution time-series analysis of bacterial compositions allows for the identification of patterns in seasonal bacterial succession. [40] Differences in bacterial community compositions give rise to particular permutations of interspecies bacterial interactions with photosynthetic plankton, protist grazers, and phages thereby impacting seasonality dynamics. Statistical methods used to verify patterns in population dynamics and composition are demonstrated to be replicable over some years, and environmental factors served as predictors of these temporal patterns. [41]

Seasonal succession in temperate regions

As seasonal successions of phytoplankton populations follow a consistent recurring pattern, bacterial dynamics and phytoplankton succession can be correlated. [40] In general, seasonal changes in bacterial composition follow changes in temperature and chlorophyll a, while nutrient availability limits bacterioplankton growth rates. [42] [43] [44] [45] [6] [46] During water column mixing in late autumn/winter, nutrients brought to the surface kicks start a distinct diatom spring bloom followed by dinoflagellates. [40] After the spring bloom, bacterial production and growth become elevated due to the release of Dissolved organic matter (DOM) from phytoplankton decay. [47] [48] In this early succession stage, members of the class Flavobacteria (Bacteroidetes) are typically the dominant components of the bacterial community. [49] [50] Genome analysis and meta-transcriptomics have uncovered the presence of bacteria containing multiple hydrolytic enzymes facilitating the degradation and assimilation of DOM. [51] [52] [53] [54] During spring blooms, some members of the Roseobacter clade (Alphaproteobacteria) and some Gammaproteobacteria are usually associated with DOM degradation. [48] [49] As temperatures increase and the nutrients from the spring bloom gets depleted, smaller phytoplankton and cyanobacteria grow in the now oligotrophic waters. [40]

As waters become stratified in summer, Roseobacter, SAR86 (Gammaproteobacteria), and SAR11 (Alphaproteobacteria) clades of bacteria increase in abundance. [55] [56] The frequently observed autumn diatom and dinoflagellate blooms are correlated with supplementary nutrient inputs and high-frequency sampling in the Baltic Sea found that in autumn, Actinomycetota generally increase followed by different autumn-specific Flavobacteria, SAR11, and Planctomycetota. [49]

In the Mediterranean Sea, deep winter mixing allows members of the SAR11 clade to achieve increased diversity as the oligotrophic populations that once dominated during the summer stratification die off slowly. [57] Among archaea in the Mediterranean Sea, Nitrososphaerota (formerly Thaumarchaeota) Marine Group I (MGI) and Euryarchaeota Marine Group II (MGII.B) populations became dominant in winter. [58] While in the Baltic Sea, winter mixing brings Campylobacterota and archaea populations to the surface from their deep habitat. [49]

Related Research Articles

<span class="mw-page-title-main">Flow cytometry</span> Lab technique in biology and chemistry

Flow cytometry (FC) is a technique used to detect and measure physical and chemical characteristics of a population of cells or particles.

<span class="mw-page-title-main">Hoechst stain</span> Fluorescent dye used to stain DNA

Hoechst stains are part of a family of blue fluorescent dyes used to stain DNA. These bis-benzimides were originally developed by Hoechst AG, which numbered all their compounds so that the dye Hoechst 33342 is the 33,342nd compound made by the company. There are three related Hoechst stains: Hoechst 33258, Hoechst 33342, and Hoechst 34580. The dyes Hoechst 33258 and Hoechst 33342 are the ones most commonly used and they have similar excitation–emission spectra.

<span class="mw-page-title-main">Acridine orange</span> Organic dye used in biochemistry

Acridine orange is an organic compound that serves as a nucleic acid-selective fluorescent dye with cationic properties useful for cell cycle determination. Acridine orange is cell-permeable, which allows the dye to interact with DNA by intercalation, or RNA via electrostatic attractions. When bound to DNA, acridine orange is very similar spectrally to an organic compound known as fluorescein. Acridine orange and fluorescein have a maximum excitation at 502nm and 525 nm (green). When acridine orange associates with RNA, the fluorescent dye experiences a maximum excitation shift from 525 nm (green) to 460 nm (blue). The shift in maximum excitation also produces a maximum emission of 650 nm (red). Acridine orange is able to withstand low pH environments, allowing the fluorescent dye to penetrate acidic organelles such as lysosomes and phagolysosomes that are membrane-bound organelles essential for acid hydrolysis or for producing products of phagocytosis of apoptotic cells. Acridine orange is used in epifluorescence microscopy and flow cytometry. The ability to penetrate the cell membranes of acidic organelles and cationic properties of acridine orange allows the dye to differentiate between various types of cells. The shift in maximum excitation and emission wavelengths provides a foundation to predict the wavelength at which the cells will stain.

<span class="mw-page-title-main">Picoplankton</span> Fraction of plankton between 0.2 and 2 μm

Picoplankton is the fraction of plankton composed by cells between 0.2 and 2 μm that can be either prokaryotic and eukaryotic phototrophs and heterotrophs:

Heterotrophic picoplankton is the fraction of plankton composed by cells between 0.2 and 2 μm that do not perform photosynthesis. They form an important component of many biogeochemical cycles.

<span class="mw-page-title-main">Microbial loop</span> Trophic pathway in marine microbial ecosystems

The microbial loop describes a trophic pathway where, in aquatic systems, dissolved organic carbon (DOC) is returned to higher trophic levels via its incorporation into bacterial biomass, and then coupled with the classic food chain formed by phytoplankton-zooplankton-nekton. In soil systems, the microbial loop refers to soil carbon. The term microbial loop was coined by Farooq Azam, Tom Fenchel et al. in 1983 to include the role played by bacteria in the carbon and nutrient cycles of the marine environment.

<span class="mw-page-title-main">Sea surface microlayer</span> Boundary layer where all exchange occurs between the atmosphere and the ocean

The sea surface microlayer (SML) is the boundary interface between the atmosphere and ocean, covering about 70% of Earth's surface. With an operationally defined thickness between 1 and 1,000 μm (1.0 mm), the SML has physicochemical and biological properties that are measurably distinct from underlying waters. Recent studies now indicate that the SML covers the ocean to a significant extent, and evidence shows that it is an aggregate-enriched biofilm environment with distinct microbial communities. Because of its unique position at the air-sea interface, the SML is central to a range of global marine biogeochemical and climate-related processes.

<span class="mw-page-title-main">Bacterioplankton</span> Bacterial component of the plankton that drifts in the water column

Bacterioplankton refers to the bacterial component of the plankton that drifts in the water column. The name comes from the Ancient Greek word πλανκτος, meaning "wanderer" or "drifter", and bacterium, a Latin term coined in the 19th century by Christian Gottfried Ehrenberg. They are found in both seawater and freshwater.

<span class="mw-page-title-main">Cytometry</span> Measurement of number and characteristics of cells

Cytometry is the measurement of number and characteristics of cells. Variables that can be measured by cytometric methods include cell size, cell count, cell morphology, cell cycle phase, DNA content, and the existence or absence of specific proteins on the cell surface or in the cytoplasm. Cytometry is used to characterize and count blood cells in common blood tests such as the complete blood count. In a similar fashion, cytometry is also used in cell biology research and in medical diagnostics to characterize cells in a wide range of applications associated with diseases such as cancer and AIDS.

Cell counting is any of various methods for the counting or similar quantification of cells in the life sciences, including medical diagnosis and treatment. It is an important subset of cytometry, with applications in research and clinical practice. For example, the complete blood count can help a physician to determine why a patient feels unwell and what to do to help. Cell counts within liquid media are usually expressed as a number of cells per unit of volume, thus expressing a concentration.

Rudolf Amann is a German biochemistriest and microbiologist. He is director of Max Planck Institute for Marine Microbiology (MPIMM) in Bremen and Professor for Microbial Ecology at the University of Bremen.

<span class="mw-page-title-main">Mycoplankton</span> Fungal members of the plankton communities of aquatic ecosystems

Mycoplankton are saprotrophic members of the plankton communities of marine and freshwater ecosystems. They are composed of filamentous free-living fungi and yeasts that are associated with planktonic particles or phytoplankton. Similar to bacterioplankton, these aquatic fungi play a significant role in heterotrophicmineralization and nutrient cycling. Mycoplankton can be up to 20 mm in diameter and over 50 mm in length.

<span class="mw-page-title-main">Kill the Winner hypothesis</span> Microbiological population model hypothesis

The "Kill the Winner" hypothesis (KtW) is an ecological model of population growth involving prokaryotes, viruses and protozoans that links trophic interactions to biogeochemistry. The model is related to the Lotka–Volterra equations. It assumes that prokaryotes adopt one of two strategies when competing for limited resources: priority is either given to population growth ("winners") or survival ("defenders"). As "winners" become more abundant and active in their environment, their contact with host-specific viruses increases, making them more susceptible to viral infection and lysis. Thus, viruses moderate the population size of "winners" and allow multiple species to coexist. Current understanding of KtW primarily stems from studies of lytic viruses and their host populations.

Polaribacter is a genus in the family Flavobacteriaceae. They are gram-negative, aerobic bacteria that can be heterotrophic, psychrophilic or mesophilic. Most species are non-motile and species range from ovoid to rod-shaped. Polaribacter forms yellow- to orange-pigmented colonies. They have been mostly adapted to cool marine ecosystems, and their optimal growth range is at a temperature between 10 and 32 °C and at a pH of 7.0 to 8.0. They are oxidase and catalase-positive and are able to grow using carbohydrates, amino acids, and organic acids.

<span class="mw-page-title-main">Viral shunt</span>

The viral shunt is a mechanism that prevents marine microbial particulate organic matter (POM) from migrating up trophic levels by recycling them into dissolved organic matter (DOM), which can be readily taken up by microorganisms. The DOM recycled by the viral shunt pathway is comparable to the amount generated by the other main sources of marine DOM.

William Li is a Canadian biological oceanographer who did research on marine picoplankton, marine macroecology, ocean surveys of plankton from measurements of flow cytometry, and detection of multi-annual ecological change in marine phytoplankton.

<span class="mw-page-title-main">Marine viruses</span> Viruses found in marine environments

Marine viruses are defined by their habitat as viruses that are found in marine environments, that is, in the saltwater of seas or oceans or the brackish water of coastal estuaries. Viruses are small infectious agents that can only replicate inside the living cells of a host organism, because they need the replication machinery of the host to do so. They can infect all types of life forms, from animals and plants to microorganisms, including bacteria and archaea.

Transparent exopolymer particles (TEPs) are extracellular acidic polysaccharides produced by phytoplankton and bacteria in saltwater, freshwater, and wastewater. They are incredibly abundant and play a significant role in biogeochemical cycling of carbon and other elements in water. Through this, they also play a role in the structure of food webs and trophic levels. TEP production and overall concentration has been observed to be higher in the Pacific Ocean compared to the Atlantic, and is more related to solar radiation in the Pacific. TEP concentration has been found to decrease with depth, having the highest concentration at the surface, especially associated with the SML, either by upward flux or sea surface production. Chlorophyll a has been found to be the best indicator of TEP concentration, rather than heterotrophic grazing abundance, further emphasizing the role of phytoplankton in TEP production. TEP concentration is especially enhanced by haptophyte phytoplanktonic dominance, solar radiation exposure, and close proximity to sea ice. TEPs also do not seem to show any diel cycles. High concentrations of TEPs in the surface ocean slow the sinking of solid particle aggregations, prolonging pelagic residence time. TEPs may provide an upward flux of materials such as bacteria, phytoplankton, carbon, and trace nutrients. High TEP concentrations were found under arctic sea ice, probably released by sympagic algae. TEP is efficiently recycled in the ocean, as heterotrophic grazers such as zooplankton and protists consume TEP and produce new TEP precursors to be reused, further emphasizing the importance of TEPs in marine carbon cycling. TEP abundance tends to be higher in coastal, shallow waters compared to deeper, oceanic waters. Diatom-dominated phytoplankton colonies produce larger, and stickier, TEPs, which may indicate that TEP size distribution and composition may be a useful tool in determining aggregate planktonic community structure.

Clarice Morel Yentsch is a scientist, author, education and museum professional, and community benefactor. As a scientist, she pioneered the use of flow cytometry to investigate marine phytoplankton and co-founded Bigelow Laboratory for Ocean Sciences.

Lone Gram is Danish microbiologist known for her work in bacterial physiology, microbial communication, and biochemicals that originate from bacterial cultures. She is an elected member of the Royal Danish Academy of Sciences and Letters and has received the Order of the Dannebrog.

References

  1. Long RA, Azam F (2001-12-05). "Microscale patchiness of bacterioplankton assemblage richness in seawater". Aquatic Microbial Ecology. 26 (2): 103–113. doi: 10.3354/ame026103 .
  2. He J, Zhang F, Lin L, Ma Y, Chen J (2012). "Bacterioplankton and picophytoplankton abundance, biomass, and distribution in the Western Canada Basin during summer 2008". Deep Sea Research Part II: Topical Studies in Oceanography. 81–84: 36–45. Bibcode:2012DSRII..81...36H. doi:10.1016/j.dsr2.2012.08.018.
  3. Wei C, Bao S, Zhu X, Huang X (2008). "Spatio-temporal variations of the bacterioplankton community composition in Chaohu Lake, China". Progress in Natural Science. 18 (9): 1115–1122. doi: 10.1016/j.pnsc.2008.04.005 .
  4. López-Flores R, Boix D, Badosa A, Brucet S, Quintana XD (2009). "Environmental factors affecting bacterioplankton and phytoplankton dynamics in confined Mediterranean salt marshes (NE Spain)". Journal of Experimental Marine Biology and Ecology. 369 (2): 118–126. doi:10.1016/j.jembe.2008.11.003.
  5. Medvinsky, Alexander B.; Adamovich, Boris V.; Aliev, Rubin R.; Chakraborty, Amit; Lukyanova, Elena V.; Mikheyeva, Tamara M.; Nikitina, Ljudmila V.; Nurieva, Nailya I.; Rusakov, Alexey V. (2017). "Temperature as a factor affecting fluctuations and predictability of the abundance of lake bacterioplankton". Ecological Complexity. 32: 90–98. doi:10.1016/j.ecocom.2017.10.002.
  6. 1 2 Andersson AF, Riemann L, Bertilsson S (February 2010). "Pyrosequencing reveals contrasting seasonal dynamics of taxa within Baltic Sea bacterioplankton communities". The ISME Journal. 4 (2): 171–81. doi: 10.1038/ismej.2009.108 . PMID   19829318.
  7. Ghiglione JF, Murray AE (March 2012). "Pronounced summer to winter differences and higher wintertime richness in coastal Antarctic marine bacterioplankton". Environmental Microbiology. 14 (3): 617–29. doi:10.1111/j.1462-2920.2011.02601.x. PMID   22003839.
  8. Straza TR, Ducklow HW, Murray AE, Kirchman DL (2010-11-01). "Abundance and single-cell activity of bacterial groups in Antarctic coastal waters". Limnology and Oceanography. 55 (6): 2526–2536. Bibcode:2010LimOc..55.2526S. doi: 10.4319/lo.2010.55.6.2526 . S2CID   86616866.
  9. Currie DJ, Kalff J (March 1984). "The relative importance of bacterioplankton and phytoplankton in phosphorus uptake in freshwater1". Limnology and Oceanography. 29 (2): 311–321. Bibcode:1984LimOc..29..311C. doi:10.4319/lo.1984.29.2.0311.
  10. Lindström ES (December 2001). "Investigating Influential Factors on Bacterioplankton Community Composition: Results from a Field Study of Five Mesotrophic Lakes". Microbial Ecology. 42 (4): 598–605. doi:10.1007/s00248-001-0031-y. PMID   12024242. S2CID   22656746.
  11. Cotner JB, Biddanda BA (2002-03-01). "Small Players, Large Role: Microbial Influence on Biogeochemical Processes in Pelagic Aquatic Ecosystems". Ecosystems. 5 (2): 105–121. CiteSeerX   10.1.1.484.7337 . doi:10.1007/s10021-001-0059-3. S2CID   39074312.
  12. Harnisz M (March 2013). "Total resistance of native bacteria as an indicator of changes in the water environment". Environmental Pollution. 174: 85–92. doi:10.1016/j.envpol.2012.11.005. PMID   23246751.
  13. Chen, Xinxin; Wang, Kai; Guo, Annan; Dong, Zhiying; Zhao, Qunfen; Qian, Jie; Zhang, Demin (2016). "Excess phosphate loading shifts bacterioplankton community composition in oligotrophic coastal water microcosms over time". Journal of Experimental Marine Biology and Ecology. 483: 139–146. doi:10.1016/j.jembe.2016.07.009.
  14. Dai, Wenfang; Zhang, Jinjie; Tu, Qichao; Deng, Ye; Qiu, Qiongfen; Xiong, Jinbo (2017). "Bacterioplankton assembly and interspecies interaction indicating increasing coastal eutrophication". Chemosphere. 177: 317–325. Bibcode:2017Chmsp.177..317D. doi:10.1016/j.chemosphere.2017.03.034. PMID   28319885.
  15. Urakawa, Hidetoshi; Bernhard, Anne E. (2017). "Wetland management using microbial indicators". Ecological Engineering. 108: 456–476. doi: 10.1016/j.ecoleng.2017.07.022 .
  16. Haukka K, Kolmonen E, Hyder R, Hietala J, Vakkilainen K, Kairesalo T, Haario H, Sivonen K (February 2006). "Effect of nutrient loading on bacterioplankton community composition in lake mesocosms". Microbial Ecology. 51 (2): 137–46. doi:10.1007/s00248-005-0049-7. PMID   16435168. S2CID   35399139.
  17. Zhang D, Wang X, Xiong J, Zhu J, Wang Y, Zhao Q, Chen H, Guo A, Wu J (2014). "Bacterioplankton assemblages as biological indicators of shrimp health status". Ecological Indicators. 38: 218–224. doi:10.1016/j.ecolind.2013.11.002.
  18. Tanious FA, Veal JM, Buczak H, Ratmeyer LS, Wilson WD (1992-03-31). "DAPI (4',6-diamidino-2-phenylindole) binds differently to DNA and RNA: minor-groove binding at AT sites and intercalation at AU sites". Biochemistry. 31 (12): 3103–3112. doi:10.1021/bi00127a010. PMID   1372825.
  19. Gonzalez K, Mcvey S, Cunnick J, Udovichenko IP, Takemoto DJ (1995). "Acridine orange differential staining of total DNA and RNA in normal and galactosemic lens epithelial cells in culture using flow cytometry". Current Eye Research. 14 (4): 269–273. doi:10.3109/02713689509033525. PMID   7541739.
  20. Noble RT, Fuhrman JA (1998-02-13). "Use of SYBR Green I for rapid epifluorescence counts of marine viruses and bacteria". Aquatic Microbial Ecology. 14 (2): 113–118. doi: 10.3354/ame014113 .
  21. Marie D, Vaulot D, Partensky F (May 1996). "Application of the novel nucleic acid dyes YOYO-1, YO-PRO-1, and PicoGreen for flow cytometric analysis of marine prokaryotes". Applied and Environmental Microbiology. 62 (5): 1649–55. Bibcode:1996ApEnM..62.1649M. doi:10.1128/AEM.62.5.1649-1655.1996. PMC   167939 . PMID   8633863.
  22. 1 2 3 4 5 6 Muthukrishnan T, Govender A, Dobretsov S, Abed RM (2017-01-08). "Evaluating the Reliability of Counting Bacteria Using Epifluorescence Microscopy". Journal of Marine Science and Engineering. 5 (1): 4. doi: 10.3390/jmse5010004 .
  23. 1 2 O'Connor JT, O'Connor T, Twait R (2009). Water Treatment Plant Performance Evaluations and Operations. John Wiley & Sons, Inc. pp. 193–198. doi:10.1002/9780470431474.app1. ISBN   9780470431474.
  24. 1 2 3 4 5 6 7 8 9 Gasol, Josep M.; Giorgio, Paul A. del (2000-06-30). "Using flow cytometry for counting natural planktonic bacteria and understanding the structure of planktonic bacterial communities". Scientia Marina. 64 (2): 197–224. doi: 10.3989/scimar.2000.64n2197 . hdl: 10261/5293 . ISSN   1886-8134.
  25. Giorgio, Paul A. del; Bird, David F.; Prairie, Yves T.; Planas, Dolors (1996-06-01). "Flow cytometric determination of bacterial abundance in lake plankton with the green nucleic acid stain SYTO 13". Limnology and Oceanography. 41 (4): 783–789. Bibcode:1996LimOc..41..783G. doi: 10.4319/lo.1996.41.4.0783 . ISSN   1939-5590.
  26. 1 2 3 Sieracki, Michael E.; Haugen, Elin M.; Cucci, Terry L. (1995-08-01). "Overestimation of heterotrophic bacteria in the Sargasso Sea: direct evidence by flow and imaging cytometry". Deep Sea Research Part I: Oceanographic Research Papers. 42 (8): 1399–1409. Bibcode:1995DSRI...42.1399S. doi:10.1016/0967-0637(95)00055-B. ISSN   0967-0637.
  27. 1 2 Zubkov MV, Burkill PH, Topping JN (2007-01-01). "Flow cytometric enumeration of DNA-stained oceanic planktonic protists". Journal of Plankton Research. 29 (1): 79–86. doi: 10.1093/plankt/fbl059 .
  28. WATERBURY, JOHN B.; WATSON, STANLEY W.; GUILLARD, ROBERT R. L.; BRAND, LARRY E. (January 1979). "Widespread occurrence of a unicellular, marine, planktonic, cyanobacterium". Nature. 277 (5694): 293–294. Bibcode:1979Natur.277..293W. doi:10.1038/277293a0. ISSN   1476-4687. S2CID   4270426.
  29. Chisholm, Sallie W.; Frankel, Sheila L.; Goericke, Ralf; Olson, Robert J.; Palenik, Brian; Waterbury, John B.; West-Johnsrud, Lisa; Zettler, Erik R. (1992-02-01). "Prochlorococcus marinus nov. gen. nov. sp.: an oxyphototrophic marine prokaryote containing divinyl chlorophyll a and b". Archives of Microbiology. 157 (3): 297–300. doi:10.1007/BF00245165. ISSN   0302-8933. S2CID   32682912.
  30. Chisholm, Sallie W.; Olson, Robert J.; Zettler, Erik R.; Goericke, Ralf; Waterbury, John B.; Welschmeyer, Nicholas A. (July 1988). "A novel free-living prochlorophyte abundant in the oceanic euphotic zone". Nature. 334 (6180): 340–343. Bibcode:1988Natur.334..340C. doi:10.1038/334340a0. ISSN   1476-4687. S2CID   4373102.
  31. 1 2 3 4 Marie D, Partensky F, Jacquet S, Vaulot D (January 1997). "Enumeration and Cell Cycle Analysis of Natural Populations of Marine Picoplankton by Flow Cytometry Using the Nucleic Acid Stain SYBR Green I". Applied and Environmental Microbiology. 63 (1): 186–93. Bibcode:1997ApEnM..63..186M. doi:10.1128/AEM.63.1.186-193.1997. PMC   1389098 . PMID   16535483.
  32. Giorgio PA, Bird DF, Prairie YT, Planas D (June 1996). "Flow cytometric determination of bacterial abundance in lake plankton with the green nucleic acid stain SYTO 13". Limnology and Oceanography. 41 (4): 783–789. Bibcode:1996LimOc..41..783G. doi: 10.4319/lo.1996.41.4.0783 .
  33. Rice J, Sleigh MA, Burkill PH, Tarran GA, O'connor CD, Zubkov MV (March 1997). "Flow Cytometric Analysis of Characteristics of Hybridization of Species-Specific Fluorescent Oligonucleotide Probes to rRNA of Marine Nanoflagellates". Applied and Environmental Microbiology. 63 (3): 938–44. Bibcode:1997ApEnM..63..938R. doi:10.1128/AEM.63.3.938-944.1997. PMC   1389123 . PMID   16535558.
  34. 1 2 3 Hagström A, Larsson U, Hörstedt P, Normark S (May 1979). "Frequency of dividing cells, a new approach to the determination of bacterial growth rates in aquatic environments". Applied and Environmental Microbiology. 37 (5): 805–12. Bibcode:1979ApEnM..37..805H. doi:10.1128/AEM.37.5.805-812.1979. PMC   243306 . PMID   16345378.
  35. Newell SY, Christian RR (July 1981). "Frequency of dividing cells as an estimator of bacterial productivity". Applied and Environmental Microbiology. 42 (1): 23–31. Bibcode:1981ApEnM..42...23N. doi:10.1128/AEM.42.1.23-31.1981. PMC   243955 . PMID   16345812.
  36. 1 2 3 4 Servais P, Martinez J, Billen G, Vives-Rego J (August 1987). "Determining [H]Thymidine Incorporation into Bacterioplankton DNA: Improvement of the Method by DNase Treatment". Applied and Environmental Microbiology. 53 (8): 1977–9. Bibcode:1987ApEnM..53.1977S. doi:10.1128/AEM.53.8.1977-1979.1987. PMC   204039 . PMID   16347424.
  37. Bell R, Ahlgren G, Ahlgren I (June 1983). "Estimating Bacterioplankton Production by Measuring [3H]thymidine Incorporation in a Eutrophic Swedish Lake". Applied and Environmental Microbiology. 45 (6): 1709–1721. Bibcode:1983ApEnM..45.1709B. doi:10.1128/AEM.45.6.1709-1721.1983. PMC   242528 . PMID   16346304.
  38. Fuhrman J, Azam F (July 1980). "Bacterioplankton secondary production estimates for coastal waters of British Columbia, Canada, Antarctica, and California, USA". Applied and Environmental Microbiology. 39 (6): 1085–1095. doi: 10.1128/AEM.39.6.1085-1095.1980 . PMC   291487 . PMID   16345577.
  39. 1 2 3 4 Kirchman D, K'nees E, Hodson R (March 1985). "Leucine incorporation and its potential as a measure of protein synthesis by bacteria in natural aquatic systems". Applied and Environmental Microbiology. 49 (3): 599–607. Bibcode:1985ApEnM..49..599K. doi:10.1128/AEM.49.3.599-607.1985. PMC   373556 . PMID   3994368.
  40. 1 2 3 4 Bunse C, Pinhassi J (June 2017). "Marine Bacterioplankton Seasonal Succession Dynamics". Trends in Microbiology. 25 (6): 494–505. doi: 10.1016/j.tim.2016.12.013 . PMID   28108182.
  41. Fuhrman JA, Hewson I, Schwalbach MS, Steele JA, Brown MV, Naeem S (August 2006). "Annually reoccurring bacterial communities are predictable from ocean conditions". Proceedings of the National Academy of Sciences of the United States of America. 103 (35): 13104–9. Bibcode:2006PNAS..10313104F. doi: 10.1073/pnas.0602399103 . PMC   1559760 . PMID   16938845.
  42. Pinhassi J, Hagström Å (2000-06-15). "Seasonal succession in marine bacterioplankton". Aquatic Microbial Ecology. 21 (3): 245–256. doi: 10.3354/ame021245 .
  43. Pinhassi J, Gómez-Consarnau L, Alonso-Sáez L, Sala MM, Vidal M, Pedrós-Alió C, Gasol JM (2006-10-10). "Seasonal changes in bacterioplankton nutrient limitation and their effects on bacterial community composition in the NW Mediterranean Sea". Aquatic Microbial Ecology. 44 (3): 241–252. doi: 10.3354/ame044241 . hdl: 10261/27229 .
  44. Sapp M, Wichels A, Wiltshire KH, Gerdts G (March 2007). "Bacterial community dynamics during the winter-spring transition in the North Sea". FEMS Microbiology Ecology. 59 (3): 622–37. doi: 10.1111/j.1574-6941.2006.00238.x . PMID   17381518.
  45. Gilbert JA, Field D, Swift P, Newbold L, Oliver A, Smyth T, Somerfield PJ, Huse S, Joint I (December 2009). "The seasonal structure of microbial communities in the Western English Channel" (PDF). Environmental Microbiology. 11 (12): 3132–9. doi:10.1111/j.1462-2920.2009.02017.x. hdl: 1912/3133 . PMID   19659500.
  46. Gilbert JA, Steele JA, Caporaso JG, Steinbrück L, Reeder J, Temperton B, Huse S, McHardy AC, Knight R, Joint I, Somerfield P, Fuhrman JA, Field D (February 2012). "Defining seasonal marine microbial community dynamics". The ISME Journal. 6 (2): 298–308. doi:10.1038/ismej.2011.107. PMC   3260500 . PMID   21850055.
  47. Riemann L, Steward GF, Azam F (February 2000). "Dynamics of bacterial community composition and activity during a mesocosm diatom bloom". Applied and Environmental Microbiology. 66 (2): 578–87. Bibcode:2000ApEnM..66..578R. doi:10.1128/AEM.66.2.578-587.2000. PMC   91866 . PMID   10653721.
  48. 1 2 Buchan A, LeCleir GR, Gulvik CA, González JM (October 2014). "Master recyclers: features and functions of bacteria associated with phytoplankton blooms". Nature Reviews. Microbiology. 12 (10): 686–98. doi:10.1038/nrmicro3326. PMID   25134618. S2CID   26684717.
  49. 1 2 3 4 Lindh MV, Sjöstedt J, Andersson AF, Baltar F, Hugerth LW, Lundin D, Muthusamy S, Legrand C, Pinhassi J (July 2015). "Disentangling seasonal bacterioplankton population dynamics by high-frequency sampling". Environmental Microbiology. 17 (7): 2459–76. doi:10.1111/1462-2920.12720. PMID   25403576.
  50. Alderkamp A, Sintes E, Herndl GJ (2006-12-21). "Abundance and activity of major groups of prokaryotic plankton in the coastal North Sea during spring and summer". Aquatic Microbial Ecology. 45 (3): 237–246. doi: 10.3354/ame045237 .
  51. Fernández-Gómez B, Richter M, Schüler M, Pinhassi J, Acinas SG, González JM, Pedrós-Alió C (May 2013). "Ecology of marine Bacteroidetes: a comparative genomics approach". The ISME Journal. 7 (5): 1026–37. doi:10.1038/ismej.2012.169. PMC   3635232 . PMID   23303374.
  52. Teeling H, Fuchs BM, Becher D, Klockow C, Gardebrecht A, Bennke CM, Kassabgy M, Huang S, Mann AJ, Waldmann J, Weber M, Klindworth A, Otto A, Lange J, Bernhardt J, Reinsch C, Hecker M, Peplies J, Bockelmann FD, Callies U, Gerdts G, Wichels A, Wiltshire KH, Glöckner FO, Schweder T, Amann R (May 2012). "Substrate-controlled succession of marine bacterioplankton populations induced by a phytoplankton bloom". Science. 336 (6081): 608–11. Bibcode:2012Sci...336..608T. doi:10.1126/science.1218344. PMID   22556258. S2CID   29249533.
  53. Teeling H, Fuchs BM, Bennke CM, Krüger K, Chafee M, Kappelmann L, Reintjes G, Waldmann J, Quast C, Glöckner FO, Lucas J, Wichels A, Gerdts G, Wiltshire KH, Amann RI (April 2016). "Recurring patterns in bacterioplankton dynamics during coastal spring algae blooms". eLife. 5: e11888. doi: 10.7554/eLife.11888 . PMC   4829426 . PMID   27054497.
  54. Taylor JD, Cottingham SD, Billinge J, Cunliffe M (January 2014). "Seasonal microbial community dynamics correlate with phytoplankton-derived polysaccharides in surface coastal waters". The ISME Journal. 8 (1): 245–8. doi:10.1038/ismej.2013.178. PMC   3869024 . PMID   24132076.
  55. Agawin NS, Duarte CM, Agustí S (1998-09-03). "Growth and abundance of Synechococcus sp. in a Mediterranean Bay: seasonality and relationship with temperature". Marine Ecology Progress Series. 170: 45–53. Bibcode:1998MEPS..170...45A. doi: 10.3354/meps170045 . hdl: 10261/149462 .
  56. Alonso-Sáez L, Balagué V, Sà EL, Sánchez O, González JM, Pinhassi J, Massana R, Pernthaler J, Pedrós-Alió C, Gasol JM (April 2007). "Seasonality in bacterial diversity in north-west Mediterranean coastal waters: assessment through clone libraries, fingerprinting and FISH". FEMS Microbiology Ecology. 60 (1): 98–112. doi: 10.1111/j.1574-6941.2006.00276.x . PMID   17250750.
  57. Salter I, Galand PE, Fagervold SK, Lebaron P, Obernosterer I, Oliver MJ, Suzuki MT, Tricoire C (February 2015). "Seasonal dynamics of active SAR11 ecotypes in the oligotrophic Northwest Mediterranean Sea". The ISME Journal. 9 (2): 347–60. doi:10.1038/ismej.2014.129. PMC   4303628 . PMID   25238399.
  58. Hugoni M, Taib N, Debroas D, Domaizon I, Jouan Dufournel I, Bronner G, Salter I, Agogué H, Mary I, Galand PE (April 2013). "Structure of the rare archaeal biosphere and seasonal dynamics of active ecotypes in surface coastal waters". Proceedings of the National Academy of Sciences of the United States of America. 110 (15): 6004–9. Bibcode:2013PNAS..110.6004H. doi: 10.1073/pnas.1216863110 . PMC   3625260 . PMID   23536290.