Related Research Articles

Network topology is the arrangement of the elements of a communication network. Network topology can be used to define or describe the arrangement of various types of telecommunication networks, including command and control radio networks, industrial fieldbusses and computer networks.
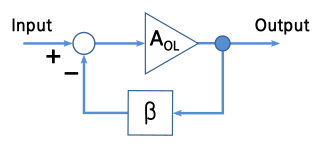
A negative-feedback amplifier is an electronic amplifier that subtracts a fraction of its output from its input, so that negative feedback opposes the original signal. The applied negative feedback can improve its performance and reduces sensitivity to parameter variations due to manufacturing or environment. Because of these advantages, many amplifiers and control systems use negative feedback.
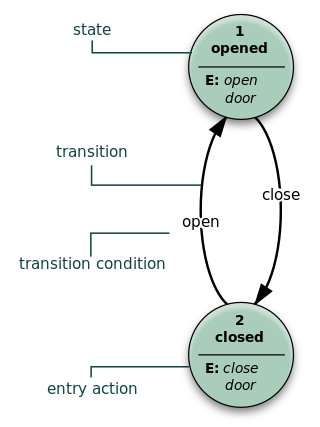
A state diagram is a type of diagram used in computer science and related fields to describe the behavior of systems. State diagrams require that the system described is composed of a finite number of states; sometimes, this is indeed the case, while at other times this is a reasonable abstraction. Many forms of state diagrams exist, which differ slightly and have different semantics.

A system context diagram in engineering is a diagram that defines the boundary between the system, or part of a system, and its environment, showing the entities that interact with it. This diagram is a high level view of a system. It is similar to a block diagram.

Graph drawing is an area of mathematics and computer science combining methods from geometric graph theory and information visualization to derive two-dimensional depictions of graphs arising from applications such as social network analysis, cartography, linguistics, and bioinformatics.
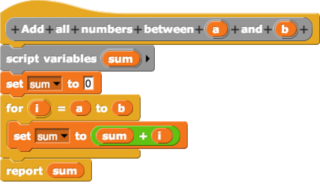
In computing, a visual programming language or block coding is a programming language that lets users create programs by manipulating program elements graphically rather than by specifying them textually. A VPL allows programming with visual expressions, spatial arrangements of text and graphic symbols, used either as elements of syntax or secondary notation. For example, many VPLs are based on the idea of "boxes and arrows", where boxes or other screen objects are treated as entities, connected by arrows, lines or arcs which represent relations.
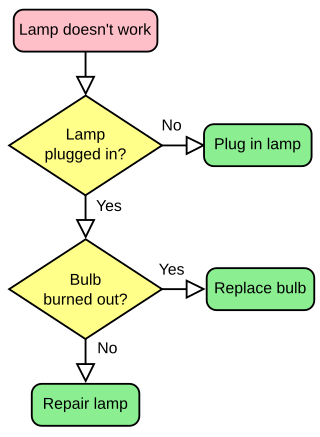
A flowchart is a type of diagram that represents a workflow or process. A flowchart can also be defined as a diagrammatic representation of an algorithm, a step-by-step approach to solving a task.
In computer science, a binary decision diagram (BDD) or branching program is a data structure that is used to represent a Boolean function. On a more abstract level, BDDs can be considered as a compressed representation of sets or relations. Unlike other compressed representations, operations are performed directly on the compressed representation, i.e. without decompression.
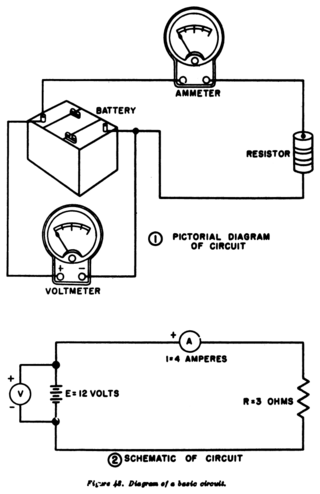
A circuit diagram is a graphical representation of an electrical circuit. A pictorial circuit diagram uses simple images of components, while a schematic diagram shows the components and interconnections of the circuit using standardized symbolic representations. The presentation of the interconnections between circuit components in the schematic diagram does not necessarily correspond to the physical arrangements in the finished device.

In power engineering, a single-line diagram (SLD), also sometimes called one-line diagram, is a simplest symbolic representation of an electric power system. A single line in the diagram typically corresponds to more than one physical conductor: in a direct current system the line includes the supply and return paths, in a three-phase system the line represents all three phases.
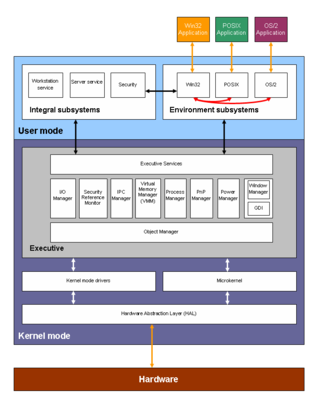
A block diagram is a diagram of a system in which the principal parts or functions are represented by blocks connected by lines that show the relationships of the blocks. They are heavily used in engineering in hardware design, electronic design, software design, and process flow diagrams.
A data-flow diagram is a way of representing a flow of data through a process or a system. The DFD also provides information about the outputs and inputs of each entity and the process itself. A data-flow diagram has no control flow — there are no decision rules and no loops. Specific operations based on the data can be represented by a flowchart.

Electronic-hydraulic analogies are the representation of electronic circuits by hydraulic circuits. Since electric current is invisible and the processes in play in electronics are often difficult to demonstrate, the various electronic components are represented by hydraulic equivalents. Electricity was originally understood to be a kind of fluid, and the names of certain electric quantities are derived from hydraulic equivalents.
The evaporating cloud is one of the six thinking processes in the theory of constraints (TOC). The evaporating cloud (EC) – also referred to in the literature as "the cloud", or as a "conflict resolution diagram" – is a logical diagram representing a problem that has no obvious satisfactory solution.
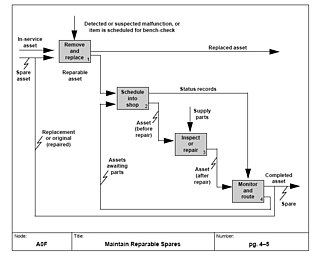
IDEF0, a compound acronym, is a function modeling methodology for describing manufacturing functions, which offers a functional modeling language for the analysis, development, reengineering and integration of information systems, business processes or software engineering analysis.
In computer programming, flow-based programming (FBP) is a programming paradigm that defines applications as networks of black box processes, which exchange data across predefined connections by message passing, where the connections are specified externally to the processes. These black box processes can be reconnected endlessly to form different applications without having to be changed internally. FBP is thus naturally component-oriented.

Diagrammatic reasoning is reasoning by means of visual representations. The study of diagrammatic reasoning is about the understanding of concepts and ideas, visualized with the use of diagrams and imagery instead of by linguistic or algebraic means.
A signal-flow graph or signal-flowgraph (SFG), invented by Claude Shannon, but often called a Mason graph after Samuel Jefferson Mason who coined the term, is a specialized flow graph, a directed graph in which nodes represent system variables, and branches represent functional connections between pairs of nodes. Thus, signal-flow graph theory builds on that of directed graphs, which includes as well that of oriented graphs. This mathematical theory of digraphs exists, of course, quite apart from its applications.
The circuit topology of an electronic circuit is the form taken by the network of interconnections of the circuit components. Different specific values or ratings of the components are regarded as being the same topology. Topology is not concerned with the physical layout of components in a circuit, nor with their positions on a circuit diagram; similarly to the mathematical concept of topology, it is only concerned with what connections exist between the components. There may be numerous physical layouts and circuit diagrams that all amount to the same topology.

In electrical circuit theory, a port is a pair of terminals connecting an electrical network or circuit to an external circuit, as a point of entry or exit for electrical energy. A port consists of two nodes (terminals) connected to an outside circuit which meets the port condition – the currents flowing into the two nodes must be equal and opposite.
References
- ↑ Raymond, Eric (1996). The New Hacker's Dictionary. The MIT Press. ISBN 978-0262680929.
- ↑ Daniel Dennett. "Things about Things". Chapter 9, p. 138 in: Joao Branquinho, editor. "The Foundations of Cognitive Science". 2001. quote: "controversy has raged about the right way to draw the connecting boxes that compose the flow charts -- the "boxology" -- ..."
- ↑ Richard Menary, editor. "Radical Enactivism". p. 34. quote: "flowchart boxology, of the sort inspired by a traditional input-output functionalism."
- ↑ Terence Horgan; Terry Horgan; John Tienson. "Connectionism and the Philosophy of Psychology". 1996. p. 22. quote: "In terms of familiar flow-chart analyses ("boxology", as Cummins (1983) puts it), one adds a lower sublevel by adding more interconnected boxes ... either between existing boxes or within them."