California's 8th congressional district

Last updated

California's 8th congressional district
California's 8th congressional district (since 2023).svg
California's 8th congressional district
Interactive map of district boundaries since 2023 (Used in the 2022 elections)
Representative
  John Garamendi
DWalnut Grove
Population (2022)748,189
Median household
income
$91,501 [1]
Ethnicity
Cook PVI D+26 [2]

California's 8th congressional district is a congressional district in the U.S. state of California. As of 2023, Democrat John Garamendi represents the district. Currently, the 8th district includes parts of the Bay Area counties of Contra Costa County and Solano County, including the cities of Vallejo, Fairfield, Richmond and parts of Martinez.

Contents


Competitiveness

Before the 2011 redistricting, the 8th district was a Democratic stronghold. It gave John Kerry his best performance in California in 2004, backing the Democrat with 84.2% of the vote. Barack Obama continued on this trend in 2008 when he received 85.22% of the vote in the district while John McCain received 12.38%.

The 8th district from 2013-2023 was located in a politically conservative region of the state with a "Strongly Republican" Cook Partisan Voting Index of R+10. The Cook Political Report ranked it the 87th most Republican-leaning congressional district in the United States. [3]

In the 2012 election, the first after the state's adoption of top-two primaries, the 8th district was one of only two in California where two Republicans faced each other in a runoff election. [4] In 2018, it was the only such California district. [5]

Election results from statewide races

YearOfficeWinnerTally
1992 President Clinton 75.6 – 15.9%
Senator Boxer 79.1 – 16.3%
Senator Feinstein 82.4 – 14.0%
1994 Governor [6] Brown 72.1 – 24.8%
Senator [7] Feinstein 80.7 – 13.7%
1996 President [8] Clinton 66.0 – 18.0%
1998 Governor [9] Davis 81.8 – 13.2%
Senator [10] Boxer 78.0 – 19.2%
2000 President [11] Gore 76.7 – 14.6%
Senator [12] Feinstein 72.6 – 14.1%
2002 Governor [13] Davis 66.7 – 13.9%
2003 Recall [14] [15] No81.4 – 18.6%
Bustamante 64.7 – 17.8%
2004 President [16] Kerry 84.2 – 14.0%
Senator [17] Boxer 83.7 – 11.7%
2006 Governor [18] Angelides 64.3 – 27.9%
Senator [19] Feinstein 80.4 – 7.7%
2008 President [20] Obama 85.2 – 12.4%
2010 Governor Brown 80.0 – 16.4%
Senator Boxer 81.3 – 14.7%
2012 President Romney 55.6 – 41.7%
2014 Governor [21] Kashkari 62.3 – 37.7%
2016 President Trump 54.7 – 39.6%
Senator [22] Harris 55.1 – 44.9%
2018 Governor [23] Cox 59.8 – 40.2%
Senator [24] de Leon 54.3 – 45.7%
2020 President Trump 54 – 43.6%
2021 Recall [25] Yes60.2 – 39.8%
2022 Governor [26] Newsom 73.9 – 26.1%
Senator Padilla 75.4 – 24.6%

Composition

#CountySeatPopulation
13 Contra Costa Martinez 1,161,413
95 Solano Fairfield 451,716

As of 2023, California's 8th congressional district was significantly changed, now being located between the Sacramento and San Joaquin Valleys. It encompasses part of Contra Costa and Solano Counties.

Contra Costa County is split between this district and the 10th district. They are partitioned by Grizzly Peak Blvd, Seaview Trail, Camino Pablo, Bear Creek Rd, San Pablo Creek, Bear Creek, Brianes Reservoir, Burlington Northern Santa Fe, Highway 4, Alhambra Ave, Pacheco Blvd, Grandview Ave, Central Ave, Imhoff Dr, Bares Ave, Mount Diablo Creek, Union Pacific, Contra Costa Canal, 4WD Rd, Bailey Rd, James Donlon Blvd, Cambridge Dr, Reseda Way, S Royal links Cir, Carpinteria Dr, Barmouth Dr, Hillcrest Ave, Highway 4, and Highway 160. The 8th district takes in the north side of the cities of Antioch and Martinez, the cities of Pittsburg, Richmond, San Pablo, El Cerrito, Pinole, and Hercules.

Solano County is split between this district and the 4th district. They are partitioned by Soda Springs Rd, Union Pacific, Alamo Dr, Leisure Town Rd, Hawkins Rd, Bay Area Exxextric, Shilo Rd, Collinsville Rd, and Montezuma Slough. The 8th district takes in the cities of Vallejo, Fairfield, Suisun City, and Benicia.

Cities & CDP with 10,000 or more people

List of members representing the district

MemberPartyDatesCong
ress(es)
Electoral historyCounties
District created March 4, 1903
MIlton J. Daniels (California Congressman).jpg
Milton J. Daniels
(Riverside)
Republican March 4, 1903 –
March 3, 1905
58th Elected in 1902.
Retired.
1903–1913
Imperial, Inyo, Kern, Orange, Riverside, San Bernardino, San Diego, San Luis Obispo, Santa Barbara, Tulare, Ventura
Sylvester Clark Smith, California Congressman.jpg
Sylvester C. Smith
(Bakersfield)
Republican March 4, 1905 –
January 26, 1913
59th
60th
61st
62nd
Elected in 1904.
Re-elected in 1906.
Re-elected in 1908.
Re-elected in 1910.
Died.
VacantJanuary 27, 1913 –
March 3, 1913
62nd
EverisAHayes.jpg
Everis A. Hayes
(San Jose)
Republican March 4, 1913 –
March 3, 1919
63rd
64th
65th
Redistricted from the 5th district and re-elected in 1912.
Re-elected in 1914.
Re-elected in 1916.
Lost re-election.
1913–1933
Monterey, San Benito, San Luis Obispo, San Mateo, Santa Barbara, Santa Clara, Santa Cruz, Ventura
HughSHersman.jpg
Hugh S. Hersman
(Gilroy)
Democratic March 4, 1919 –
March 3, 1921
66th Elected in 1918.
Lost re-election.
ArthurMFree.jpg
Arthur M. Free
(San Jose)
Republican March 4, 1921 –
March 3, 1933
67th
68th
69th
70th
71st
72nd
Elected in 1920.
Re-elected in 1922.
Re-elected in 1924.
Re-elected in 1926.
Re-elected in 1928.
Re-elected in 1930.
Lost re-election.
John J. McGrath (California Congressman).jpg
John J. McGrath
(San Mateo)
Democratic March 4, 1933 –
January 3, 1939
73rd
74th
75th
Elected in 1932.
Re-elected in 1934.
Re-elected in 1936.
Lost re-election.
1933–1943
Monterey, San Benito, San Mateo, Santa Clara, Santa Cruz
Jack Z. Anderson, 1950.jpg
Jack Z. Anderson
(San Juan Bautista)
Republican January 3, 1939 –
January 3, 1953
76th
77th
78th
79th
80th
81st
82nd
Elected in 1938.
Re-elected in 1940.
Re-elected in 1942.
Re-elected in 1944.
Re-elected in 1946.
Re-elected in 1948.
Re-elected in 1950.
Retired.
1943–1953
San Benito, San Mateo, Santa Clara, Santa Cruz
George P. Miller, 1950.jpg
George P. Miller
(Alameda)
Democratic January 3, 1953 –
January 3, 1973
83rd
84th
85th
86th
87th
88th
89th
90th
91st
92nd
Redistricted from the 6th district and re-elected in 1952.
Re-elected in 1954.
Re-elected in 1956.
Re-elected in 1958.
Re-elected in 1960.
Re-elected in 1962.
Re-elected in 1964.
Re-elected in 1966.
Re-elected in 1968.
Re-elected in 1970.
Lost renomination.
1953–1975
Alameda outside Oakland
Fortney Pete Stark.jpg
Pete Stark
(Danville)
Democratic January 3, 1973 –
January 3, 1975
93rd Elected in 1972.
Redistricted to the 9th district .
Rondellums105th.jpg
Ron Dellums
(Berkeley)
Democratic January 3, 1975 –
January 3, 1993
94th
95th
96th
97th
98th
99th
100th
101st
102nd
Redistricted from the 7th district and re-elected in 1974.
Re-elected in 1976.
Re-elected in 1978.
Re-elected in 1980.
Re-elected in 1982.
Re-elected in 1984.
Re-elected in 1986.
Re-elected in 1988.
Re-elected in 1990.
Redistricted to the 9th district .
1975–1983
Alameda (Oakland)
1983–1993
Alameda (Oakland), southwestern Contra Costa
Speaker Nancy Pelosi.jpg
Nancy Pelosi
(San Francisco)
Democratic January 3, 1993 –
January 3, 2013
103rd
104th
105th
106th
107th
108th
109th
110th
111th
112th
Redistricted from the 5th district and re-elected in 1992.
Re-elected in 1994.
Re-elected in 1996.
Re-elected in 1998.
Re-elected in 2000.
Re-elected in 2002.
Re-elected in 2004.
Re-elected in 2006.
Re-elected in 2008.
Re-elected in 2010.
Redistricted to the 12th district .
1993–2003
Most of San Francisco
2003–2013:
United States House of Representatives, California District 8.png
Most of San Francisco
Paul Cook official portrait.jpg
Paul Cook
(Yucca Valley)
Republican January 3, 2013 –
December 7, 2020
113th
114th
115th
116th
Elected in 2012.
Re-elected in 2014.
Re-elected in 2016.
Re-elected in 2018.
Resigned when elected to the San Bernardino County Board of Supervisors.
2013–2023
California US Congressional District 8 (since 2013).tif
Inyo, Mono, most of San Bernardino
VacantDecember 7, 2020 –
January 3, 2021
116th
Jay Obernolte 117th U.S Congress.jpg
Jay Obernolte
(Big Bear Lake)
Republican January 3, 2021 –
January 3, 2023
117th Elected in 2020.
Redistricted to the 23rd district .
Rep.JohnGaramendi.jpg
John Garamendi
(Walnut Grove)
Democratic January 3, 2023 –
present
118th Redistricted from the 3rd district and re-elected in 2022.2023–present
California's 8th congressional district (since 2023) (new version).svg
Parts of Contra Costa and Solano

Election results

1902 1904 1906 1908 1910 1912 1914 1916 1918 1920 1922 1924 1926 1928 1930 1932 1934 1936 1938 1940 1942 1944 1946 1948 1950 1952 1954 1956 1958 1960 1962 1964 1966 1968 1970 1972 1974 1976 1978 1980 1982 1984 1986 1988 1990 1992 1994 1996 1998 2000 2002 2004 2006 2008 2010 2012 2014 2016 2018 2020 2022

1902

United States House of Representatives elections, 1902
PartyCandidateVotes%
Republican Milton J. Daniels 20,135 55.6%
Democratic William E. Smythe15,81940.8%
Socialist Noble A. Richardson2,0915.4%
Prohibition Ellsworth Leonardson7622.0%
Total votes38,807 100.0%
Republican win (new seat)

1904

United States House of Representatives elections, 1904
PartyCandidateVotes%
Republican Sylvester C. Smith 23,683 55.6%
Democratic William T. Lucas12,86134.5%
Socialist Noble A. Richardson4,6369.9%
Prohibition Benjamin J. Cloes1,4303.4%
Total votes42,610 100.0%
Republican hold

1906

United States House of Representatives elections, 1906
PartyCandidateVotes%
Republican Sylvester C. Smith (Incumbent) 22,548 55.6%
Democratic Charles A. Barlow 13,99234.5%
Socialist Noble A. Richardson4,0039.9%
Total votes40,543 100.0%
Republican hold

1908

United States House of Representatives elections, 1908
PartyCandidateVotes%
Republican Sylvester C. Smith (Incumbent) 28,202 50.5%
Democratic William G. Irving18,95833.9%
Socialist George A. Garrett7,30213.1%
Prohibition James S. Edwards1,3792.5%
Total votes45,831 100.0%
Republican hold

1910

United States House of Representatives elections, 1910
PartyCandidateVotes%
Republican Sylvester C. Smith (Incumbent) 28,202 50.5%
Democratic William G. Irving18,95833.9%
Socialist George A. Garrett7,30213.1%
Prohibition James S. Edwards1,3792.5%
Total votes45,831 100.0%
Republican hold

1912

United States House of Representatives elections, 1912
PartyCandidateVotes%
Republican Everis A. Hayes (Incumbent) 29,861 50.9%
Democratic James B. Holohan 20,62035.2%
Progressive Robert Whitaker8,12513.9%
Total votes58,606 100.0%
Republican hold

1914

United States House of Representatives elections, 1914
PartyCandidateVotes%
Republican Everis A. Hayes (Incumbent) 36,499 49.1%
Progressive Lewis Dan Bohnett33,70645.3%
Prohibition Joseph Merritt Horton4,1575.6%
Total votes74,362 100.0%
Republican hold

1916

United States House of Representatives elections, 1916
PartyCandidateVotes%
Republican Everis A. Hayes (Incumbent) 50,659 68.6%
Progressive George S. Walker17,57623.8%
Socialist Cora Pattleton Wilson5,5647.5%
Total votes73,799 100.0%
Republican hold

1918

United States House of Representatives elections, 1918
PartyCandidateVotes%
Democratic Hugh S. Hersman 31,167 53%
Republican Everis A. Hayes (Incumbent)27,64147%
Total votes58,808 100%
Democratic gain from Republican

1920

United States House of Representatives elections, 1920 [27]
PartyCandidateVotes%
Republican Arthur M. Free 46,823 64%
Democratic Hugh S. Hersman (Incumbent)26,31136%
Total votes73,134 100%
Republican gain from Democratic

1922

United States House of Representatives elections, 1922 [28]
PartyCandidateVotes%
Republican Arthur M. Free (Incumbent) 57,926 100.0%
Republican hold

1924

United States House of Representatives elections, 1924 [29]
PartyCandidateVotes%
Republican Arthur M. Free (Incumbent) 55,713 100.0%
Republican hold

1926

United States House of Representatives elections, 1926 [30]
PartyCandidateVotes%
Republican Arthur M. Free (Incumbent) 60,384 67.7%
Democratic Philip G. Sheehy28,83632.3%
Total votes89,220 100.0%
Republican hold

1928

United States House of Representatives elections, 1928 [31]
PartyCandidateVotes%
Republican Arthur M. Free (Incumbent) 80,613 68%
Democratic Cecelia M. Casserly37,94732%
Total votes118,560 100%
Republican hold

1930

United States House of Representatives elections, 1930 [32]
PartyCandidateVotes%
Republican Arthur M. Free (Incumbent) 93,377 100.0%
Republican hold

1932

United States House of Representatives elections, 1932 [33]
PartyCandidateVotes%
Democratic John J. McGrath 65,455 56.9%
Republican Arthur M. Free (Incumbent)49,48743.1%
Total votes114,942 100.0%
Democratic gain from Republican

1934

United States House of Representatives elections, 1934 [34]
PartyCandidateVotes%
Democratic John J. McGrath (Incumbent) 107,325 100.0%
Democratic hold

1936

United States House of Representatives elections, 1936 [35]
PartyCandidateVotes%
Democratic John J. McGrath (Incumbent) 78,557 57.6%
Republican Alonzo L. Baker57,80843.4%
Total votes136,365 100.0%
Democratic hold

1938

United States House of Representatives elections, 1938 [36]
PartyCandidateVotes%
Republican Jack Z. Anderson 84,084 55%
Democratic John J. McGrath (Incumbent)68,68145%
Total votes152,765 100%
Republican gain from Democratic

1940

United States House of Representatives elections, 1940 [37]
PartyCandidateVotes%
Republican Jack Z. Anderson (Incumbent) 148,180 96.7%
Communist Elizabeth Nichols5,1863.3%
Democratic John J. McGrath (write-in)370.1%
Total votes153,403 100.0%
Republican hold

1942

United States House of Representatives elections, 1942 [38]
PartyCandidateVotes%
Republican Jack Z. Anderson (Incumbent) 91,536 99.9%
Communist Elizabeth Nichols (write-in)1020.1%
Total votes91,638 100.0%
Republican hold

1944

United States House of Representatives elections, 1944 [39]
PartyCandidateVotes%
Republican Jack Z. Anderson (Incumbent) 94,218 56.5%
Democratic Arthur L. Johnson72,42043.5%
Total votes166,638 100.0%
Republican hold

1946

United States House of Representatives elections, 1946 [40]
PartyCandidateVotes%
Republican Jack Z. Anderson (Incumbent) 113,325 100.0%
Republican hold

1948

United States House of Representatives elections, 1948 [41]
PartyCandidateVotes%
Republican Jack Z. Anderson (Incumbent) 161,743 79.9%
Progressive Paul Taylor40,67020.1%
Total votes202,413 100.0%
Republican hold

1950

United States House of Representatives elections, 1950 [42]
PartyCandidateVotes%
Republican Jack Z. Anderson (Incumbent) 168,510 83.1%
Progressive John A. Peterson34,17616.9%
Total votes202,686 100.0%
Republican hold

1952

United States House of Representatives elections, 1952 [43]
PartyCandidateVotes%
Democratic George P. Miller (Incumbent) 156,445 100.0%
Democratic hold

1954

United States House of Representatives elections, 1954 [44]
PartyCandidateVotes%
Democratic George P. Miller (Incumbent) 101,803 65.4%
Republican Jessie M. Ritchie53,86934.6%
Total votes155,672 100.0%
Democratic hold

1956

United States House of Representatives elections, 1956 [45]
PartyCandidateVotes%
Democratic George P. Miller (Incumbent) 136,720 65.6%
Republican Robert Lee Watkins71,70034.4%
Total votes208,420 100.0%
Democratic hold

1958

United States House of Representatives elections, 1958 [46]
PartyCandidateVotes%
Democratic George P. Miller (Incumbent) 181,437 100.0%
Democratic hold

1960

United States House of Representatives elections, 1960 [47]
PartyCandidateVotes%
Democratic George P. Miller (Incumbent) 152,476 62%
Republican Robert E. Hannon93,40338%
Total votes245,879 100%
Democratic hold

1962

United States House of Representatives elections, 1962 [48]
PartyCandidateVotes%
Democratic George P. Miller (Incumbent) 97,014 72.5%
Republican Harold Petersen36,81027.5%
Total votes133,824 100.0%
Democratic hold

1964

United States House of Representatives elections, 1964 [49]
PartyCandidateVotes%
Democratic George P. Miller (Incumbent) 108,771 70.3%
Republican Donald E. McKay46,06329.7%
Total votes154,834 100.0%
Democratic hold

1966

United States House of Representatives elections, 1966 [50]
PartyCandidateVotes%
Democratic George P. Miller (Incumbent) 92,263 65.4%
Republican Raymond P. Britton48,72734.6%
Total votes140,990 100.0%
Democratic hold

1968

United States House of Representatives elections, 1968 [51]
PartyCandidateVotes%
Democratic George P. Miller (Incumbent) 104,231 64%
Republican Raymond P. Britton58,58436%
Total votes162,815 100%
Democratic hold

1970

United States House of Representatives elections, 1970 [52]
PartyCandidateVotes%
Democratic George P. Miller (Incumbent) 104,311 69%
Republican Michael A. Crane46,87231%
Total votes151,183 100%
Democratic hold

1972

United States House of Representatives elections, 1972 [53]
PartyCandidateVotes%
Democratic Pete Stark 101,024 52.9%
Republican Lew M. Warden Jr.89,94847.1%
Total votes190,972 100.0%
Democratic hold

1974

United States House of Representatives elections, 1974 [54]
PartyCandidateVotes%
Democratic Ron Dellums (Incumbent) 93,106 56.6%
Republican Jack Redden65,43239.6%
American Independent John Holland6,3243.8%
Total votes164,862 100.0%
Democratic hold

1976

United States House of Representatives elections, 1976 [55]
PartyCandidateVotes%
Democratic Ron Dellums (Incumbent) 122,342 62.1%
Republican Philip Stiles Breck Jr.68,37434.7%
Peace and Freedom Robert J. Evans6,2383.2%
Total votes196,954 100.0%
Democratic hold

1978

United States House of Representatives elections, 1978 [56]
PartyCandidateVotes%
Democratic Ron Dellums (Incumbent) 94,824 57.4%
Republican Charles V. Hughes70,48142.6%
Total votes165,305 100.0%
Democratic hold

1980

United States House of Representatives elections, 1980 [57]
PartyCandidateVotes%
Democratic Ron Dellums (Incumbent) 108,380 55.5%
Republican Charles V. Hughes76,58039.2%
Libertarian Tod Mikuriya10,4655.4%
Total votes195,425 100.0%
Democratic hold

1982

United States House of Representatives elections, 1982 [58]
PartyCandidateVotes%
Democratic Ron Dellums (Incumbent) 121,537 55.9%
Republican Claude B. Hutchinson Jr.95,69444.1%
Total votes217,231 100.0%
Democratic hold

1984

United States House of Representatives elections, 1984 [59]
PartyCandidateVotes%
Democratic Ron Dellums (Incumbent) 144,316 60.3%
Republican Charles Connor94,90739.7%
Total votes239,223 100.0%
Democratic hold

1986

United States House of Representatives elections, 1986 [60]
PartyCandidateVotes%
Democratic Ron Dellums (Incumbent) 121,790 60.0%
Republican Steven Eigenberg76,85037.9%
Peace and Freedom Lawrence R. Manuel4,2952.1%
Total votes202,935 100.0%
Democratic hold

1988

United States House of Representatives elections, 1988 [61]
PartyCandidateVotes%
Democratic Ron Dellums (Incumbent) 163,221 66.6%
Republican John J. Cuddihy Jr.76,53131.2%
Peace and Freedom Tom Condit5,4442.2%
Total votes245,196 100.0%
Democratic hold

1990

United States House of Representatives elections, 1990 [62]
PartyCandidateVotes%
Democratic Ron Dellums (Incumbent) 119,645 61.3%
Republican Barbara Galewski75,54438.7%
Total votes195,189 100.0%
Democratic hold

1992

United States House of Representatives elections, 1992 [63]
PartyCandidateVotes%
Democratic Nancy Pelosi (Incumbent) 191,906 82.5%
Republican Marc Wolin25,69311.0%
Peace and Freedom Cesar G. Cadabes7,5723.3%
Libertarian James R. Elwood7,5113.2%
No partyGoldwater (write-in)90.0%
Total votes222,691 100.0%
Democratic hold

1994

United States House of Representatives elections, 1994 [64]
PartyCandidateVotes%
Democratic Nancy Pelosi (Incumbent) 137,642 81.85%
Republican Elsa C. Cheung30,52818.15%
No partyBowman (write-in)10.00%
Total votes168,171 100.0%
Democratic hold

1996

United States House of Representatives elections, 1996 [65]
PartyCandidateVotes%
Democratic Nancy Pelosi (Incumbent) 175,216 84.4%
Republican Justin Raimondo 25,73912.4%
Natural Law David Smithstein6,7833.2%
Republican Ed Murray (write-in)220.0%
Total votes207,760 100.0%
Democratic hold

1998

United States House of Representatives elections, 1998 [66]
PartyCandidateVotes%
Democratic Nancy Pelosi (Incumbent) 148,027 85.83%
Republican David J. Martz20,78112.05%
Natural Law David Smithstein6,7832.12%
Total votes175,591 100.0%
Democratic hold

2000

United States House of Representatives elections, 2000 [67]
PartyCandidateVotes%
Democratic Nancy Pelosi (Incumbent) 181,847 84.5%
Republican Adam Sparks25,29811.7%
Libertarian Erik Bauman5,6452.6%
Natural Law David Smithstein2,6381.2%
Total votes215,428 100.0%
Democratic hold

2002

United States House of Representatives elections, 2002 [68]
PartyCandidateVotes%
Democratic Nancy Pelosi (Incumbent) 127,684 79.6%
Republican G. Michael German20,06312.6%
Green Jay Pond10,0336.2%
Libertarian Ira Spivack2,6591.6%
Socialist Workers Deborah Liatos (write-in)20.0%
Total votes160,441 100.0%
Democratic hold

2004

United States House of Representatives elections, 2004 [69]
PartyCandidateVotes%
Democratic Nancy Pelosi (Incumbent) 224,017 83.0%
Republican Jennifer Depalma31,07411.5%
Green Leilani Dowell9,5273.5%
Green Terry Baum (write-in)5,4462.0%
Total votes270,064 100.0%
Democratic hold

2006

United States House of Representatives elections, 2006 [70]
PartyCandidateVotes%
Democratic Nancy Pelosi (Incumbent) 148,435 80.4%
Republican Mike DeNunzio 19,80010.8%
Green Krissy Keefer13,6537.4%
Libertarian Philip Zimt Berg2,7511.4%
Total votes184,639 100.0%
Democratic hold

2008

United States House of Representatives elections, 2008 [71]
PartyCandidateVotes%
Democratic Nancy Pelosi (Incumbent) 204,996 71.7%
Independent Cindy Sheehan 46,11816.1%
Republican Dana Walsh27,6149.7%
Libertarian Philip Zimt Berg6,5042.3%
Total votes285,247 100.0%
Democratic hold

2010

United States House of Representatives elections, 2010 [72]
PartyCandidateVotes%
Democratic Nancy Pelosi (Incumbent) 167,957 80%
Republican John Dennis31,71115%
Peace and Freedom Gloria La Riva 5,1613%
Libertarian Philip Berg4,8432%
Total votes209,672 100%
Democratic hold

2012

United States House of Representatives elections, 2012 [73]
PartyCandidateVotes%
Republican Paul Cook 103,093 57.4%
Republican Gregg Imus76,55142.6%
Total votes179,644 100.0%
Republican hold

2014

United States House of Representatives elections, 2014 [74]
PartyCandidateVotes%
Republican Paul Cook (Incumbent) 77,480 67.6%
Democratic Bob Conaway37,05632.4%
Total votes114,536 100.0%
Republican hold

2016

United States House of Representatives elections, 2016 [75]
PartyCandidateVotes%
Republican Paul Cook (Incumbent) 136,972 62.3%
Democratic Rita Ramirez83,03537.7%
Total votes220,007 100.0%
Republican hold

2018

United States House of Representatives elections, 2018 [76]
PartyCandidateVotes%
Republican Paul Cook 102,415 60.0%
Republican Tim Donnelly 68,37040.0%
Total votes170,785 100.0%
Republican hold

2020

United States House of Representatives elections, 2020 [77]
PartyCandidateVotes%
Republican Jay Obernolte 158,711 56.1%
Democratic Christine Bubser124,40043.9%
Total votes283,111 100%
Republican hold

2022

United States House of Representatives elections, 2022
PartyCandidateVotes%
Democratic John Garamendi (incumbent) 145,501 75.7%
Republican Rudy Recile46,63424.3%
Total votes192,135 100%
Democratic hold

See also

Related Research Articles

California's 9th congressional district is a congressional district in the U.S. state of California. Josh Harder, a Democrat, has represented the district since January 2023.

California's 10th congressional district is a congressional district in the U.S. state of California. Currently, the 10th district encompasses parts of the eastern San Francisco Bay Area. It is currently represented by Democrat Mark DeSaulnier.

<span class="mw-page-title-main">California's 38th congressional district</span> U.S. House district for California

California's 38th congressional district is a congressional district in the U.S. state of California based in suburban eastern Los Angeles County and Orange County, California. The district is currently represented by Democrat Linda Sánchez.

California's 6th congressional district is a congressional district in the U.S. state of California. It is represented by Democrat Ami Bera.

California's 18th congressional district is a congressional district located in the U.S. state of California. The district is currently represented by Democrat Zoe Lofgren. Since the 2022 election, the district is landlocked and includes all of San Benito County and parts of Santa Clara and Monterey counties, including Salinas, Hollister, Watsonville, Gilroy, Soledad, and downtown and eastern San Jose.

California's 5th congressional district is a U.S. congressional district in California.

California's 7th congressional district is a United States congressional district in California. Doris Matsui, a Democrat, has represented the district since January 2023.

California's 4th congressional district is a U.S. congressional district in California. The district is located in the northwestern part of the state, and includes all of Lake County and Napa County, most of Yolo County, and parts of Solano County and Sonoma County. Major cities in the district include Davis, Woodland, Napa, Vacaville, and most of Santa Rosa. The new 4th district is solidly Democratic, and is represented by Mike Thompson.

California's 3rd congressional district is a U.S. congressional district in California. It includes the northern Sierra Nevada and northeastern suburbs of Sacramento, stretching south to Death Valley. It encompasses Alpine, Inyo, Mono, Nevada, Placer, Plumas, and Sierra counties, as well as parts of El Dorado, Sacramento, and Yuba counties. It includes the Sacramento suburbs of Roseville, Folsom, Orangevale, Rocklin, and Lincoln, and the mountain towns of Quincy, South Lake Tahoe, Truckee, Mammoth Lakes, and Bishop. The district is represented by Republican Kevin Kiley.

California's 13th congressional district is a congressional district in the U.S. state of California. John Duarte, a Republican, has represented this district since January 2023.

California's 14th congressional district is a congressional district in the U.S. state of California. Eric Swalwell, a Democrat, has represented the district since January 2023.

California's 15th congressional district is a congressional district in the U.S. state of California. The district is currently represented by Democrat Kevin Mullin.

California's 16th congressional district is a congressional district in the U.S. state of California. It includes portions of Santa Clara, San Mateo, and Santa Cruz counties, extending from the southwestern San Francisco Bay Area through the Santa Cruz Mountains to the Pacific coast. The district is currently represented by Democrat Anna Eshoo.

California's 17th congressional district is a congressional district in the U.S. state of California that is currently represented by Ro Khanna. It is located in the South Bay and East Bay regions of the San Francisco Bay Area.

California's 23rd congressional district is a congressional district in the U.S. state of California. The district is represented in the 118th United States Congress by Jay Obernolte.

California's 24th congressional district is a congressional district in the U.S. state of California. The district is currently represented by Salud Carbajal. It contains all of Santa Barbara County, most of San Luis Obispo County, and part of Ventura County. Cities in the district include Santa Barbara, Ventura, San Luis Obispo, Santa Maria, and Ojai.

California's 31st congressional district is a congressional district in Los Angeles County, in the U.S. state of California. The district is located in the San Gabriel Valley.

<span class="mw-page-title-main">California's 39th congressional district</span> U.S. House district for California

California's 39th congressional district is a congressional district in the U.S. state of California. The district includes parts of Riverside County, including Jurupa Valley, Riverside, Moreno Valley, and Perris. The district has been represented by Democrat Mark Takano ever since he was redistricted from the 41st congressional district in 2022.

<span class="mw-page-title-main">California's 46th congressional district</span> U.S. House district for California

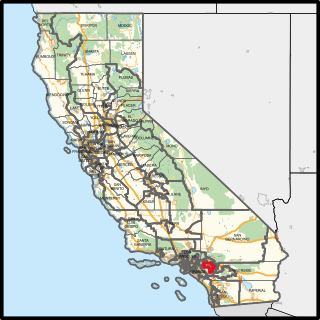
California's 46th congressional district is a congressional district in the U.S. state of California.

<span class="mw-page-title-main">California's 47th congressional district</span> U.S. House district for California

California's 47th congressional district is a congressional district in the U.S. state of California.

References

  1. Center for New Media & Promotion (CNMP), US Census Bureau. "My Congressional District". www.census.gov.
  2. "2022 Cook Partisan Voting Index (Cook PVI) District Map". Cook PVI. Retrieved January 8, 2023.
  3. "Partisan Voting Index Districts of the 113th Congress: 2004 & 2008" (PDF). The Cook Political Report. Archived from the original (PDF) on March 5, 2013. Retrieved February 13, 2013.
  4. "California Election Results, Nov. 6th, 2012". Los Angeles Times. Retrieved February 14, 2013.
  5. Panzar, Javier. "Democrats look likely to get locked out of this Republican-held congressional district in California". Los Angeles Times . Retrieved July 31, 2018.
  6. "Results" (PDF). elections.cdn.sos.ca.gov. 1994. Retrieved August 23, 2019.
  7. "Results" (PDF). elections.cdn.sos.ca.gov. 1994. Retrieved August 23, 2019.
  8. "Results" (PDF). elections.cdn.sos.ca.gov. 1996. Retrieved August 23, 2019.
  9. "Statement of Vote (1998 Governor)" (PDF). September 29, 2011. Archived from the original (PDF) on September 29, 2011.
  10. "Statement of Vote (1998 Senator)" (PDF). September 29, 2011. Archived from the original (PDF) on September 29, 2011.
  11. "Statement of Vote (2000 President)" (PDF). Archived from the original (PDF) on June 11, 2007.
  12. "Statement of Vote (2000 Senator)" (PDF). Archived from the original (PDF) on June 11, 2007.
  13. "Statement of Vote (2002 Governor)" (PDF). Archived from the original (PDF) on November 11, 2010.
  14. "Statement of Vote (2003 Recall Question)" (PDF). Archived from the original (PDF) on May 20, 2011.
  15. "Statement of Vote (2003 Governor)" (PDF). Archived from the original (PDF) on May 20, 2011.
  16. "Statement of Vote (2004 President)" (PDF). Archived from the original (PDF) on August 1, 2010.
  17. "Statement of Vote (2004 Senator)" (PDF). Archived from the original (PDF) on August 10, 2011.
  18. "Statement of Vote (2006 Governor)" (PDF). Archived from the original (PDF) on August 10, 2011.
  19. "Statement of Vote (2006 Senator)" (PDF). Archived from the original (PDF) on August 10, 2011.
  20. "(2008 President)". Archived from the original on February 11, 2009.
  21. "Results" (PDF). elections.cdn.sos.ca.gov. 2014. Retrieved August 23, 2019.
  22. "Results" (PDF). elections.cdn.sos.ca.gov. 2016. Retrieved August 23, 2019.
  23. Coleman, J. Miles (January 1, 2019). "Happy New Year everyone! To celebrate, #ElectionTwitter style, we're gonna be breaking down California's statewide races - all nine of them - from last year by Congressional District. (thread)".
  24. "Results" (PDF). elections.cdn.sos.ca.gov. 2018. Retrieved August 23, 2019.
  25. "Counties by Congressional District for Recall Question" (PDF). sos.ca.gov. September 14, 2021. Retrieved May 2, 2022.
  26. "Counties by Congressional Districts for Governor" (PDF). sos.ca.gov. November 8, 2022. Retrieved May 4, 2023.
  27. 1920 election results
  28. 1922 election results
  29. 1924 election results
  30. 1926 election results
  31. 1928 election results
  32. 1930 election results
  33. 1932 election results
  34. 1934 election results
  35. 1936 election results
  36. 1938 election results
  37. 1940 election results
  38. 1942 election results
  39. 1944 election results
  40. 1946 election results
  41. 1948 election results
  42. 1950 election results
  43. 1952 election results
  44. 1954 election results
  45. 1956 election results
  46. 1958 election results
  47. 1960 election results
  48. 1962 election results
  49. 1964 election results
  50. 1966 election results
  51. 1968 election results
  52. 1970 election results
  53. 1972 election results
  54. 1974 election results
  55. 1976 election results
  56. 1978 election results
  57. 1980 election results
  58. 1982 election results
  59. 1984 election results
  60. 1986 election results
  61. 1988 election results
  62. 1990 election results
  63. 1992 election results
  64. 1994 election results
  65. 1996 election results
  66. 1998 election results
  67. 2000 election results
  68. 2002 general election results Archived February 3, 2009, at the Wayback Machine
  69. "2004 Election Results" (PDF). Clerk of the United States House of Representatives. p. 6. Retrieved October 26, 2022.
  70. 2006 general election results Archived November 27, 2008, at the Wayback Machine
  71. 2008 general election results Archived November 6, 2008, at the Wayback Machine
  72. "House Results Map". The New York Times.
  73. https://elections.cdn.sos.ca.gov/sov/2012-general/06-sov-summary.xls
  74. https://elections.cdn.sos.ca.gov/sov/2014-general/xls/06-summary.xls
  75. https://elections.cdn.sos.ca.gov/sov/2016-general/sov/csv-candidates.xls
  76. "2018 California general election results" (PDF). Retrieved June 16, 2020.
  77. "2020 California general election results" . Retrieved December 8, 2020.
U.S. House of Representatives
Preceded by Home district of the speaker
January 4, 2007 – January 3, 2011
Succeeded by

36°06′N117°18′W / 36.1°N 117.3°W / 36.1; -117.3