2010 United States House of Representatives elections in California

Last updated

2010 United States House of Representatives elections in California
Flag of California.svg
  2008 November 2, 2010 (2010-11-02) 2012  

All 53 California seats to the United States House of Representatives
 Majority partyMinority party
 
Party Democratic Republican
Last election3419
Seats won3419
Seat changeSteady2.svgSteady2.svg
Popular vote5,149,4504,195,513
Percentage53.39%43.50%
SwingDecrease2.svg 6.51%Increase2.svg 6.85%

CA2010House.svg
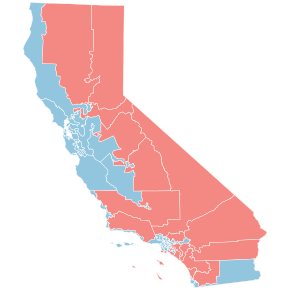
2010 House of Representatives Election Results in California by County.svg

The 2010 United States House of Representatives elections in California were held on November 2, 2010 to determine who would represent California's various congressional districts in the United States House of Representatives. In the 112th Congress, California has 53 seats in the House, apportioned accordingly after the 2000 United States census. Representatives were elected to two-year terms; those elected serve in the 112th Congress from January 3, 2011 to January 3, 2013.

Contents

According to CQ Politics, the districts considered the most competitive are the 3rd and 11th, with the 44th, 45th, and 47th as less than safe as well. [1] The Cook Report includes the 18th and 20th.

Two districts elected new Representatives that year. Republican George Radanovich of the 19th district was succeeded by Republican Jeff Denham, and Democrat Diane Watson of the 33rd district was succeeded by Democrat Karen Bass. However, the partisan balance of the state's congressional delegation did not change, despite the strong Republican dominance in a multitude of other areas of the country.

Overview

United States House of Representatives elections in California, 2010 [2]
PartyVotesPercentageSeats+/–
Democratic 5,149,45053.39%34Steady2.svg
Republican 4,195,51343.50%19Steady2.svg
Libertarian 142,3631.48%0Steady2.svg
American Independent 56,9070.59%0Steady2.svg
Green 46,6260.48%0Steady2.svg
Peace and Freedom 30,7140.32%0Steady2.svg
Independent 23,6390.24%0Steady2.svg
Totals9,645,212100.00%53
Voter turnout55.80%

By district

Results of the 2010 United States House of Representatives elections in California by district: [3]

District Democratic Republican OthersTotalResult
Votes%Votes%Votes%Votes%
District 1 147,30762.79%72,80331.03%14,4826.17%234,592100.0%Democratic hold
District 2 98,09242.85%130,83757.15%110.00%228,940100.0%Republican hold
District 3 113,12843.19%131,16950.08%17,6416.73%261,938100.0%Republican hold
District 4 95,65331.44%186,39761.27%22,1797.29%304,229100.0%Republican hold
District 5 124,22072.05%43,57725.28%4,6132.68%172,410100.0%Democratic hold
District 6 172,21665.94%77,36129.62%11,5754.43%261,152100.0%Democratic hold
District 7 122,43568.32%56,76431.68%00.00%179,199100.0%Democratic hold
District 8 167,95780.10%31,71115.12%10,0284.78%209,696100.0%Democratic hold
District 9 180,40084.27%23,05410.77%10,6314.97%214,085100.0%Democratic hold
District 10 137,57858.84%88,51237.86%7,7163.30%233,806100.0%Democratic hold
District 11 115,36147.97%112,70346.86%12,4395.17%240,503100.0%Democratic hold
District 12 152,04475.58%44,47522.11%4,6432.31%201,162100.0%Democratic hold
District 13 118,27871.95%45,57527.73%5250.32%164,378100.0%Democratic hold
District 14 151,21769.09%60,91727.83%6,7353.08%218,869100.0%Democratic hold
District 15 126,14767.60%60,46832.40%00.00%186,615100.0%Democratic hold
District 16 105,84167.82%37,91324.29%12,3047.88%156,058100.0%Democratic hold
District 17 118,73466.65%53,17629.85%6,2293.50%178,139100.0%Democratic hold
District 18 72,85358.48%51,71641.52%00.00%124,569100.0%Democratic hold
District 19 69,91235.15%128,39464.55%5960.30%198,902100.0%Republican hold
District 20 46,24751.70%43,19748.30%00.00%89,444100.0%Democratic hold
District 21 00.00%135,979100.00%00.00%135,979100.0%Republican hold
District 22 00.00%173,49098.76%2,1731.24%175,663100.0%Republican hold
District 23 111,76857.77%72,74437.60%8,9514.63%193,463100.0%Democratic hold
District 24 96,27940.06%144,05559.94%00.00%240,334100.0%Republican hold
District 25 73,02838.17%118,30861.83%00.00%191,336100.0%Republican hold
District 26 76,09336.52%112,77454.13%19,4809.35%208,347100.0%Republican hold
District 27 102,92765.15%55,05634.85%00.00%157,983100.0%Democratic hold
District 28 88,38569.54%28,49322.42%10,2298.05%127,107100.0%Democratic hold
District 29 104,37464.78%51,53431.98%5,2183.24%161,126100.0%Democratic hold
District 30 153,66364.63%75,94831.94%8,1363.42%237,747100.0%Democratic hold
District 31 76,36383.82%14,74016.18%30.00%91,106100.0%Democratic hold
District 32 77,75971.04%31,69728.96%00.00%109,456100.0%Democratic hold
District 33 131,99086.08%21,34213.92%10.00%153,333100.0%Democratic hold
District 34 69,38277.23%20,45722.77%00.00%89,839100.0%Democratic hold
District 35 98,13179.33%25,56120.66%20.00%123,694100.0%Democratic hold
District 36 114,48959.62%66,70634.74%10,8405.64%192,035100.0%Democratic hold
District 37 85,79968.36%29,15923.23%10,5608.41%125,518100.0%Democratic hold
District 38 85,45973.45%30,88326.55%00.00%116,342100.0%Democratic hold
District 39 81,59063.27%42,03732.60%5,3344.14%128,961100.0%Democratic hold
District 40 59,40033.21%119,45566.79%00.00%178,855100.0%Republican hold
District 41 74,39436.78%127,85763.21%350.02%202,286100.0%Republican hold
District 42 65,12231.86%127,16162.21%12,1155.93%204,398100.0%Republican hold
District 43 70,02665.50%36,89034.50%00.00%106,916100.0%Democratic hold
District 44 85,78444.39%107,48255.61%00.00%193,266100.0%Republican hold
District 45 87,14142.14%106,47251.49%13,1886.38%206,801100.0%Republican hold
District 46 84,94037.79%139,82262.20%200.01%224,782100.0%Republican hold
District 47 50,83252.98%37,67939.27%7,4437.76%95,954100.0%Democratic hold
District 48 88,46536.45%145,48159.94%8,7733.61%242,719100.0%Republican hold
District 49 59,71431.48%119,08862.78%10,8755.73%189,677100.0%Republican hold
District 50 97,81838.96%142,24756.65%11,0164.39%251,081100.0%Republican hold
District 51 86,42360.05%57,48839.95%50.00%143,916100.0%Democratic hold
District 52 70,87032.06%139,46063.09%10,7324.85%221,062100.0%Republican hold
District 53 104,80062.26%57,23034.00%6,2983.74%168,328100.0%Democratic hold
Total5,148,82853.37%4,195,49443.49%303,7743.15%9,648,096100.0%
Popular vote
Democratic
53.39%
Republican
43.50%
Libertarian
1.48%
Other
1.63%
House seats
Democratic
64.15%
Republican
35.85%

Districts

District 1District 2District 3District 4District 5District 6District 7District 8District 9District 10District 11District 12District 13District 14District 15District 16District 17District 18District 19District 20District 21District 22District 23District 24District 25District 26District 27District 28District 29District 30District 31District 32District 33District 34District 35District 36District 37District 38District 39District 40District 41District 42District 43District 44District 45District 46District 47District 48District 49District 50District 51District 52District 53

District 1

California's 1st congressional district (map) has been represented by Democrat Mike Thompson of St. Helena since January 3, 1999.

California's 1st congressional district election, 2010
PartyCandidateVotes%
Democratic Mike Thompson (incumbent) 147,307 62.8
Republican Loren Hanks72,80331.1
Green Carol Wolman8,4863.6
Libertarian Mike Rodrigues5,9962.5
Total votes234,592 100.0
Democratic hold

District 2

California's 2nd congressional district (map) has been represented by Republican Wally Herger of Chico since January 3, 1987.

California's 2nd congressional district election, 2010
PartyCandidateVotes%
Republican Wally Herger (incumbent) 130,837 57.2
Democratic Jim Reed98,09242.8
Independent Mark A. Jensen (write-in)110.0
Total votes228,940 100.0
Republican hold

District 3

California's 3rd congressional district (map) has been represented by Republican Dan Lungren of Gold River since January 3, 2005. In May 2016, Babulal Bera, Ami Bera's father, pleaded guilty to two felony counts of election fraud affecting the 2010 and 2012 elections, [4] and was convicted of illegally funneling $250,000 to Bera's campaigns between 2010 and 2012. [5]

California's 3rd congressional district election, 2010
PartyCandidateVotes%
Republican Dan Lungren (incumbent) 131,169 50.1
Democratic Ami Bera 113,12843.2
American Independent Jerry L. Leidecker6,5772.5
Libertarian Douglas Arthur Tuma6,2752.4
Peace and Freedom Mike Roskey4,7891.8
Total votes261,938 100.0
Republican hold

District 4

California's 4th congressional district (map) has been represented by Republican Tom McClintock of Roseville since January 3, 2009.

California's 4th congressional district election, 2010
PartyCandidateVotes%
Republican Tom McClintock (incumbent) 186,397 61.3
Democratic Clint Curtis95,65331.5
Green Benjamin "Ben" Emery22,1797.2
Total votes304,229 100.0
Republican hold

District 5

California's 5th congressional district (map) has been represented by Democrat Doris Matsui of Sacramento since March 8, 2005.

California's 5th congressional district election, 2010
PartyCandidateVotes%
Democratic Doris Matsui (incumbent) 124,220 72.1
Republican Paul A. Smith43,57725.3
Peace and Freedom Gerald Allen Frink4,5942.6
Republican Tony Lacy (write-in)190.0
Total votes172,410 100.0
Democratic hold

District 6

California's 6th congressional district (map) has been represented by Democrat Lynn Woolsey of Petaluma since January 3, 1993.

California's 6th congressional district election, 2010
PartyCandidateVotes%
Democratic Lynn Woolsey (incumbent) 172,216 66.0
Republican Jim Judd77,36129.7
Peace and Freedom Eugene E. Ruyle5,9152.2
Libertarian Joel Smolen5,6602.1
Total votes261,152 100.0
Democratic hold

District 7

California's 7th congressional district (map) has been represented by Democrat George Miller of Martinez since January 3, 1975.

California's 7th congressional district election, 2010
PartyCandidateVotes%
Democratic George Miller (incumbent) 122,435 68.4
Republican Rick Tubbs56,76431.6
Total votes179,199 100.0
Democratic hold

District 8

California's 8th congressional district (map) has been represented by Democrat Nancy Pelosi of San Francisco since January 3, 1993, when she was redistricted from the 5th district.

California's 8th congressional district election, 2010
PartyCandidateVotes%
Democratic Nancy Pelosi (incumbent) 167,957 80.1
Republican John Dennis31,71115.2
Peace and Freedom Gloria E. La Riva5,1612.5
Libertarian Philip Berg4,8432.3
Independent Summer Shields (write-in)240.0
Total votes209,696 100.0
Democratic hold

District 9

California's 9th congressional district (map) has been represented by Democrat Barbara Lee of Oakland since April 7, 1998.

California's 9th congressional district election, 2010
PartyCandidateVotes%
Democratic Barbara Lee (incumbent) 180,400 84.3
Republican Gerald Hashimoto23,05410.8
Green Dave Heller4,8482.3
Libertarian James Eyer4,1131.9
Peace and Freedom Larry Allen1,6700.8
Total votes214,085 100.0
Democratic hold

District 10

California's 10th congressional district (map) has been represented by Democrat John Garamendi of Walnut Grove since November 5, 2009.

California's 10th congressional district election, 2010
PartyCandidateVotes%
Democratic John Garamendi (incumbent) 137,578 58.9
Republican Gary Clift88,51237.8
Green Jeremy Cloward7,7163.3
Total votes233,806 100.0
Democratic hold

District 11

California's 11th congressional district (map) has been represented by Democrat Jerry McNerney of Pleasanton since January 3, 2007.

California's 11th congressional district election, 2010
PartyCandidateVotes%
Democratic Jerry McNerney (incumbent) 115,361 48.0
Republican David Harmer112,70346.9
American Independent David Christensen12,4395.1
Total votes240,503 100.0
Democratic hold

District 12

California's 12th congressional district (map) has been represented by Democrat Jackie Speier of Hillsborough since April 10, 2008.

California's 12th congressional district election, 2010
PartyCandidateVotes%
Democratic Jackie Speier (incumbent) 152,044 75.6
Republican Mike Maloney44,47522.2
Libertarian Mark Paul Williams4,6112.2
Independent Joseph Michael Harding (write-in)320.0
Total votes201,162 100.0
Democratic hold

District 13

California's 13th congressional district (map) has been represented by Democrat Pete Stark of Fremont since January 3, 1993, when he was redistricted from the 9th district.

California's 13th congressional district election, 2010
PartyCandidateVotes%
Democratic Pete Stark (incumbent) 118,278 72.0
Republican Forest Baker45,57527.7
Independent Chris Pareja (write-in)5250.3
Total votes164,378 100.0
Democratic hold

District 14

California's 14th congressional district (map) has been represented by Democrat Anna Eshoo of Atherton since January 3, 1993.

California's 14th congressional district election, 2010
PartyCandidateVotes%
Democratic Anna Eshoo (incumbent) 151,217 69.1
Republican Dave Chapman60,91727.9
Libertarian Paul Lazaga6,7353.0
Total votes218,869 100.0
Democratic hold

District 15

California's 15th congressional district (map) has been represented by Democrat Mike Honda of San Jose since January 3, 2001.

California's 15th congressional district election, 2010
PartyCandidateVotes%
Democratic Mike Honda (incumbent) 126,147 67.6
Republican Scott Kirkland60,46832.4
Total votes186,615 100.0
Democratic hold

District 16

California's 16th congressional district (map) has been represented by Democrat Zoe Lofgren of San Jose since January 3, 1993.

California's 16th congressional district election, 2010
PartyCandidateVotes%
Democratic Zoe Lofgren (incumbent) 105,841 67.9
Republican Daniel Sahagun37,91324.3
Libertarian Edward M. Gonzalez12,3047.8
Total votes156,058 100.0
Democratic hold

District 17

California's 17th congressional district (map) has been represented by Democrat Sam Farr of Carmel-by-the-Sea since June 8, 1993.

California's 17th congressional district election, 2010
PartyCandidateVotes%
Democratic Sam Farr (incumbent) 118,734 66.7
Republican Jeff Taylor53,17629.9
Green Eric Petersen3,3971.9
Libertarian Mary V. Larkin2,7421.5
Independent Ronald P. Kabat (write-in)900.0
Total votes178,139 100.0
Democratic hold

District 18

California's 18th congressional district (map) has been represented by Democrat Dennis Cardoza of Atwater since January 3, 2003.

California's 18th congressional district election, 2010
PartyCandidateVotes%
Democratic Dennis Cardoza (incumbent) 72,853 58.5
Republican Mike Berryhill51,71641.5
Total votes124,569 100.0
Democratic hold

District 19

California's 19th congressional district (map) has been represented by Republican George Radanovich of Mariposa since January 3, 1995. Radanovich did not run for reelection.

California's 19th congressional district election, 2010
PartyCandidateVotes%
Republican Jeff Denham 128,394 64.6
Democratic Loraine Goodwin69,91235.2
Democratic Les Marsden (write-in)5960.2
Total votes198,902 100.0
Republican hold

District 20

California's 20th congressional district (map) has been represented by Democrat Jim Costa of Fresno since January 3, 2005.

California's 20th congressional district election, 2010
PartyCandidateVotes%
Democratic Jim Costa (incumbent) 46,247 51.8
Republican Andy Vidak 43,19748.2
Total votes89,444 100.0
Democratic hold

District 21

California's 21st congressional district (map) has been represented by Republican Devin Nunes of Tulare since January 3, 2003.

California's 21st congressional district election, 2010
PartyCandidateVotes%
Republican Devin Nunes (incumbent) 135,979 100.0
Total votes135,979 100.0
Republican hold

District 22

California's 22nd congressional district (map) has been represented by Republican Kevin McCarthy of Bakersfield since January 3, 2007.

California's 22nd congressional district election, 2010
PartyCandidateVotes%
Republican Kevin McCarthy (incumbent) 173,490 98.8
Independent John Uebersax (write-in)2,1731.2
Total votes175,663 100.0
Republican hold

District 23

California's 23rd congressional district (map) has been represented by Democrat Lois Capps of Santa Barbara since January 3, 2003, when she was redistricted from the 22nd district.

California's 23rd congressional district election, 2010
PartyCandidateVotes%
Democratic Lois Capps (incumbent) 111,768 57.8
Republican Tom Watson72,74437.6
Independent John Victor Hager5,6252.9
Libertarian Darrell M. Stafford3,3261.7
Total votes193,463 100.0
Democratic hold

District 24

California's 24th congressional district (map) has been represented by Republican Elton Gallegly of Simi Valley since January 3, 2003, when he was redistricted from the 23rd district.

California's 24th congressional district election, 2010
PartyCandidateVotes%
Republican Elton Gallegly (incumbent) 144,055 60.0
Democratic Timothy Allison96,27940.0
Total votes240,334 100.0
Republican hold

District 25

California's 25th congressional district (map) has been represented by Republican Howard McKeon of Santa Clarita since January 3, 1993.

California's 25th congressional district election, 2010
PartyCandidateVotes%
Republican Howard McKeon (incumbent) 118,308 61.9
Democratic Jackie Conaway73,02838.1
Total votes191,336 100.0
Republican hold

District 26

California's 26th congressional district (map) has been represented by Republican David Dreier of San Dimas since January 3, 2003, when he was redistricted from the 28th district.

California's 26th congressional district election, 2010
PartyCandidateVotes%
Republican David Dreier (incumbent) 112,774 54.2
Democratic Russ Warner76,09336.5
American Independent David L. Miller12,7846.1
Libertarian Randall Weissbuch6,6963.2
Total votes208,347 100.0
Republican hold

District 27

California's 27th congressional district (map) has been represented by Democrat Brad Sherman of Sherman Oaks since January 3, 2003, when he was redistricted from the 24th district.

California's 27th congressional district election, 2010
PartyCandidateVotes%
Democratic Brad Sherman (incumbent) 102,927 65.2
Republican Mark Reed55,05634.8
Total votes157,983 100.0
Democratic hold

District 28

California's 28th congressional district (map) has been represented by Democrat Howard Berman of North Hollywood since January 3, 2003, when he was redistricted from the 26th district.

California's 28th congressional district election, 2010
PartyCandidateVotes%
Democratic Howard Berman (incumbent) 88,385 69.6
Republican Merlin Froyd28,49322.4
Libertarian Carlos Rodriguez10,2298.0
Total votes127,107 100.0
Democratic hold

District 29

California's 29th congressional district (map) has been represented by Democrat Adam Schiff of Burbank since January 3, 2003, when he was redistricted from the 27th district.

California's 29th congressional district election, 2010
PartyCandidateVotes%
Democratic Adam Schiff (incumbent) 104,374 64.8
Republican John P. Colbert51,53432.0
Libertarian Bill Cushing5,2183.2
Total votes161,126 100.0
Democratic hold

District 30

California's 30th congressional district (map) has been represented by Democrat Henry Waxman of Los Angeles since January 3, 2003, when he was redistricted from the 29th district.

California's 30th congressional district election, 2010
PartyCandidateVotes%
Democratic Henry Waxman (incumbent) 153,663 64.7
Republican Charles E. Wilkerson75,94831.9
Libertarian Erich D. Miller5,0212.1
Peace and Freedom Richard R. Castaldo3,1151.3
Total votes237,747 100,0
Democratic hold

District 31

California's 31st congressional district (map) has been represented by Democrat Xavier Becerra of Los Angeles since January 3, 2003, when he was redistricted from the 30th district.

California's 31st congressional district election, 2010
PartyCandidateVotes%
Democratic Xavier Becerra (incumbent) 76,363 83.8
Republican Stephen Carlton Smith14,74016.1
Democratic Sal Genovese (write-in)30.0
Total votes91,106 100.0
Democratic hold

District 32

California's 32nd congressional district (map) has been represented by Democrat Judy Chu of Monterey Park since July 14, 2009.

California's 32nd congressional district election, 2010
PartyCandidateVotes%
Democratic Judy Chu (incumbent) 77,759 71.1
Republican Ed Schmerling31,69728.9
Total votes109,456 100.0
Democratic hold

District 33

California's 33rd congressional district (map) has been represented by Democrat Diane Watson of Los Angeles since January 3, 2003, when she was redistricted from the 32nd district. Watson did not run for reelection.

California's 33rd congressional district election, 2010
PartyCandidateVotes%
Democratic Karen Bass 131,990 86.1
Republican James L. Andion21,34213.9
Democratic Mervin Leon Evans (write-in)10.0
Total votes153,333 100.0
Democratic hold

District 34

California's 34th congressional district (map) has been represented by Democrat Lucille Roybal-Allard of Los Angeles since January 3, 2003, when she was redistricted from the 33rd district.

California's 34th congressional district election, 2010
PartyCandidateVotes%
Democratic Lucille Roybal-Allard (incumbent) 69,382 77.3
Republican Wayne Miller20,45722.7
Total votes89,839 100.0
Democratic hold

District 35

California's 35th congressional district (map) has been represented by Democrat Maxine Waters of Los Angeles since January 3, 1993, when she was redistricted from the 29th district.

California's 35th congressional district election, 2010
PartyCandidateVotes%
Democratic Maxine Waters (incumbent) 98,131 79.4
Republican K. Bruce Brown25,56120.6
Independent Suleiman Edmondson (write-in)20.0
Total votes123,694 100.0
Democratic hold

District 36

California's 36th congressional district (map) has been represented by Democrat Jane Harman of Venice since January 3, 2001.

California's 36th congressional district election, 2010
PartyCandidateVotes%
Democratic Jane Harman (incumbent) 114,489 59.7
Republican Mattie Fein66,70634.7
Libertarian Herb Peters10,8405.6
Total votes192,035 100.0
Democratic hold

District 37

California's 37th congressional district (map) has been represented by Democrat Laura Richardson of Long Beach since August 21, 2007.

California's 37th congressional district election, 2010
PartyCandidateVotes%
Democratic Laura Richardson (incumbent) 85,799 68.4
Republican Star Parker 29,15923.2
Independent Nick Dibs10,5608.4
Total votes125,518 100.0
Democratic hold

District 38

California's 38th congressional district (map) has been represented by Democrat Grace Napolitano of Norwalk since January 3, 2003, when she was redistricted from the 34th district.

California's 38th congressional district election, 2010
PartyCandidateVotes%
Democratic Grace Napolitano (incumbent) 85,459 73.5
Republican Robert Vaughn30,88326.5
Total votes116,342 100.0
Democratic hold

District 39

California's 39th congressional district (map) has been represented by Democrat Linda Sánchez of Lakewood since January 3, 2003.

California's 39th congressional district election, 2010
PartyCandidateVotes%
Democratic Linda Sánchez (incumbent) 81,590 63.3
Republican Larry Steven Andre42,03732.6
American Independent John A. Smith5,3344.1
Total votes128,961 100.0
Democratic hold

District 40

California's 40th congressional district (map) has been represented by Republican Ed Royce of Fullerton since January 3, 2003, when he was redistricted from the 39th district.

California's 40th congressional district election, 2010
PartyCandidateVotes%
Republican Ed Royce (incumbent) 119,455 66.8
Democratic Christina Avalos59,40033.2
Total votes178,855 100.0
Republican hold

District 41

California's 41st congressional district (map) has been represented by Republican Jerry Lewis of Redlands since January 3, 2003, when he was redistricted from the 40th district.

California's 41st congressional district election, 2010
PartyCandidateVotes%
Republican Jerry Lewis (incumbent) 127,857 63.3
Democratic Pat Meagher74,39436.7
Independent Pamela Zander (write-in)350.0
Total votes202,286 100.0
Republican hold

District 42

California's 42nd congressional district (map) has been represented by Republican Gary Miller of Diamond Bar since January 3, 2003, when he was redistricted from the 41st district.

California's 42nd congressional district election, 2010
PartyCandidateVotes%
Republican Gary Miller (incumbent) 127,161 62.3
Democratic Michael Dale Williamson65,12231.8
Libertarian Mark Lambert12,1155.9
Total votes204,398 100.0
Republican hold

District 43

California's 43rd congressional district (map) has been represented by Democrat Joe Baca of Rialto since January 3, 2003, when he was redistricted from the 42nd district.

California's 43rd congressional district election, 2010
PartyCandidateVotes%
Democratic Joe Baca (incumbent) 70,026 65.5
Republican Scott Folkens36,89034.5
Total votes106,916 100.0
Democratic hold

District 44

California's 44th congressional district (map) has been represented by Republican Ken Calvert of Corona since January 3, 2003, when he was redistricted from the 43rd district.

California's 44th congressional district election, 2010
PartyCandidateVotes%
Republican Ken Calvert (incumbent) 107,482 55.7
Democratic Bill Hedrick85,78444.3
Total votes193,266 100.0
Republican hold

District 45

California's 45th congressional district (map) has been represented by Republican Mary Bono Mack of Palm Springs since January 3, 2003, when she was redistricted from the 44th district.

California's 45th congressional district election, 2010
PartyCandidateVotes%
Republican Mary Bono Mack (incumbent) 106,472 51.5
Democratic Steve Pougnet 87,14142.2
American Independent Bill Lussenheide13,1886.3
Total votes206,801 100.0
Republican hold

District 46

California's 46th congressional district (map) has been represented by Republican Dana Rohrabacher of Huntington Beach since January 3, 2003, when he was redistricted from the 45th district.

California's 46th congressional district election, 2010
PartyCandidateVotes%
Republican Dana Rohrabacher (incumbent) 139,822 62.3
Democratic Ken Arnold84,94037.7
Democratic Jay Shah (write-in)200.0
Total votes224,782 100.0
Republican hold

District 47

California's 47th congressional district (map) has been represented by Democrat Loretta Sanchez of Anaheim since January 3, 2003, when she was redistricted from the 46th district.

California's 47th congressional district election, 2010
PartyCandidateVotes%
Democratic Loretta Sanchez (incumbent) 50,832 53.0
Republican Van Tran 37,67939.3
Independent Ceci Iglesias7,4437.7
Total votes95,954 100.0
Democratic hold

District 48

California's 48th congressional district (map) has been represented by Republican John Campbell of Irvine since January 3, 2005.

California's 48th congressional district election, 2010
PartyCandidateVotes%
Republican John Campbell (incumbent) 145,481 60.0
Democratic Beth Krom 88,46536.4
Libertarian Mike Binkley8,7733.6
Total votes242,719 100.0
Republican hold

District 49

California's 49th congressional district (map) has been represented by Republican Darrell Issa of Vista since January 3, 2003, when he was redistricted from the 48th district.

California's 49th congressional district election, 2010
PartyCandidateVotes%
Republican Darrell Issa (incumbent) 119,088 62.8
Democratic Howard Katz59,71431.5
American Independent Dion Clark6,5853.5
Libertarian Mike Paster4,2902.2
Total votes189,672 100.0
Republican hold

District 50

California's 50th congressional district (map) has been represented by Republican Brian Bilbray of Carlsbad since June 13, 2006.

California's 50th congressional district election, 2010
PartyCandidateVotes%
Republican Brian Bilbray (incumbent) 142,247 56.7
Democratic Francine Busby 97,81839.0
Libertarian Lars Grossmith5,5462.2
Peace and Freedom Miriam E. Clark5,4702.1
Total votes251,081 100.0
Republican hold

District 51

California's 51st congressional district (map) has been represented by Democrat Bob Filner of San Diego since January 3, 2003, when he was redistricted from the 50th district.

California's 51st congressional district election, 2010
PartyCandidateVotes%
Democratic Bob Filner (incumbent) 86,423 60.1
Republican Nick Popaditch 57,48839.9
Independent Marcus J. Shapiro (write-in)50.0
Total votes143,916 100.0
Democratic hold

District 52

California's 52nd congressional district (map) has been represented by Republican Duncan D. Hunter of Lakeside since January 3, 2009.

California's 52nd congressional district election, 2010
PartyCandidateVotes%
Republican Duncan D. Hunter (incumbent) 139,460 63.1
Democratic Ray Lutz70,87032.1
Libertarian Michael Benoit10,7324.8
Total votes221,061 100.0
Republican hold

District 53

California's 53rd congressional district (map) has been represented by Democrat Susan Davis of San Diego since January 3, 2003, when she was redistricted from the 49th district.

California's 53rd congressional district election, 2010
PartyCandidateVotes%
Democratic Susan Davis (incumbent) 104,800 62.3
Republican Michael Peter Crimmins57,23034.0
Libertarian Paul Michael-Dekker6,2983.7
Total votes168,328 100.0
Democratic hold

Related Research Articles

<span class="mw-page-title-main">2008 United States House of Representatives elections in New York</span>

The 2008 United States House of Representatives elections in New York were held on November 4, 2008, to elect the 29 U.S. representatives from the State of New York, one from each of the state's 29 congressional districts. state of New York in the United States House of Representatives. New York has 29 seats in the House, apportioned according to the 2000 United States census. Representatives are elected for two-year terms; those elected will serve in the 111th Congress from January 4, 2009, until January 3, 2011. The election coincided with the 2008 U.S. presidential election in which Democrat Barack Obama defeated Republican John McCain by a wide margin.
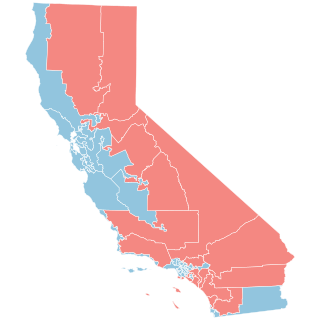
<span class="mw-page-title-main">2008 United States House of Representatives elections in California</span> 2008 House elections in California

The 2008 United States House of Representatives elections in California were held on November 4, 2008 to determine who would represent California various congressional districts in the United States House of Representatives. In the 111th Congress, California has 53 seats in the House, apportioned accordingly after the 2000 United States census. Representatives are elected to two-year terms; those elected will serve in the 111th Congress from January 3, 2009 to January 3, 2011. The election coincides with the United States presidential election as well as other elections in California.
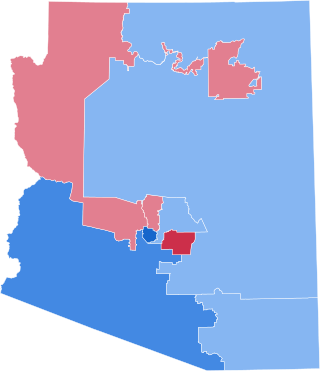
<span class="mw-page-title-main">2008 United States House of Representatives elections in Arizona</span>

The 2008 congressional elections in Arizona were held on November 4, 2008, to determine who would represent the state of Arizona in the United States House of Representatives, coinciding with the presidential election. Representatives are elected for two-year terms; those elected would serve in the 111th Congress from January 4, 2009, until January 3, 2011.

<span class="mw-page-title-main">2008 United States House of Representatives elections in Arkansas</span> Elections

The 2008 United States House of Representatives elections in Arkansas were held on November 4, 2008 to determine who will represent the state of Arkansas in the United States House of Representatives. Arkansas has four seats in the House, apportioned according to the 2000 United States census. Representatives are elected for two-year terms; those elected will serve in the 111th Congress from January 4, 2009 until January 3, 2011. The election coincides with the 2008 presidential election.

<span class="mw-page-title-main">2008 United States House of Representatives elections in Colorado</span>

The 2008 congressional elections in Colorado were held on November 4, 2008 to determine who will represent the state of Colorado in the United States House of Representatives, coinciding with the presidential and senatorial elections. Representatives are elected for two-year terms; those elected served in the 111th Congress from January 3, 2009 until January 3, 2011.

<span class="mw-page-title-main">2008 United States House of Representatives elections in North Carolina</span>

The United States House of Representative elections of 2008 in North Carolina were held on November 4, 2008, as part of the biennial election to the United States House of Representatives. All thirteen seats in North Carolina, and 435 nationwide, were elected to the 111th United States Congress. The party primary elections were held on May 6, 2008.

<span class="mw-page-title-main">2008 United States House of Representatives elections in Pennsylvania</span>

The 2008 congressional elections in Pennsylvania was held on November 4, 2008, to determine who will represent the state of Pennsylvania in the United States House of Representatives. Pennsylvania has 19 seats in the House, apportioned according to the 2000 United States census. Representatives are elected for two-year terms; those elected will serve in the 111th Congress from January 4, 2009, until January 3, 2011. The election coincides with the 2008 U.S. presidential election.

<span class="mw-page-title-main">2008 United States House of Representatives elections in Ohio</span>

The 2008 congressional elections in Ohio were held on November 4, 2008, and determined who will represent the state of Ohio in the United States House of Representatives. The primary election was held on March 4, 2008.

<span class="mw-page-title-main">2008 United States House of Representatives elections in Georgia</span>

The 2008 congressional elections in Georgia were held on November 4, 2008, to determine who would represent the state of Georgia in the United States House of Representatives, coinciding with the presidential and senatorial elections. Representatives are elected for two-year terms; those elected will serve in the 111th Congress from January 3, 2009, until January 3, 2011.

<span class="mw-page-title-main">2008 United States House of Representatives elections in Florida</span>

The 2008 United States House of Representatives Elections in Florida were held on November 4, 2008 to determine who would represent the state of Florida in the United States House of Representatives. Representatives are elected for two-year terms; those elected served in the 111th Congress from January 4, 2009 until January 3, 2011. The election coincided with the 2008 U.S. presidential election.

<span class="mw-page-title-main">2008 United States House of Representatives elections in New Mexico</span>

The 2008 congressional elections in New Mexico were held on November 4, 2008 to determine New Mexico's representation in the United States House of Representatives. The party primary elections were held June 3, 2008. Martin Heinrich, Harry Teague, and Ben Ray Luján, all Democrats, were elected to represent New Mexico in the House. Representatives are elected for two-year terms; the winners of the election currently serve in the 111th Congress, which began on January 4, 2009 and is scheduled to end on January 3, 2011. The election coincided with the 2008 U.S. presidential election and senatorial elections.

<span class="mw-page-title-main">2010 United States House of Representatives elections in Arkansas</span> Elections

The 2010 congressional elections in Arkansas were held on November 2, 2010, to determine who would represent Arkansas in the United States House of Representatives. Arkansas has four seats in the House, apportioned according to the 2000 United States census. Representatives are elected for two-year terms; those elected served in the 112th Congress from January 3, 2011, until January 3, 2013. None of Arkansas's four representatives faced major party opposition in 2008. As of 2023, this was the last election in which a Democrat won a congressional district in Arkansas or managed 40% or more of the House popular vote in the state.

<span class="mw-page-title-main">2010 United States House of Representatives elections in Florida</span>

The 2010 United States House of Representatives Elections in Florida were held on November 2, 2010 to determine who would represent the state of Florida in the United States House of Representatives. Representatives are elected for two-year terms; those elected served in the 112th Congress from January 2011 until January 2013. Florida had twenty-five seats in the House, apportioned according to the 2000 United States census, but would soon gain two more congressional seats in 2012.

<span class="mw-page-title-main">2010 United States House of Representatives elections in New York</span> House elections in New York

The 2010 congressional elections in New York were held on November 2, 2010 to determine representation from the state of New York in the United States House of Representatives. New York had 29 seats in the House. Representatives are elected to two-year terms.

<span class="mw-page-title-main">2010 United States House of Representatives elections in Maryland</span>

The 2010 congressional elections in Maryland were held on November 2, 2010, to determine who will represent the state of Maryland in the United States House of Representatives. Maryland has eight seats in the House, apportioned according to the 2000 United States census. Representatives are elected for two-year terms; those elected served in the 112th Congress from January 3, 2011 until January 3, 2013. The party primaries were held September 14, 2010.

<span class="mw-page-title-main">2010 United States House of Representatives elections in Tennessee</span>

The 2010 United States House of Representatives elections in Tennessee was held on November 2, 2010, to elect the nine U.S. representatives from the state of Tennessee, one from each of the state's nine congressional districts.
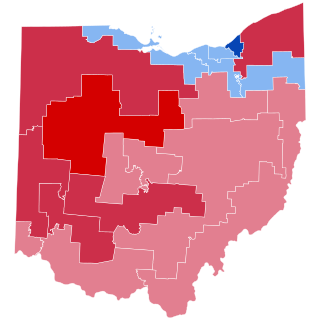
<span class="mw-page-title-main">2010 United States House of Representatives elections in Ohio</span>

The 2010 congressional elections in Ohio were held on November 2, 2010. Ohio had eighteen seats in the United States House of Representatives, and all eighteen incumbent Representatives were seeking re-election in 2010. The elections were held on the same day as many other Ohio elections, and the same day as House of Representatives elections in other states.

<span class="mw-page-title-main">2010 United States House of Representatives elections in Arizona</span> State elections

The 2010 congressional elections in Arizona were held on November 2, 2010, to determine who would represent the state of Arizona in the United States House of Representatives. Arizona had eight seats in the House, apportioned according to the 2000 United States census. Representatives were elected for two-year terms; those elected were to serve in the 112th Congress from January 3, 2011 until January 3, 2013.

<span class="mw-page-title-main">2010 United States House of Representatives elections in Minnesota</span>

The 2010 Minnesota U.S. House of Representatives elections took place on November 2, 2010. All eight congressional seats that make up the state's delegation were contested. Representatives are elected for two-year terms; those elected will serve in the 112th United States Congress from January 3, 2011, until January 3, 2013.

<span class="mw-page-title-main">2010 United States House of Representatives elections in Pennsylvania</span>

The 2010 congressional elections in Pennsylvania were held on November 2, 2010. Pennsylvania had nineteen seats in the United States House of Representatives. The election was held on the same day as many other PA elections, and the same day as House of Representatives elections in other states. Party primary elections were held May 18, 2010.
References

  1. "2010 House Ratings Chart". Congressional Quarterly. Archived from the original on October 28, 2010. Retrieved April 4, 2010.
  2. "Archived copy" (PDF). Archived from the original (PDF) on May 20, 2011. Retrieved January 21, 2014.{{cite web}}: CS1 maint: archived copy as title (link)
  3. Haas, Karen L. (June 3, 2011). "Statistics of the Congressional Election of November 2, 2010". Clerk of the U.S. House of Representatives . Retrieved November 12, 2019.
  4. "Babulal Bera's felonies complicate Ami Bera's re-election effort". The Sacramento Bee. May 10, 2016. Retrieved May 12, 2016.
  5. John Myers (May 1, 2016). "'I have, in fact, done the crime': Rep. Ami Bera's father admits illegal campaign contributions". Los Angeles Times.