2010 United States House of Representatives elections in Pennsylvania

Last updated

2010 United States House of Representatives elections in Pennsylvania
Flag of Pennsylvania.svg
  2008 November 2, 2010 (2010-11-02) 2012  

All 19 Pennsylvania seats to the United States House of Representatives
 Majority partyMinority party
 
Party Republican Democratic
Last election712
Seats won127
Seat changeIncrease2.svg 5Decrease2.svg 5
Popular vote2,034,1451,882,202
Percentage51.41%47.57%

PA2010House.svg
2010 US House PA By County.svg
PA US House 2010 by Precinct.svg

The 2010 congressional elections in Pennsylvania were held on November 2, 2010. Pennsylvania had nineteen seats in the United States House of Representatives. The election was held on the same day as many other PA elections, and the same day as House of Representatives elections in other states. Party primary elections were held May 18, 2010.

Contents

Overview

United States House of Representatives elections in Pennsylvania, 2010 [1]
PartyVotesPercentageSeats BeforeSeats After+/–
Republican 2,034,14551.41%712+5
Democratic 1,882,20247.57%127-5
Independent 40,0541.01%000
Totals3,956,401100.00%1919

By district

Results of the 2010 United States House of Representatives elections in Pennsylvania by district: [2]

District Republican Democratic OthersTotalResult
Votes%Votes%Votes%Votes%
District 1 00.00%149,944100.00%00.00%149,944100.00%Democratic hold
District 2 21,90710.70%182,80089.30%00.00%204,707100.00%Democratic hold
District 3 111,90955.72%88,92444.28%00.00%200,833100.00%Republican gain
District 4 116,95849.19%120,82750.81%00.00%237,785100.00%Democratic hold
District 5 127,42768.69%52,37528.23%5,7103.08%185,512100.00%Republican hold
District 6 133,77057.10%100,49342.90%00.00%234,263100.00%Republican hold
District 7 137,82554.94%110,31443.98%2,7081.08%250,847100.00%Republican gain
District 8 130,75953.52%113,54746.48%00.00%244,306100.00%Republican gain
District 9 141,90473.06%52,32226.94%00.00%194,226100.00%Republican hold
District 10 110,59955.18%89,84644.82%00.00%200,445100.00%Republican gain
District 11 102,17954.70%84,61845.30%00.00%186,797100.00%Republican gain
District 12 91,17049.22%94,05650.78%00.00%185,226100.00%Democratic hold
District 13 91,98743.66%118,71056.34%00.00%210,697100.00%Democratic hold
District 14 49,99728.17%122,07368.79%5,4003.04%177,470100.00%Democratic hold
District 15 109,53453.55%79,76639.00%15,2487.45%204,548100.00%Republican hold
District 16 134,11365.39%70,99434.61%00.00%205,107100.00%Republican hold
District 17 95,00044.50%118,48655.50%00.00%213,486100.00%Democratic hold
District 18 161,88867.33%78,55832.67%00.00%240,446100.00%Republican hold
District 19 165,21971.91%53,54923.31%10,9884.78%229,756100.00%Republican hold
Total2,034,14551.41%1,882,20247.57%40,0541.01%3,956,401100.00%

Congressional districts

District 1

Pennsylvania's 1st congressional district election, 2010
PartyCandidateVotes%
Democratic Bob Brady 149,944 100
Total votes149,944 100

Democratic incumbent Bob Brady was the only member of the Pennsylvania delegation who ran unopposed in 2010.

Brady, a long time central figure in the Pennsylvania Democratic Party, has never received less than 74% in a general election, and opponents have had difficult recruiting even moderately electable candidates in this majority-minority district that includes South Philadelphia and some working class suburbs in Delaware County. No Republican has represented this district since 1949. In 2008, he earned 91% of the vote against Mike Muhammad, a teacher who raised no outside funds. Respected for his ability to reach political deals behind the scenes, Brady has garnered an image as an effective politician, and thus has been rarely challenged by other Democrats. In 2010, Pia Varma, a young freelance writer for conservative publications attempted to gain the Republican nomination, but failed to produce enough signatures to appear on the ballot.

District 2

Pennsylvania's 2nd congressional district election, 2010
PartyCandidateVotes%
Democratic Chaka Fattah 182,800 89.3
Republican Rick Hellberg21,90710.7
Total votes204,707 100
Turnout

Democratic incumbent Chaka Fattah ran for reelection. He faced Republican Rick Hellberg, the CEO of a small financial firm. In 2008, Obama carried this district with 90% of the vote.

Fattah represents one of the top five most Democratic districts in the country, and has never received less than 79% of the vote in his over fifteen year House career. The district includes North Philadelphia and several traditionally liberal suburbs in Montgomery County. Fattah has had the consistent support of the African American community that is the base of a district that hasn't swung Republican since the 1946 elections. Despite this huge Democratic advantage, the district has small pockets of solid Republican territory, and thus Fattah has continuously received GOP opponents (although ones who were unable to raise all more than a few thousand dollars in fundraising), unlike his counterpart in the 1st District. In 2008, Fattah defeated engineer Adam Lang with 81% of the vote.

Fattah won the 2010 general election with 89.3% of the vote. [3]

District 3

Pennsylvania's 3rd congressional district election, 2010
PartyCandidateVotes%
Republican Mike Kelly 111,909 55.7
Democratic Kathy Dahlkemper 88,92444.3
Total votes200,833 100
Turnout

Democratic incumbent Kathy Dahlkemper unsuccessfully ran for re-election, losing to Republican businessman Mike Kelly, who received 55.7% of the vote. [3] In 2008, McCain carried this district with 49% of the vote.

Dahlkemper faced a difficult reelection bid, in a race that considered a tossup by most political analysts. Dahlkemper became used to tight campaigns in her short political career. A political unknown prior to her 2008 campaign, Dahlkemper leveraged a moderate, blue collar image that enticed Democratic voters in a district this is generally pro-union, with a center-right tilt on social issues. Dahlkemper, the owner of a large landscaping business and manager of an Erie County arboretum, came from behind to defeat Erie County Concilman Kyle Foust, the endorsed Democratic candidate. She then went on to narrowly unseat (with 52% of the vote) Congressman Phil English, a moderate Republican who had maintained good relations with labor, by attacking his ties to the Bush administration and for failing to follow through on a promise to retire after six terms. During her first term, Dahlkemper has served as a member of the Blue Dog Coalition of conservative Democrats, which has allowed her to keep a middle ground image. However, her vote in favor of healthcare legislation and the lack of an entrenched image in certain corners of the district left her vulnerable.

In 2010, Dahlkemper faced a primary challenge from former foreign affairs official Mel Marin, winning with 73% of the vote. Republicans focused heavily on regaining the seat, and six GOP candidates earned spots on the ballot: automobile dealer Mike Kelly, manufacturing executive Paul Huber, pharmaceutical representative Clayton Grabb, physician Steve Fisher, factory foreman Ed Franz, and accountant Martha Moore. Kelly and Huber far outraised the remaining four challengers, and they became entangled in an expensive campaign. Kelly was eventually victorious, winning 28% of the vote to Huber's 27% in the factious affair.

Kelly, a former member of the Butler City Council, had a base of support in the heavily Republican Butler County, while Dahlkemper was well known in Erie, the center of population for the district. Other small cities in the district, such as Sharon and Meadville were swing regions, with a slightly conservative tilt that balanced out strongly Democratic Erie. John McCain carried the 3rd District by a 49%-48% margin, which reflects the political balance of the area.

Polling

Poll sourceDate(s)
administered
Sample
size
Margin of
error
Kathy Dahlkemper (D)Mike Kelly (R)Undecided
The Hill/ANG Alliance September 25–27, 2010401± 4.9%36%49%15%
Franklin-Marshall September 14–19, 2010482± 4.5%38%44%18%
The Polling Company July 29-August 1, 2010314± 5.5%46%42%11%

District 4

Pennsylvania's 4th congressional district election, 2010
PartyCandidateVotes%
Democratic Jason Altmire 120,827 50.8
Republican Keith Rothfus 116,95849.2
Total votes237,785 100
Turnout

Democratic incumbent Jason Altmire ran for re-election and faced Republican attorney Keith Rothfus. In 2008, McCain carried this district with 55% of the vote.

Altmire narrowly won re-election with 50.8% of the vote. [3]

District 5

Pennsylvania's 5th congressional district election, 2010
PartyCandidateVotes%
Republican Glenn Thompson 127,427 68.7
Democratic Michael Pipe52,37528.2
Libertarian Vernon Etzel5,7103.1
Total votes185,512 100

Republican incumbent Glenn "G.T." Thompson successfully ran for re-election. He defeated Democrat Michael Pipe and Libertarian Vernon Etzel. In 2008, McCain carried this district with 55% of the vote.

District 6

Pennsylvania's 6th congressional district election, 2010
PartyCandidateVotes%
Republican Jim Gerlach 133,770 57.1
Democratic Manan Trivedi 100,49342.9
Total votes234,263 100

Republican incumbent Jim Gerlach successfully ran for re-election. He defeated Democrat Iraq War veteran Manan Trivedi. In 2008, Obama carried this district with 58% of the vote.

District 7

Pennsylvania's 7th congressional district election, 2010
PartyCandidateVotes%
Republican Pat Meehan 134,751 54.9
Democratic Bryan Lentz 108,19744.1
independent (politician) Jim Schneller2,6701.1
Total votes245,618 100
Turnout

Democratic incumbent Joe Sestak retired to run for the U.S. Senate. Democratic nominee State Representative Bryan Lentz faced Republican nominee U.S. Attorney Pat Meehan and American Constitution Party (independent) nominee Jim Schneller.

District 8

Pennsylvania's 8th congressional district election, 2010
PartyCandidateVotes%
Republican Mike Fitzpatrick 130,759 53.5
Democratic Patrick Murphy 113,54746.5
Total votes244,306 100
Turnout

Democratic incumbent Patrick Murphy unsuccessfully ran for re-election. He was defeated by Republican former U.S. Congressman Mike Fitzpatrick. In 2008, Obama carried this district with 54% of the vote.

Polling

Poll sourceDate(s)
administered
Sample
size
Margin of
error
Patrick Murphy (D)Mike Fitzpatrick (R)Undecided
Franklin-Marshall September 14–19, 2010464± 4.6%35%49%15%
Franklin-Marshall October 14–19, 2010464± 4.6%40%47%5%
Franklin-Marshall October 24–29, 2010464± 4.6%35%55%5%

District 9

Pennsylvania's 9th congressional district election, 2010
PartyCandidateVotes%
Republican Bill Shuster 141,904 73.1
Democratic Tom Conners52,32226.9
Total votes194,226 100

Republican incumbent Bill Shuster successfully ran for re-election. He defeated Democrat Tom Conners and Independent Chad Clopper.

District 10

Pennsylvania's 10th congressional district election, 2010
PartyCandidateVotes%
Republican Tom Marino 110,599 55.2
Democratic Chris Carney 89,84644.8
Total votes200,445 100

Democratic incumbent Chris Carney unsuccessfully ran for re-election, losing to Republican nominee U.S. Attorney Tom Marino. In 2008, McCain carried this district with 54% of the vote.

District 11

Pennsylvania's 11th congressional district election, 2010
PartyCandidateVotes%
Republican Lou Barletta 102,179 54.7
Democratic Paul Kanjorski 84,61845.3
Total votes186,797 100

Democratic incumbent Paul E. Kanjorski unsuccessfully ran for re-election, losing to Republican Hazleton Mayor Lou Barletta. [4] In 2008, Obama carried this district with 57% of the vote.

Kanjorski faced Corey O'Brien and Brian Kelly in the May 2010 Democratic primary, and won with 49.3% of the primary vote.

District 12

Special election

Pennsylvania's 12th congressional district special election, 2010
PartyCandidateVotes%
Democratic Mark Critz 72,218 52.6
Republican Tim Burns 61,72245.0
Libertarian Demo Agoris3,2492.4
Total votes137,189 100

General election

Pennsylvania's 12th congressional district election, 2010
PartyCandidateVotes%
Democratic Mark Critz 94,056 50.8
Republican Tim Burns91,17049.2
Total votes185,226 100

Democrat Mark Critz won a May 2010 special election to replace John Murtha, who served the district for 36 years. He faced Republican businessman Tim Burns. Critz again defeated Burns in the regularly scheduled November general election. In 2008, McCain carried this district with 49% of the vote.

District 13

Pennsylvania's 13th congressional district election, 2010
PartyCandidateVotes%
Democratic Allyson Schwartz 118,710 56.3
Republican Dee Adcock91,98743.7
Total votes210,697 100

Democratic incumbent Allyson Schwartz successfully ran for re-election. She defeated Republican Dee Adcock. Obama carried this district with 59% of the vote.

District 14

Pennsylvania's 14th congressional district election, 2010
PartyCandidateVotes%
Democratic Mike Doyle 122,073 68.8
Republican Melissa Haluszczak49,99728.2
Green Ed Bortz5,4003.0
Total votes177,470 100

Democratic incumbent Mike Doyle successfully ran for re-election. He defeated Republican Melissa Haluszczak and Green Party nominee Ed Bortz. In 2008, Doyle received 91% of the vote and Obama carried this district with 70% of the vote.

District 15

Pennsylvania's 15th congressional district election, 2010
PartyCandidateVotes%
Republican Charlie Dent 109,534 53.6
Democratic John B. Callahan 79,76639.0
independent (politician) Jake Towne15,2487.5
Total votes204,548 100
Turnout

Republican incumbent Charlie Dent successfully ran for re-election. He defeated Democrat Bethlehem Mayor John B. Callahan and Independent Jake Towne. In 2008, Obama carried this district with 56% of the vote.

Polling

Poll sourceDate(s)
administered
Sample
size
Margin of
error
John Callahan (D)Charlie Dent (R)Jake Towne (I)Undecided
Morning Call/Muhlenberg Archived 2011-09-27 at the Wayback Machine September 11–15, 2010496± 5.0%38%49%3%10%

District 16

Pennsylvania's 16th congressional district election, 2010
PartyCandidateVotes%
Republican Joe Pitts 134,113 65.4
Democratic Lois Herr 70,99434.6
Total votes205,107 100

Republican incumbent Joe Pitts successfully ran for re-election. He again defeated Democratic nominee Lois Herr. In 2008, McCain carried the district with 51% of the vote.

District 17

Pennsylvania's 17th congressional district election, 2010
PartyCandidateVotes%
Democratic Tim Holden 118,486 55.5
Republican Dave Argall 95,00044.5
Total votes213,486 100

Democratic incumbent Tim Holden successfully ran for re-election. He defeated Republican State Senator Dave Argall. In 2008, McCain carried this district with 51% of the vote.

District 18

Pennsylvania's 18th congressional district election, 2010
PartyCandidateVotes%
Republican Tim Murphy 161,888 67.3
Democratic Dan Connolly78,55832.7
Total votes240,446 100

Republican incumbent Tim Murphy successfully ran for re-election. He defeated Democrat Dan Connolly. In 2008, McCain carried this district with 55% of the vote.

District 19

Pennsylvania's 19th congressional district election, 2010
PartyCandidateVotes%
Republican Todd Platts 165,219 71.9
Democratic Ryan Sanders53,54923.3
IndependenceJoshua Monighan10,9884.8
Total votes229,756 100

Republican incumbent Todd Platts successfully ran for re-election. He defeated Democrat Ryan Sanders and Independence Party nominee Joshua Monighan. [5] [6] In 2008, McCain carried this district with 56% of the vote.

Related Research Articles

<span class="mw-page-title-main">2008 United States House of Representatives elections in New York</span>

The 2008 United States House of Representatives elections in New York were held on November 4th, 2008, to elect the 29 U.S. representatives from the State of New York, one from each of the state's 29 congressional districts. state of New York in the United States House of Representatives. New York has 29 seats in the House, apportioned according to the 2000 United States Census. Representatives are elected for two-year terms; those elected will serve in the 111th Congress from January 4, 2009 until January 3, 2011. The election coincided with the 2008 U.S. presidential election in which Democrat Barack Obama defeated Republican John McCain by a wide margin.

<span class="mw-page-title-main">2008 United States House of Representatives elections in California</span> 2008 House elections in California

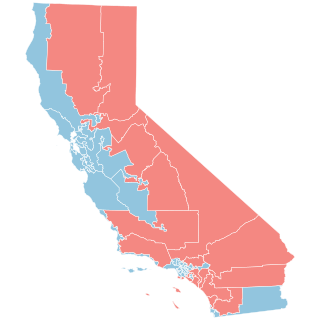
The 2008 United States House of Representatives elections in California were held on November 4, 2008 to determine who would represent California various congressional districts in the United States House of Representatives. In the 111th Congress, California has 53 seats in the House, apportioned accordingly after the 2000 United States Census. Representatives are elected to two-year terms; those elected will serve in the 111th Congress from January 3, 2009 to January 3, 2011. The election coincides with the United States presidential election as well as other elections in California.

<span class="mw-page-title-main">2008 United States House of Representatives elections in Arizona</span>

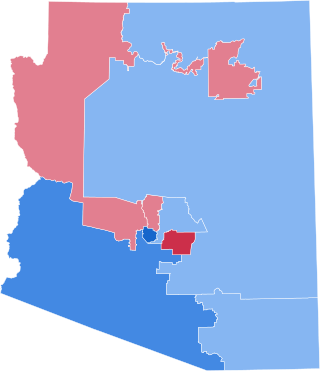
The 2008 congressional elections in Arizona were held on November 4, 2008, to determine who would represent the state of Arizona in the United States House of Representatives, coinciding with the presidential election. Representatives are elected for two-year terms; those elected would serve in the 111th Congress from January 4, 2009, until January 3, 2011.

<span class="mw-page-title-main">2008 United States House of Representatives elections in Arkansas</span> Elections

The 2008 United States House of Representatives elections in Arkansas were held on November 4, 2008 to determine who will represent the state of Arkansas in the United States House of Representatives. Arkansas has four seats in the House, apportioned according to the 2000 United States Census. Representatives are elected for two-year terms; those elected will serve in the 111th Congress from January 4, 2009 until January 3, 2011. The election coincides with the 2008 presidential election.

<span class="mw-page-title-main">2008 United States House of Representatives elections in Colorado</span>

The 2008 congressional elections in Colorado were held on November 4, 2008 to determine who will represent the state of Colorado in the United States House of Representatives, coinciding with the presidential and senatorial elections. Representatives are elected for two-year terms; those elected served in the 111th Congress from January 3, 2009 until January 3, 2011.

<span class="mw-page-title-main">2008 United States House of Representatives elections in North Carolina</span>

The United States House of Representative elections of 2008 in North Carolina were held on November 4, 2008, as part of the biennial election to the United States House of Representatives. All thirteen seats in North Carolina, and 435 nationwide, were elected to the 111th United States Congress. The party primary elections were held on May 6, 2008.

<span class="mw-page-title-main">2008 United States House of Representatives elections in Pennsylvania</span>

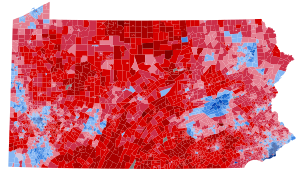
The 2008 congressional elections in Pennsylvania was held on November 4, 2008, to determine who will represent the state of Pennsylvania in the United States House of Representatives. Pennsylvania has 19 seats in the House, apportioned according to the 2000 United States Census. Representatives are elected for two-year terms; those elected will serve in the 111th Congress from January 4, 2009, until January 3, 2011. The election coincides with the 2008 U.S. presidential election.

<span class="mw-page-title-main">2008 United States House of Representatives elections in Kentucky</span>

The 2008 congressional elections in Kentucky were held on November 4, 2008, to determine who would represent the state of Kentucky in the United States House of Representatives. Kentucky has six seats in the House, apportioned according to the 2000 United States Census. Representatives are elected for two-year terms; those elected will serve in the 111th Congress from January 4, 2009, until January 3, 2011. The election coincides with the 2008 U.S. presidential election.

<span class="mw-page-title-main">2008 United States House of Representatives elections in Ohio</span>

The 2008 congressional elections in Ohio were held on November 4, 2008, and determined who will represent the state of Ohio in the United States House of Representatives. The primary election was held on March 4, 2008.

<span class="mw-page-title-main">2008 United States House of Representatives elections in Georgia</span>

The 2008 congressional elections in Georgia were held on November 4, 2008, to determine who would represent the state of Georgia in the United States House of Representatives, coinciding with the presidential and senatorial elections. Representatives are elected for two-year terms; those elected will serve in the 111th Congress from January 3, 2009, until January 3, 2011.

<span class="mw-page-title-main">2008 United States House of Representatives elections in Florida</span>

The 2008 United States House of Representatives Elections in Florida were held on November 4, 2008 to determine who would represent the state of Florida in the United States House of Representatives. Representatives are elected for two-year terms; those elected served in the 111th Congress from January 4, 2009 until January 3, 2011. The election coincided with the 2008 U.S. presidential election.

<span class="mw-page-title-main">2010 United States House of Representatives elections in Florida</span>

The 2010 United States House of Representatives Elections in Florida were held on November 2, 2010 to determine who would represent the state of Florida in the United States House of Representatives. Representatives are elected for two-year terms; those elected served in the 112th Congress from January 2011 until January 2013. Florida had twenty-five seats in the House, apportioned according to the 2000 United States Census, but would soon gain two more congressional seats in 2012.

<span class="mw-page-title-main">2010 United States House of Representatives elections in New York</span> House elections in New York

The 2010 congressional elections in New York were held on November 2, 2010 to determine representation from the state of New York in the United States House of Representatives. New York had 29 seats in the House. Representatives are elected to two-year terms.

<span class="mw-page-title-main">2010 United States House of Representatives elections in Maryland</span>

The 2010 congressional elections in Maryland were held on November 2, 2010, to determine who will represent the state of Maryland in the United States House of Representatives. Maryland has eight seats in the House, apportioned according to the 2000 United States Census. Representatives are elected for two-year terms; those elected served in the 112th Congress from January 3, 2011 until January 3, 2013. The party primaries were held September 14, 2010.

<span class="mw-page-title-main">2010 United States House of Representatives elections in Tennessee</span>

The 2010 United States House of Representatives elections in Tennessee was held on November 2, 2010, to elect the nine U.S. representatives from the state of Tennessee, one from each of the state's nine congressional districts.

<span class="mw-page-title-main">2010 United States House of Representatives elections in Ohio</span>

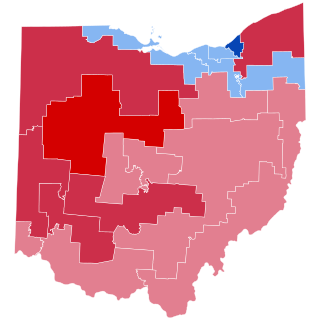
The 2010 congressional elections in Ohio was held on November 2, 2010. Ohio had eighteen seats in the United States House of Representatives, and all eighteen incumbent Representatives were seeking re-election in 2010. The election was held on the same day as many other Ohio elections, and the same day as House of Representatives elections in other states.

<span class="mw-page-title-main">2010 United States House of Representatives elections in Arizona</span> State elections

The 2010 congressional elections in Arizona were held on November 2, 2010, to determine who would represent the state of Arizona in the United States House of Representatives. Arizona had eight seats in the House, apportioned according to the 2000 United States Census. Representatives were elected for two-year terms; those elected were to serve in the 112th Congress from January 3, 2011 until January 3, 2013.

<span class="mw-page-title-main">2010 United States House of Representatives elections in Virginia</span> 2010 House elections in Virginia

The 2010 congressional elections in Virginia were held November 2, 2010, to determine who will represent the state of Virginia in the United States House of Representatives. Representatives are elected for two-year terms; those elected served in the 112th Congress from January 2011 until January 2013.

<span class="mw-page-title-main">2010 United States House of Representatives elections in Connecticut</span>

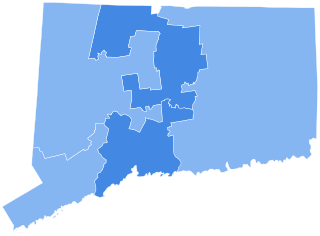
The 2010 United States House of Representatives elections in Connecticut took place on Tuesday, November 2, 2010 to elect the five Congressional representatives from the state, one from each of the state's five Congressional districts. The elections coincided with the elections of other federal and state offices, including governor, U.S. Senate, and state legislature races.

<span class="mw-page-title-main">2010 United States House of Representatives elections in Minnesota</span>

The 2010 Minnesota U.S. House of Representatives elections took place on November 2, 2010. All eight congressional seats that make up the state's delegation were contested. Representatives are elected for two-year terms; those elected will serve in the 112th United States Congress from January 3, 2011, until January 3, 2013.

References

  1. Office of the Clerk of the U.S. House of Representatives
  2. Haas, Karen L. (June 3, 2011). "Statistics of the Congressional Election of November 2, 2010". Clerk of the U.S. House of Representatives . Retrieved November 12, 2019.
  3. 1 2 3 "2010 General Election - Representative in Congress". Commonwealth of PA - Elections Information. Pennsylvania Department of State. 2010. Retrieved May 18, 2013.
  4. Kanjorski wins easily; eyes Barletta rematch Archived 2012-03-08 at the Wayback Machine , The Times Leader, Wilkes-Barre, PA, Timesleader.com. Retrieved on 2010-07-12.
  5. "Pennsylvania Primary Results". Fox News. Archived from the original on May 23, 2010.
  6. "Congressional, Presidential and Political News, Blogs, Member Profiles". CQ Politics. Archived from the original on February 24, 2009. Retrieved August 21, 2010.