Related Research Articles
A minimum wage is the lowest remuneration that employers can legally pay their employees—the price floor below which employees may not sell their labor. Most countries had introduced minimum wage legislation by the end of the 20th century. Because minimum wages increase the cost of labor, companies often try to avoid minimum wage laws by using gig workers, by moving labor to locations with lower or nonexistent minimum wages, or by automating job functions.

Unemployment, according to the OECD, is people above a specified age not being in paid employment or self-employment but currently available for work during the reference period.

The United States is a highly developed mixed-market economy and has the world's largest nominal GDP and net wealth. It has the second-largest by purchasing power parity (PPP) behind China. It has the world's seventh-highest per capita GDP (nominal) and the eighth-highest per capita GDP (PPP) as of 2022. US share of Global economy is 15.78% in PPP terms in 2022. The United States has the most technologically powerful and innovative economy in the world. Its firms are at or near the forefront in technological advances, especially in artificial intelligence, computers, pharmaceuticals, and medical, aerospace, and military equipment. The U.S. dollar is the currency most used in international transactions and is the world's foremost reserve currency, backed by its economy, stable government, and military, its role as the reference standard for the petrodollar system, and its linked eurodollar and large U.S. treasuries market. Several countries use it as their official currency and in others it is the de facto currency. The largest U.S. trading partners are China, the European Union, Canada, Mexico, India, Japan, South Korea, the United Kingdom, and Taiwan. The U.S. is the world's largest importer and second-largest exporter. It has free trade agreements with several countries, including the USMCA, Australia, South Korea, Switzerland, Israel and several others that are in effect or under negotiation.

The United States had an official estimated resident population of 331,893,745 on July 1, 2021, according to the U.S. Census Bureau. This figure includes the 50 states and the District of Columbia but excludes the population of five unincorporated U.S. territories as well as several minor island possessions. The United States is the third most populous country in the world. The Census Bureau showed a population increase of 0.12% for the twelve-month period ending in July 2021, below the world average annual rate of 0.9%. The total fertility rate in the United States estimated for 2021 is 1.664 children per woman, which is below the replacement fertility rate of approximately 2.1.
The Bureau of Labor Statistics (BLS) is a unit of the United States Department of Labor. It is the principal fact-finding agency for the U.S. government in the broad field of labor economics and statistics and serves as a principal agency of the U.S. Federal Statistical System. The BLS is a governmental statistical agency that collects, processes, analyzes, and disseminates essential statistical data to the American public, the U.S. Congress, other Federal agencies, State and local governments, business, and labor representatives. The BLS also serves as a statistical resource to the United States Department of Labor, and conducts research into how much families need to earn to be able to enjoy a decent standard of living.

Kings County is a county located in the U.S. state of California. The population was 152,486 at the 2020 census. The California Department of Finance estimated the county's population was 152,940 as of July 1, 2019. The county seat is Hanford.

Mono County is a county located in the east central portion of the U.S. state of California. As of the 2020 census, the population was 13,195, making it the fourth-least populous county in California. The county seat is Bridgeport. The county is located east of the Sierra Nevada between Yosemite National Park and Nevada. The only incorporated town in the county is Mammoth Lakes, which is located at the foot of Mammoth Mountain. Other locations, such as June Lake, are also famous as skiing and fishing resorts. Located in the middle of the county is Mono Lake, a vital habitat for millions of migratory and nesting birds. The lake is located in a wild natural setting, with pinnacles of tufa arising out of the salty and alkaline lake. Also located in Mono County is Bodie, the official state gold rush ghost town, which is now a California State Historic Park.

Santa Cruz County, officially the County of Santa Cruz, is a county on the Pacific coast of the U.S. state of California. As of the 2020 census, the population was 270,861. The county seat is Santa Cruz. Santa Cruz County comprises the Santa Cruz–Watsonville, CA Metropolitan Statistical Area, which is also included in the San Jose–San Francisco–Oakland, CA Combined Statistical Area. The county is on the California Central Coast, south of the San Francisco Bay Area region. The county forms the northern coast of the Monterey Bay, with Monterey County forming the southern coast.

Solano County is a county located in the U.S. state of California. As of the 2020 census, the population was 453,491. The county seat is Fairfield.

Tehama County is a county located in the northern part of the U.S. state of California. As of the 2020 census, the population was 65,829. The county seat and largest city is Red Bluff.

In economics, a discouraged worker is a person of legal employment age who is not actively seeking employment or who has not found employment after long-term unemployment, but who would prefer to be working. This is usually because an individual has given up looking, hence the term "discouraged".
The Current Population Survey (CPS) is a monthly survey of about 60,000 U.S. households conducted by the United States Census Bureau for the Bureau of Labor Statistics (BLS). The BLS uses the data to publish reports early each month called the Employment Situation. This report provides estimates of the unemployment rate and the numbers of employed and unemployed people in the United States based on the CPS. A readable Employment Situation Summary is provided monthly. Annual estimates include employment and unemployment in large metropolitan areas. Researchers can use some CPS microdata to investigate these or other topics.

Household income is an economic standard that can be applied to one household, or aggregated across a large group such as a county, city, or the whole country. It is commonly used by the United States government and private institutions to describe a household's economic status or to track economic trends in the US.
Income in the United States is measured by the various federal agencies including the Internal Revenue Service, Bureau of Labor Statistics, US Department of Commerce, and the US Census Bureau. Additionally, various agencies, including the Congressional Budget Office compile reports on income statistics. The primary classifications are by household or individual. The top quintile in personal income in 2019 was $103,012. The differences between household and personal income are considerable, since 61% of households now have two or more income earners.
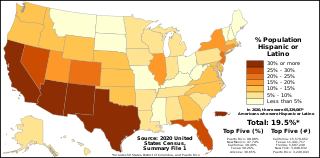
The demographics of Hispanic and Latino Americans depict a population that is the second-largest ethnic group in the United States, 62 million people or 18.7% of the national population.

In the United States, poverty has both social and political implications. In 2020, there were 37.2 million people in poverty. Some of the many causes include income inequality, inflation, unemployment, debt traps and poor education. The vast majority of people living in poverty are less educated and end up in a state of unemployment; higher incarceration rates have also been observed. Although the US is a relatively wealthy country by international standards, poverty has consistently been present throughout the United States, along with efforts to alleviate it, from New Deal-era legislation during the Great Depression, to the national war on poverty in the 1960s and poverty alleviation efforts during the 2008 Great Recession.
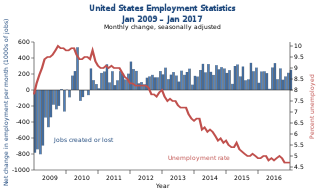
Unemployment in the United States discusses the causes and measures of U.S. unemployment and strategies for reducing it. Job creation and unemployment are affected by factors such as economic conditions, global competition, education, automation, and demographics. These factors can affect the number of workers, the duration of unemployment, and wage levels.
References
- 1 2 3 4 5 6 7 8 "Report 400 C - Monthly Labor Force Data for Counties - January 2014 - Preliminary" (PDF). Employment Development Department, State of California. Archived from the original (PDF) on 2014-04-28. Retrieved 2014-03-13.
- ↑ U.S. Census Bureau. American Community Survey, 2011 American Community Survey 5-Year Estimates, Table B01003. U.S. Census website . Retrieved 2014-03-13.
- 1 2 3 4 "California LaborMarketInfo, Data Library". Employment Development Department, State of California.
- ↑ "Alternative Measures of Labor Underutilization for States". Bureau of Labor Statistics, United States Department of Labor. Retrieved 2014-03-13.