Climate change in Luxembourg discusses the climate change issues in Luxembourg.
Climate change in Luxembourg discusses the climate change issues in Luxembourg.
Emissions of carbon dioxide in total, per capita in 2007 were 22.4 tons CO2 compared to the European Union's 27 countries average of 7.9 tons per capita. [1] 1990 emissions were 13 Mt CO2eq
The Kyoto protocol target is reduction of 4 Mt (28%). [2]
The European primary energy use per capita was highest in 2008 in (TWh/per million): 1) Iceland 191 2) Luxembourg 98 3) Finland 77 4) Norway 72 5) Belgium 64 6) Sweden 62 7) Netherlands 56 8) Russia 56 9) Kazakhstan 53 10) Czech Republic 50 11) France 48, 12) Germany 47 13) Estonia 47 and 14) Austria 46. [3]
Luxembourg is a member of the EU and thus the EU directives are binding.
The Paris agreement is a legally international agreement, its main goal is to limit global warming to below 1.5 degrees Celsius, compared to pre-industrial levels. [4] The Nationally Determined Contributions (NDC's) are the plans to fight climate change adapted for each country. [5] Every party in the agreement has different targets based on its own historical climate records and country's circumstances and all the targets for each country are stated in their NDC. [6] In the case of member countries of the European Union the goals are very similar and the European Union work with a common strategy within the Paris agreement.
From 1981-2010, Luxembourg's average annual temperature rose by 1 °C, in comparison to 1961-1990. This rise in temperature is expected to increase further, possibly by 3.1 °C by the end of the 21st century. Luxembourg is on par with the world average temperature increase of 0.03 °C per year. There is a trend of a lower number of frost days and a higher number of extremely warm days. [7]
| Date | Temperature | Location | Notes |
|---|---|---|---|
| 19 July 2022 | 36.3 °C | Luxembourg City [8] | |
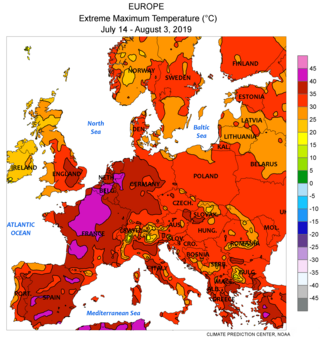
| 25 July 2019 | 40.8 °C | Steinsel commune | Broke the 2003 temperature record [9] |
| 8 & 12 August 2003 | 37.9 °C | Findel airport [10] |

The Kyoto Protocol was an international treaty which extended the 1992 United Nations Framework Convention on Climate Change (UNFCCC) that commits state parties to reduce greenhouse gas emissions, based on the scientific consensus that (part one) global warming is occurring and (part two) that human-made CO2 emissions are driving it. The Kyoto Protocol was adopted in Kyoto, Japan, on 11 December 1997 and entered into force on 16 February 2005. There were 192 parties (Canada withdrew from the protocol, effective December 2012) to the Protocol in 2020.

Climate change mitigation is action to limit climate change by reducing emissions of greenhouse gases or removing those gases from the atmosphere. The recent rise in global average temperature is mostly caused by emissions from fossil fuels burning. Mitigation can reduce emissions by transitioning to sustainable energy sources, conserving energy, and increasing efficiency. In addition, CO2 can be removed from the atmosphere by enlarging forests, restoring wetlands and using other natural and technical processes, which are grouped together under the term of carbon sequestration.

Contraction and Convergence (C&C) is a proposed global framework for reducing greenhouse gas emissions to combat climate change. Conceived by the Global Commons Institute [GCI] in the early 1990s, the Contraction and Convergence strategy consists of reducing overall emissions of greenhouse gases to a safe level (contraction), resulting from every country bringing its emissions per capita to a level which is equal for all countries (convergence). It is intended to form the basis of an international agreement which will reduce carbon dioxide emissions to avoid dangerous climate change, carbon dioxide being the gas that is primarily responsible for changes in the greenhouse effect on Earth. It is expressed as a simple mathematical formula. This formula can be used as a way for the world to stabilize carbon levels at any level. Advocates of Contraction and Convergence stress that negotiations at the United Nations Framework Convention on Climate Change [UNFCCC] are governed sequentially by the 'objective' of the UNFCCC [safe and stable GHG concentration in the global atmosphere] followed by its organising principles ['precaution' and 'equity']. C&C is widely cited and supported.

Greenhouse gas emissions from human activities strengthen the greenhouse effect, contributing to climate change. Most is carbon dioxide from burning fossil fuels: coal, oil, and natural gas. The largest emitters include coal in China and large oil and gas companies. Human-caused emissions have increased atmospheric carbon dioxide by about 50% over pre-industrial levels. The growing levels of emissions have varied, but have been consistent among all greenhouse gases (GHGs). Emissions in the 2010s averaged 56 billion tons a year, higher than any decade before.

Climate change is having major effects on the Chinese economy, society and the environment. China is the largest emitter of carbon dioxide, through an energy infrastructure heavily focused on coal. Other industries, such as a burgeoning construction industry and industrial manufacturing, contribute heavily to carbon emissions. However, like other developing countries, on a per-capita basis, China's carbon emissions are considerably less than countries like the United States. It has also been noted that higher-income countries have outsourced emissions-intensive industries to China. On the basis of cumulative CO2 emissions measured from 1751 through to 2017, China is responsible for 13% globally and about half of the United States' cumulative emissions.

Climate change in Sweden has received significant scientific, public and political attention. In 1896, Swedish chemist Svante Arrhenius was the first scientist to quantify global heating. Sweden has a high energy consumtion per capita, but reducing the dependency on fossil energy has been on the agenda of cabinets of the Governments of Sweden since the 1970s oil crises. In 2014 and 2016, Sweden was ranked #1 in the Global Green Economy Index (GGEI), because the Swedish economy produces relatively low emissions. Sweden has had one of the highest usages of biofuel in Europe and aims at prohibiting new sales of fossil-cars, including hybrid cars, by 2035, and for an energy supply system with zero net atmospheric greenhouse gas emissions by 2045.
This article is about the Kyoto Protocol and government action in relation to that treaty.
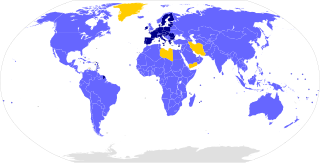
The Paris Agreement, often referred to as the Paris Accords or the Paris Climate Accords, is an international treaty on climate change. Adopted in 2015, the agreement covers climate change mitigation, adaptation, and finance. The Paris Agreement was negotiated by 196 parties at the 2015 United Nations Climate Change Conference near Paris, France. As of February 2023, 195 members of the United Nations Framework Convention on Climate Change (UNFCCC) are parties to the agreement. Of the four UNFCCC member states which have not ratified the agreement, the only major emitter is Iran. The United States withdrew from the agreement in 2020, but rejoined in 2021.

Electricity sector in Luxembourg describes electricity issues in Luxembourg. Luxembourg is a member of OECD and European Union. Luxembourg imports most of its energy. Luxembourg is the EU country with the second smallest forecast of renewables in 2020. Luxembourg has one of the highest emissions of carbon dioxide per person in Europe.
Climate change in Belgium describes the global warming related issues in Belgium. Belgium has the 7th largest CO2 emission per capita in the EU. The CO2 emissions have dropped 19.0% since in comparison with 1990 levels. The average temperature has risen 1.9 degrees Celsius since measurements began in 1890, with an acceleration since 1954.

Climate change in Finland has far reaching impacts on the natural environment and people of Finland. Finland was among the top five greenhouse gas emitters in 2001, on a per capita basis. Emissions increased to 58.8 million tonnes in 2016. Finland needs to triple its current cuts to emissions in order to be carbon neutral by 2035. Finland relies on coal and peat for its energy, but plans to phase out coal by 2029. Finland has a target of carbon neutrality by the year 2035 without carbon credits. The policies include nature conservation, more investments in trains, changes in taxation and more sustainable wood burning. After 2035 Finland will be carbon negative, meaning soaking more carbon than emitting.
Energy in Luxembourg describes energy and electricity production, consumption and import in Luxembourg. Energy policy of Luxembourg will describe the politics of Luxembourg related to energy in greater detail. Electricity sector in Luxembourg is the main article of electricity in Luxembourg.

Primary energy use in Slovakia was 194 TWh and 36 TWh per million inhabitants in 2009.

Climate change in Europe has resulted in an increase in temperature of 1.9 °C (2019) in Europe compared to pre-industrial levels. Europe's climate is getting warmer due to anthropogenic activity. According to international climate experts, global temperature rise should not exceed 2 °C to prevent the most dangerous consequences of climate change; without reduction in greenhouse gas emissions, this could happen before 2050. Climate change has implications for all regions of Europe, with the extent and nature of impacts varying across the continent.

A nationally determined contribution (NDC) or intended nationally determined contribution (INDC) is a non-binding national plan highlighting climate change mitigation, including climate-related targets for greenhouse gas emission reductions. These plans also include policies and measures governments aim to implement in response to climate change and as a contribution to achieve the global targets set out in the Paris Agreement.
Climate change in France has caused some the greatest annual temperature increases registered in any country in Europe. The 2019 heat wave saw record temperatures of 46.0 °C. Heat waves and other extreme weather events are expected to increase with continued climate change. Other expected environmental impacts include increased floods due to both sea level rise and increased glacier melt. These environmental changes will lead to shifts in ecosystems and affect local organisms. Climate change will also cause economic losses in France, particularly in the agriculture and fisheries sectors.

Greenhouse gas emissionsbyRussia are mostly from fossil gas, oil and coal. Russia emits 2 or 3 billion tonnes CO2eq of greenhouse gases each year; about 4% of world emissions. Annual carbon dioxide emissions alone are about 12 tons per person, more than double the world average. Cutting greenhouse gas emissions, and therefore air pollution in Russia, would have health benefits greater than the cost. The country is the world's biggest methane emitter, and 4 billion dollars worth of methane was estimated to leak in 2019/20.

Climate change in the Netherlands is already affecting the country. The average temperature in the Netherlands rose by more than 2 °C from 1901 to 2020. Climate change has resulted in increased frequency of droughts and heatwaves. Because significant portions of the Netherlands have been reclaimed from the sea or otherwise are very near sea level, the Netherlands is very vulnerable to sea level rise.