Related Research Articles
The National Institute of Standards and Technology (NIST) is a physical sciences laboratory and non-regulatory agency of the United States Department of Commerce. Its mission is to promote American innovation and industrial competitiveness. NIST's activities are organized into laboratory programs that include nanoscale science and technology, engineering, information technology, neutron research, material measurement, and physical measurement. From 1901 to 1988, the agency was named the National Bureau of Standards.
Minitab is a statistics package developed at the Pennsylvania State University by researchers Barbara F. Ryan, Thomas A. Ryan, Jr., and Brian L. Joiner in conjunction with Triola Statistics Company in 1972. It began as a light version of OMNITAB 80, a statistical analysis program by National Institute of Standards and Technology.
Software assurance (SwA) is defined as "the level of confidence that software is free from vulnerabilities, either intentionally designed into the software or accidentally inserted at any time during its lifecycle, and that the software functions in the intended manner."
Predictive analytics encompasses a variety of statistical techniques from data mining, predictive modeling, and machine learning that analyze current and historical facts to make predictions about future or otherwise unknown events.
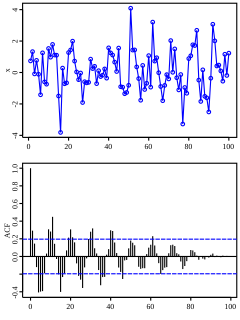
In the analysis of data, a correlogram is a chart of correlation statistics. For example, in time series analysis, a plot of the sample autocorrelations versus is an autocorrelogram. If cross-correlation is plotted, the result is called a cross-correlogram.

The Template Numerical Toolkit is a software library for manipulating vectors and matrices in C++ created by the U.S. National Institute of Standards and Technology. TNT provides the fundamental linear algebra operations. TNT is analogous to the BLAS library used by LAPACK. Higher level algorithms, such as LU decomposition and singular value decomposition, are provided by JAMA, also developed at NIST, which uses TNT.

KDE Wallet manager (KWallet) is free and open-source password management software written in C++ for UNIX-style operating systems. KDE Wallet Manager runs on a Linux-based OS and Its main feature is storing encrypted passwords in KDE Wallets. The main feature of KDE wallet manager (KWallet) is to collect user's credentials such as passwords or IDs and encrypt them through Blowfish symmetric block cipher algorithm or GNU Privacy Guard encryption.
In statistics, Grubbs's test or the Grubbs test, also known as the maximum normalized residual test or extreme studentized deviate test, is a test used to detect outliers in a univariate data set assumed to come from a normally distributed population.
Statistical graphics, also known as statistical graphical techniques, are graphics used in the field of statistics for data visualization.
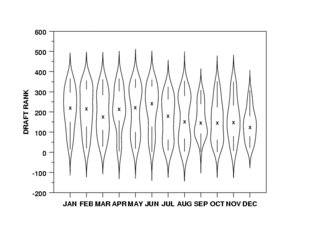
A violin plot is a method of plotting numeric data. It is similar to a box plot, with the addition of a rotated kernel density plot on each side.
In regression analysis, partial leverage (PL) is a measure of the contribution of the individual independent variables to the total leverage of each observation. That is, if hi is the ith element of the diagonal of the hat matrix, PL is a measure of how hi changes as a variable is added to the regression model. It is computed as:

A plot is a graphical technique for representing a data set, usually as a graph showing the relationship between two or more variables. The plot can be drawn by hand or by a computer. In the past, sometimes mechanical or electronic plotters were used. Graphs are a visual representation of the relationship between variables, which are very useful for humans who can then quickly derive an understanding which may not have come from lists of values. Given a scale or ruler, graphs can also be used to read off the value of an unknown variable plotted as a function of a known one, but this can also be done with data presented in tabular form. Graphs of functions are used in mathematics, sciences, engineering, technology, finance, and other areas.

In probability theory, the slash distribution is the probability distribution of a standard normal variate divided by an independent standard uniform variate. In other words, if the random variable Z has a normal distribution with zero mean and unit variance, the random variable U has a uniform distribution on [0,1] and Z and U are statistically independent, then the random variable X = Z / U has a slash distribution. The slash distribution is an example of a ratio distribution. The distribution was named by William H. Rogers and John Tukey in a paper published in 1972.
NIST Special Publication 800-53 provides a catalog of security and privacy controls for all U.S. federal information systems except those related to national security. It is published by the National Institute of Standards and Technology, which is a non-regulatory agency of the United States Department of Commerce. NIST develops and issues standards, guidelines, and other publications to assist federal agencies in implementing the Federal Information Security Modernization Act of 2014 (FISMA) and to help with managing cost effective programs to protect their information and information systems.
LinuxCNC is a free, open-source Linux software system that implements numerical control capability using general purpose computers to control CNC machines. Designed by various volunteer developers at linuxcnc.org, it is typically bundled as an ISO file with a modified version of 32-bit Ubuntu Linux which provides the required real-time kernel.
In the software development process, a reference implementation is a program that implements all requirements from a corresponding specification. The reference implementation often accompanies a technical standard, and demonstrates what should be considered the "correct" behavior of any other implementation of it.
The tables below compare cryptography libraries that deal with cryptography algorithms and have API function calls to each of the supported features.
Post-Quantum Cryptography Standardization is a program and competition by NIST to update their standards to include post-quantum cryptography. It was announced at PQCrypto 2016. 23 signature schemes and 59 encryption/KEM schemes were submitted by the initial submission deadline at the end of 2017 of which 69 total were deemed complete and proper and participated in the first round. Seven of these, of which 3 are signature schemes, have advanced to the third round, which was announced on July 22, 2020.
References
- ↑ "Statistical Software and the e-Handbook of Statistical Methods". www.itl.nist.gov. Retrieved 2022-07-23.
- ↑ "Frequently Asked Questions". www.itl.nist.gov. Retrieved 2022-07-23.
| | This scientific software article is a stub. You can help Wikipedia by expanding it. |