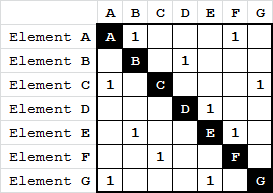
A sample DSM with 7 elements and 11 dependency marks.
The design structure matrix (DSM; also referred to as dependency structure matrix, dependency structure method, dependency source matrix, problem solving matrix, incidence matrix, N2 matrix, interaction matrix, dependency map or design precedence matrix) is a simple, compact and visual representation of a system or project in the form of a square matrix.[1]
It is the equivalent of an adjacency matrix in graph theory, and is used in systems engineering and project management to model the structure of complex systems or processes, in order to perform system analysis, project planning and organization design. Don Steward coined the term "design structure matrix" in the 1960s,[2] using the matrices to solve mathematical systems of equations.
Overview
A design structure matrix lists all constituent subsystems/activities and the corresponding information exchange, interactions, and dependency patterns. For example, where the matrix elements represent activities, the matrix details what pieces of information are needed to start a particular activity, and shows where the information generated by that activity leads. In this way, one can quickly recognize which other activities are reliant upon information outputs generated by each activity.
The use of DSMs in both research and industrial practice increased greatly in the 1990s. DSMs have been applied in the building construction, real estate development, semiconductor, automotive, photographic, aerospace, telecom, small-scale manufacturing, factory equipment, and electronics industries, to name a few, as well as in many government agencies.[1]
The matrix representation has several strengths.
The matrix can represent a large number of system elements and their relationships in a compact way that highlights important patterns in the data (such as feedback loops and modules).
The presentation is amenable to matrix-based analysis techniques, which can be used to improve the structure of the system.
In modeling activities precedence it allows representing feedback linkages that cannot be modeled by Gantt chart/PERT modeling techniques [3]
DSM analysis can also be used to manage the effects of a change. For example, if the specification for a component had to be changed, it would be possible to quickly identify all processes or activities which had been dependent on that specification, reducing the risk that work continues based on out-of-date information.[1]
DSM Structure
A DSM is a square matrix, representing linkages between the system elements. The system elements are often labeled in the rows to the left of the matrix and/or in the columns above the matrix. These elements can represent for example product components, organization teams, or project activities.
The off-diagonal cells are used to indicate relationships between the elements. A marking of the cell indicates a directed link between two elements and can represent design relations or constraints between product components, communication between teams, information flow or precedence relations between activities. In one convention, reading across a row reveals the outputs that the element in that row provides to other elements, and scanning a column reveals the inputs that the element in that column receives from other elements. For example, in the DSM, the marking in column A and row C indicated a link from A to C (output from A, input to C). Alternatively, the rows and columns may be switched (without a change of meaning). Both conventions may be found in the literature.[1]
The cells along the diagonal are typically used to represent the system elements. However, the diagonal cells can be used for representing self-iterations (e.g., rework of a code that did not pass its unit testing). Self-iterations are required when a matrix element represents a block of activities/subsystems that may be further detailed, allowing hierarchical DSM structure.[4]
Two main categories of DSMs have been proposed: static and time-based.[5] Static DSMs represent systems where all of the elements exist simultaneously, such as components of a machine or groups in an organization. A static DSM is equivalent to an N2 chart or an adjacency matrix. The marking in the off-diagonal cells is often largely symmetrical to the diagonal (e.g., in an organizational DSM indicating interactions between teams, there are both a mark from team C to team E and a mark from team E to team C, thus indicating that interactions are mutual). Static DSMs are usually analyzed with clustering algorithms.
A time-based DSM is akin to a precedence diagram or the matrix representation of a directed graph. In time-based DSMs, the ordering of the rows and columns indicates a flow through time: earlier activities in a process appear in the upper-left of the DSM and later activities appear in the lower-right. Terms like “feedforward” and “feedback” become meaningful when referring to interfaces. A feedback mark is an above-diagonal mark (when rows represent output). Time-based DSMs are typically analyzed using sequencing algorithms, that reorder the matrix elements to minimize the amount of feedback marks, and make them as close as possible to the diagonal.[1]
DSM matrices were categorized to Component-based or Architecture DSM; People-based (Team-based) or Organization DSM, both considered as Static (representing existing elements). Activity-based or Schedule DSM and Parameter-based DSM are defined as time-based, as their ordering implies flow.
DSM marking
Initially, the off-diagonal cell markings indicated only the existence/non-existence of an interaction (link) between elements, using a symbol (or the figure '1'). Such marking is defined as Binary DSM. The marking then has developed to indicate quantitative relation Numeric DSM indicating the "strength" of the linkage, or statistical relations Probability DSM indicating for example the probability of applying new information (that require reactivation of the linked activity).[citation needed]
DSM algorithms
The DSM algorithms are used for reordering the matrix elements subject to some criteria. Static DSMs are usually analyzed with clustering algorithms (i.e., reordering the matrix elements in order to group together related elements). Clustering results would typically show groups (clusters) of tightly related elements, and elements that are either not connected or are connected to many other elements and therefore are not part of a group.[1]
Time-based DSMs are typically analyzed using partitioning, tearing and sequencing algorithms.[1][6]
Sequencing methods try to order the matrix elements such that no feedback marks remain.[1] In case of coupled activities (activities that have cyclic links, e.g., activity A is linked to B, which is linked to C, which is linked to A) the results is a block diagonal DSM (i.e., blocks or groups of coupled activities along the diagonal). Partitioning methods include: path searching; reachability matrix; triangulation algorithm; and the powers of the Adjacency Matrix.
Tearing is the removal of feedback marks (in Binary DSM) or assignment of lower priority (numeric DSM). Tearing of a Component-based DSM may imply modularization (the component design is not influencing other components) or standardization (the component design is not influencing and not influenced by other components).[1][7] After tearing a partitioning algorithm is reapplied.
Minimizing feedback loops gets the best results for Binary DSM, but not always for Numeric DSM or Probability DSM. Sequencing algorithms (using optimization, genetic algorithms) are typically trying to minimize the number of feedback loops and also to reorder coupled activities (having cyclic loop) trying to have the feedback marks close to the diagonal. Yet, sometimes the algorithm just tries to minimize a criterion (where minimum iterations is not the optimal results).[8]
Use and extensions
Interactions between various aspects (people, activities, and components) is done using additional (non-square) linkage matrices. The Multiple Domain Matrix (MDM) is an extension of the basic DSM structure.[9] A MDM includes several DSMs (ordered as block diagonal matrices) that represent the relations between elements of the same domain; and corresponding Domain Mapping Matrices (DMM) [10] that represent relations between elements of different domains.
The use of DSM has been extended to visualize and optimize the otherwise invisible information flow and interactions associated with office work. This visualization via DSM allows the Lean Body of Knowledge to be applied to office and information intensive flows.[11]
A customisation of MDM has been illustrated in [12] for the analysis of underspecified systems.
↑ D. V. Steward: The Design Structure System: A Method for Managing the Design of Complex Systems. In: IEEE Transactions on Engineering Management. 28(3), 1981, S. 71-74.
↑ A. Karniel and Y. Reich, "Design process planning using DSM", in Managing the Dynamics of New Product Development Processes: A New Product Lifecycle Management Paradigm, Springer, 2011
↑ Sered Y, Reich Y (2006)," Standardization and modularization driven by minimizing overall process effort." Computer-Aided Design, 38(5):405-416
Karniel, Arie; Reich, Yoram (2011). Managing the Dynamics of New Product Development Processes: A New Product Lifecycle Management Paradigm. Springer. ISBN978-0-85729-569-9.
This page is based on this Wikipedia article Text is available under the CC BY-SA 4.0 license; additional terms may apply. Images, videos and audio are available under their respective licenses.