A Bayesian network is a probabilistic graphical model that represents a set of variables and their conditional dependencies via a directed acyclic graph (DAG). While it is one of several forms of causal notation, causal networks are special cases of Bayesian networks. Bayesian networks are ideal for taking an event that occurred and predicting the likelihood that any one of several possible known causes was the contributing factor. For example, a Bayesian network could represent the probabilistic relationships between diseases and symptoms. Given symptoms, the network can be used to compute the probabilities of the presence of various diseases.
In the field of machine learning and specifically the problem of statistical classification, a confusion matrix, also known as error matrix, is a specific table layout that allows visualization of the performance of an algorithm, typically a supervised learning one; in unsupervised learning it is usually called a matching matrix.
Predictive maintenance techniques are designed to help determine the condition of in-service equipment in order to estimate when maintenance should be performed. This approach promises cost savings over routine or time-based preventive maintenance, because tasks are performed only when warranted. Thus, it is regarded as condition-based maintenance carried out as suggested by estimations of the degradation state of an item.
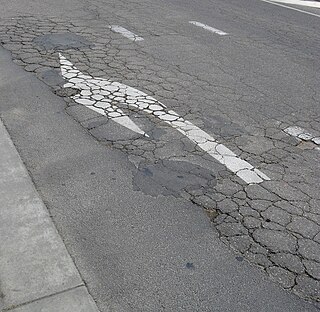
The pavement condition index (PCI) is a numerical index between 0 and 100, which is used to indicate the general condition of a pavement section. The PCI is widely used in transportation civil engineering and asset management, and many municipalities use it to measure the performance of their road infrastructure and their levels of service. It is a statistical measure and requires manual survey of the pavement. This index was originally developed by the United States Army Corps of Engineers as an airfield pavement rating system, but later modified for roadway pavements and standardized by the ASTM. The surveying processes and calculation methods have been documented and standardized by ASTM for both roads and airport pavements:

A road is a thoroughfare, route, or way on land between two places that has been surfaced or otherwise improved to allow travel by foot or some form of conveyance, including a motor vehicle, cart, bicycle, or horse. Roads have been adapted to a large range of structures and types in order to achieve a common goal of transportation under a large and wide range of conditions. The specific purpose, mode of transport, material and location of a road determine the characteristics it must have in order to maximize its usefulness. Following is one classification scheme.
Pavement management is the process of planning the maintenance and repair of a network of roadways or other paved facilities in order to optimize pavement conditions over the entire network.
An asset management plan (AMP) is a tactical plan for managing an organisation's infrastructure and other assets to deliver an agreed standard of service. Typically, an asset management plan will cover more than a single asset, taking a system approach - especially where a number of assets are co-dependent and are required to work together to deliver an agreed standard of service.
In probability theory, a Markov model is a stochastic model used to model pseudo-randomly changing systems. It is assumed that future states depend only on the current state, not on the events that occurred before it. Generally, this assumption enables reasoning and computation with the model that would otherwise be intractable. For this reason, in the fields of predictive modelling and probabilistic forecasting, it is desirable for a given model to exhibit the Markov property.
OptiY is a design environment software that provides modern optimization strategies and state of the art probabilistic algorithms for uncertainty, reliability, robustness, sensitivity analysis, data-mining and meta-modeling.

The international roughness index (IRI) is the roughness index most commonly obtained from measured longitudinal road profiles. It is calculated using a quarter-car vehicle math model, whose response is accumulated to yield a roughness index with units of slope. Although a universal term, IRI is calculated per wheelpath, but can be expanded to a Mean Roughness Index (MRI) when both wheelpath profiles are collected. This performance measure has less stochasticity and subjectivity in comparison to other pavement performance indicators, such as PCI, but it is not completely devoid of randomness. The sources of variability in IRI data include the difference among the readings of different runs of the test vehicle and the difference between the readings of the right and left wheel paths. Despite these facts, since its introduction in 1986, the IRI has become the road roughness index most commonly used worldwide for evaluating and managing road systems.
Infrastructure asset management is the integrated, multidisciplinary set of strategies in sustaining public infrastructure assets such as water treatment facilities, sewer lines, roads, utility grids, bridges, and railways. Generally, the process focuses on the later stages of a facility's life cycle, specifically maintenance, rehabilitation, and replacement. Asset management specifically uses software tools to organize and implement these strategies with the fundamental goal to preserve and extend the service life of long-term infrastructure assets which are vital underlying components in maintaining the quality of life in society and efficiency in the economy. In the 21st century, climate change adaptation has become an important part of infrastructure asset management competence.
Bleeding or flushing is shiny, black surface film of asphalt on the road surface caused by upward movement of asphalt in the pavement surface. Common causes of bleeding are too much asphalt in asphalt concrete, hot weather, low space air void content and quality of asphalt. Bleeding is a safety concern since it results in a very smooth surface, without the texture required to prevent hydroplaning. Road performance measures such as IRI cannot capture the existence of bleeding as it does not increase the surface roughness. But other performance measures such as PCI do include bleeding.
An intelligent maintenance system (IMS) is a system that uses collected data from machinery in order to predict and prevent potential failures in them. The occurrence of failures in machinery can be costly and even catastrophic. In order to avoid failures, there needs to be a system which analyzes the behavior of the machine and provides alarms and instructions for preventive maintenance. Analyzing the behavior of the machines has become possible by means of advanced sensors, data collection systems, data storage/transfer capabilities and data analysis tools. These are the same set of tools developed for prognostics. The aggregation of data collection, storage, transformation, analysis and decision making for smart maintenance is called an intelligent maintenance system (IMS).
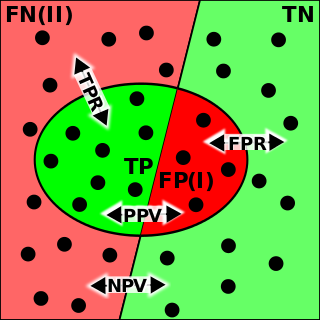
The evaluation of binary classifiers compares two methods of assigning a binary attribute, one of which is usually a standard method and the other is being investigated. There are many metrics that can be used to measure the performance of a classifier or predictor; different fields have different preferences for specific metrics due to different goals. For example, in medicine sensitivity and specificity are often used, while in computer science precision and recall are preferred. An important distinction is between metrics that are independent on the prevalence, and metrics that depend on the prevalence – both types are useful, but they have very different properties.

Pavement performance modeling or pavement deterioration modeling is the study of pavement deterioration throughout its life-cycle. The health of pavement is assessed using different performance indicators. Some of the most well-known performance indicators are Pavement Condition Index (PCI), International Roughness Index (IRI) and Present Serviceability Index (PSI), but sometimes a single distress such as rutting or the extent of crack is used. Among the most frequently used methods for pavement performance modeling are mechanistic models, mechanistic-empirical models, survival curves and Markov models. Recently, machine learning algorithms have been used for this purpose as well. Most studies on pavement performance modeling are based on IRI.
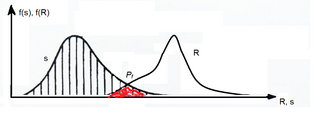
Structural reliability is about applying reliability engineering theories to buildings and, more generally, structural analysis. Reliability is also used as a probabilistic measure of structural safety. The reliability of a structure is defined as the probability of complement of failure . The failure occurs when the total applied load is larger than the total resistance of the structure. Structural reliability has become known as a design philosophy in the twenty-first century, and it might replace traditional deterministic ways of design and maintenance.
Levels of service (LOS) is a term in asset management referring to the quality of a given service. Defining and measuring levels of service is a key activity in developing infrastructure asset management plans. Levels of service may be tied to physical performance of assets or be defined via customer expectation and satisfaction. The latter is more service-centric rather than asset-centric. For instance, when measuring the LOS of a road, it could be measured by a physical performance indicator such as Pavement Condition Index (PCI) or by a measure related to customer satisfaction such as the number of complaints per month about that certain road section. Or in the case of traffic level of service, it could be measured by the geometry of road or by travel time of the vehicles, which reflects the quality of traffic flow. So, levels of service can have multiple facets: customer satisfaction, environmental requirements and legal requirements.

Pavement crack refers to a variety of types of pavement distresses that occur on the surface of pavements. Different types of pavements develop different cracks. Type of cracking is also correlated with the type of climate and traffic. Sometimes the cracks are aggregated using an index such as Crack index, and sometimes they are merged with other distresses and are reported using Pavement Condition Index.

Granular base equivalency or granular base equivalence (GBE) is a measure of total pavement thickness. Since pavement is composed of multiple layers with different physical properties, its total thickness is measured by GBE. GBE translates the thickness of different road layers to a number using a set of coefficients. So, to calculate the GBE, the depth of each layer should be multiplied by the granular equivalency factor for the material in that layer. In the next step the sum of the converted layer thicknesses is calculated. This sum is called granular base equivalency, which is a popular and important measure in pavement design and pavement performance modeling.
The present serviceability index (PSI) is a pavement performance measure. Introduced by the American Association of State Highway and Transportation Officials (AASHTO), the PSI is one of the most widely used pavement performance indicators after pavement condition index (PCI) and international roughness index (IRI). This performance indicator ranges between 0 and 5, 0 representing a failed pavement and 5 an excellent one. Since the PSI entails slope variance, it is correlated with performance indicators related to roughness such as IRI.


