Differential scanning calorimetry (DSC) is a thermoanalytical technique in which the difference in the amount of heat required to increase the temperature of a sample and reference is measured as a function of temperature.[1] Both the sample and reference are maintained at nearly the same temperature throughout the experiment.
Generally, the temperature program for a DSC analysis is designed such that the sample holder temperature increases linearly as a function of time. The reference sample should have a well-defined heat capacity over the range of temperatures to be scanned.
Additionally, the reference sample must be stable, of high purity, and must not experience much change across the temperature scan. Typically, reference standards have been metals such as indium, tin, bismuth, and lead,[2] but other standards such as polyethylene and fatty acids have been proposed to study polymers and organic compounds, respectively.
The first adiabatic differential scanning calorimeter that could be used in biochemistry was developed by P. L. Privalov and D. R. Monaselidze in 1964 at Institute of Physics in Tbilisi, Georgia.[4] The term DSC was coined to describe this instrument, which measures energy directly and allows precise measurements of heat capacity.[5]
Types
There are two main types of DSC: Heat-flux DSC which measures the difference in heat flux between the sample and a reference (which gives it the alternative name Multi-Cell DSC) and Power differential DSC which measures the difference in power supplied to the sample and a reference.[6][7]
Heat-flux DSC
With Heat-flux DSC, the changes in heat flow are calculated by integrating the ΔTref- curve. For this kind of experiment, a sample and a reference crucible are placed on a sample holder with integrated temperature sensors for temperature measurement of the crucibles. This arrangement is located in a temperature-controlled oven. Unlike the traditional design, the special feature of heat-flux DSC is that it uses flat temperature sensors placed vertically around a flat heater. This setup makes it possible to have a small, light, and low-heat capacity structure while still working like a regular DSC oven.[8]
Power differential DSC
For this kind of setup, also known as Power compensating DSC, the sample and reference crucible are placed in thermally insulated furnaces and not next to each other in the same furnace as in heat-flux-DSC experiments.[9] Then the temperature of both chambers is controlled so that the same temperature is always present on both sides. The electrical power that is required to obtain and maintain this state is then recorded rather than the temperature difference between the two crucibles.[10]
Fast-scan DSC
The 2000s have witnessed the rapid development of Fast-scan DSC (FSC),[11] a novel calorimetric technique that employs micromachined sensors. The key advances of this technique are the ultrahigh scanning rate, which can be as high as 106 K/s, and the ultrahigh sensitivity, with a heat capacity resolution typically better than 1 nJ/K.[12]
Nanocalorimetry [13] has attracted much attention in materials science, where it is applied to perform quantitative analysis of rapid phase transitions, particularly on fast cooling. Another emerging area of application of FSC is physical chemistry, with a focus on the thermophysical properties of thermally labile compounds. Quantities like fusion temperature, fusion enthalpy, sublimation, and vaporization pressures, and enthalpies of such molecules became available.[14]
Temperature Modulated DSC
When performing Temperature Modulated DSC (TMDSC, MDSC), the underlying linear heating rate is superimposed by a sinusoidal temperature variation. The benefit of this procedure is the ability to separate overlapping DSC effects by calculating the reversing and the non-reversing signals. The reversing heat flow is related to the changes in specific heat capacity (→ glass transition) while the non-reversing heat flow corresponds to time-dependent phenomena such as curing, dehydration and relaxation.
Detection of phase transitions
The basic principle underlying this technique is that when the sample undergoes a physical transformation such as phase transitions, more or less heat will need to flow to it than the reference to maintain both at the same temperature. Whether less or more heat must flow to the sample depends on whether the process is exothermic or endothermic.
For example, as a solid sample melts to a liquid, it will require more heat flowing to the sample to increase its temperature at the same rate as the reference. This is due to the absorption of heat by the sample as it undergoes the endothermic phase transition from solid to liquid. Likewise, as the sample undergoes exothermic processes (such as crystallization) less heat is required to raise the sample temperature. By observing the difference in heat flow between the sample and reference, differential scanning calorimeters are able to measure the amount of heat absorbed or released during such transitions. DSC may also be used to observe more subtle physical changes, such as glass transitions. It is widely used in industrial settings as a quality control instrument due to its applicability in evaluating sample purity and for studying polymer curing.[15][16][17]
DTA
An alternative technique, which shares much in common with DSC, is differential thermal analysis (DTA). In this technique it is the heat flow to the sample and reference that remains the same rather than the temperature. When the sample and reference are heated identically, phase changes and other thermal processes cause a difference in temperature between the sample and reference. Both DSC and DTA provide similar information. DSC measures the energy required to keep both the reference and the sample at the same temperature whereas DTA measures the difference in temperature between the sample and the reference when the same amount of energy has been introduced into both.[18]
DSC curves
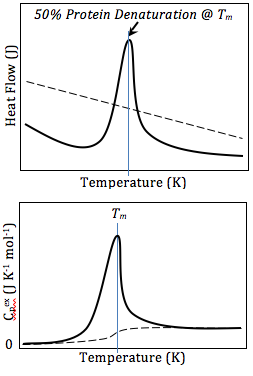
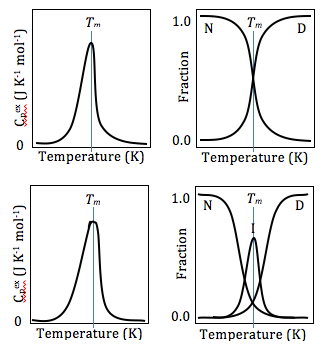
Top: A schematic DSC curve of amount of energy input (y) required to maintain each temperature (x), scanned across a range of temperatures. Bottom: Normalized curves setting the initial heat capacity as the reference. Buffer-buffer baseline (dashed) and protein-buffer variance (solid).Normalized DSC curves using the baseline as the reference (left), and fractions of each conformational state (y) existing at each temperature (right), for two-state (top), and three-state (bottom) proteins. Note the minuscule broadening in the peak of the three-state protein's DSC curve, which may or may not appear statistically significant to the naked eye.
The result of a DSC experiment is a curve of heat flux versus temperature or versus time. There are two different conventions: exothermic reactions in the sample shown with a positive or negative peak, depending on the kind of technology used in the experiment. This curve can be used to calculate enthalpies of transitions. This is done by integrating the peak corresponding to a given transition. It can be shown that the enthalpy of transition can be expressed using the following equation:
where is the enthalpy of transition, is the calorimetric constant, and is the area under the curve. The calorimetric constant will vary from instrument to instrument, and can be determined by analyzing a well-characterized sample with known enthalpies of transition.[16]
Applications
Differential scanning calorimetry can be used to measure a number of characteristic properties of a sample. Using this technique it is possible to observe fusion and crystallization events as well as glass transition temperatures Tg. DSC can also be used to study oxidation, as well as other chemical reactions.[15][16][19]
Glass transitions may occur as the temperature of an amorphous solid is increased. These transitions appear as a step in the baseline of the recorded DSC signal. This is due to the sample undergoing a change in heat capacity; no formal phase change occurs.[15][17]
As the temperature increases, an amorphous solid will become less viscous. At some point the molecules may obtain enough freedom of motion to spontaneously arrange themselves into a crystalline form. This is known as the crystallization temperature (Tc). This transition from amorphous solid to crystalline solid is an exothermic process, and results in a peak in the DSC signal. As the temperature increases the sample eventually reaches its melting temperature (Tm). The melting process results in an endothermic peak in the DSC curve. The ability to determine transition temperatures and enthalpies makes DSC a valuable tool in producing phase diagrams for various chemical systems.[15]
Differential scanning calorimetry can also be used to obtain valuable thermodynamics information about proteins. The thermodynamics analysis of proteins can reveal important information about the global structure of proteins, and protein/ligand interaction. For example, many mutations lower the stability of proteins, while ligand binding usually increases protein stability.[20] Using DSC, this stability can be measured by obtaining Gibbs Free Energy values at any given temperature. This allows researchers to compare the free energy of unfolding between ligand-free protein and protein-ligand complex, or wild type and mutant proteins. DSC can also be used in studying protein/lipid interactions, nucleotides, drug-lipid interactions.[21] In studying protein denaturation using DSC, the thermal melt should be at least to some degree reversible, as the thermodynamics calculations rely on chemical equilibrium.[21]
Experimental considerations
There are various experimental and environmental parameters to consider during DSC measurements. Exemplary potential issues are briefly discussed in the following sections. All statements in these paragraphs are based on the books of Gabbott [22] and Brown.[23]
Crucibles
DSC measurements without crucibles promote the thermal transfer towards the sample and are possible if the DSC is designed for this purpose. Measurements without crucible should only be conducted with chemically stable materials at low temperatures, as otherwise there may be contamination or damage of the calorimeter. The safer way is to use a crucible, which is specified for the desired temperatures and does not react with the sample material (e.g. alumina, gold or platinum crucibles). If the sample is likely to evolve volatiles or is in the liquid state, the crucible should be sealed to prevent contamination. However, if the crucible is sealed, increasing pressure and possible measurement artefacts due to deformation of the crucible must be considered. In this case, crucibles with very small holes (∅~50μm) or crucibles that can withstand very high pressures should be used.
Sample condition
The sample should be in good contact with the crucible surface. Therefore, the contact surface of a solid bulk sample should be plane parallel. For DSC measurements with powders, stronger signal might be observed for finer powders due to the enlarged contact surface. The minimum sample mass depends on the transformation to be analyzed. A small sample mass (~10mg) is sufficient if the released or consumed heat during the transformation is high enough. Heavier samples could be used to obtain transformation associated with low heat release or consumption, as larger samples also enlarge the obtained peaks. However, the increasing sample size might worsen the resolution due to thermal gradients which may evolve during heating.
Temperature and scan rates
If the peaks are very small, it is possible to enlarge them by increasing the scan rate. Due to the faster scan rate, more energy is released or consumed in a shorter time which leads to higher and therefore more distinct peaks. However, faster scan rates lead to poor temperature resolution because of thermal lag. Due to this thermal lag, two phase transformations (or chemical reactions) occurring in a narrow temperature range might overlap. Generally, heating or cooling rates are too high to detect equilibrium transitions, so there is always a shift to higher or lower temperatures compared to phase diagrams representing equilibrium conditions.
Purge gas
Purge gas is used to control the sample environment, in order to reduce signal noise and to prevent contamination. Mostly nitrogen is used and for temperatures above 600°C, argon can be utilized to minimize heat loss due to the low thermal conductivity of argon. Air or pure oxygen can be used for oxidative tests like oxidative induction time and He is used for very low temperatures due to the low boiling temperature (~4.2K at 101.325 kPa [24]).
Examples
The technique is widely used across a range of applications, both as a routine quality test and as a research tool. The equipment is easy to calibrate, using low melting indium at 156.5985°C for example, and is a rapid and reliable method of thermal analysis.[citation needed]
Polymers
Thermal transitions in (A) amorphous and (B) semicrystalline polymers. As the temperature increases, both amorphous and semicrystalline polymers go through the glass transition (Tg). Amorphous polymers (A) do not exhibit other phase transitions. However, semicrystalline polymers (B) undergo crystallization and melting (at temperatures Tc and Tm, respectively).
DSC is used widely for examining polymeric materials to determine their thermal transitions. Important thermal transitions include the glass transition temperature (Tg), crystallization temperature (Tc), and melting temperature (Tm). The observed thermal transitions can be utilized to compare materials, although the transitions alone do not uniquely identify composition. The composition of unknown materials may be completed using complementary techniques such as IR spectroscopy. Melting points and glass transition temperatures for most polymers are available from standard compilations, and the method can show polymer degradation by the lowering of the expected melting temperature. Tm depends on the molecular weight of the polymer and thermal history.[citation needed]
The percent crystalline content of a polymer can be estimated from the crystallization/melting peaks of the DSC graph using reference heats of fusion found in the literature.[25] DSC can also be used to study thermal degradation of polymers using an approach such as Oxidative Onset Temperature/Time (OOT); however, the user risks contamination of the DSC cell, which can be problematic. Thermogravimetric Analysis (TGA) may be more useful for decomposition behavior determination. Impurities in polymers can be determined by examining thermograms for anomalous peaks, and plasticisers can be detected at their characteristic boiling points. In addition, examination of minor events in first heat thermal analysis data can be useful as these apparently "anomalous peaks" can in fact also be representative of process or storage thermal history of the material or polymer physical aging. Comparison of first and second heat data collected at consistent heating rates can allow the analyst to learn about both polymer processing history and material properties. (see J.H.Flynn.(1993) Analysis of DSC results by integration. Thermochimica Acta, 217, 129-149.)[citation needed]
Liquid crystals
DSC is used in the study of liquid crystals. As some forms of matter go from solid to liquid they go through a third state, which displays properties of both phases. This anisotropic liquid is known as a liquid crystalline or mesomorphous state. Using DSC, it is possible to observe the small energy changes that occur as matter transitions from a solid to a liquid crystal and from a liquid crystal to an isotropic liquid.[16]
Oxidative stability
Using differential scanning calorimetry to study the stability to oxidation of samples generally requires an airtight sample chamber. It can be used to determine the oxidative-induction time (OIT) of a sample. Such tests are usually done isothermally (at constant temperature) by changing the atmosphere of the sample. First, the sample is brought to the desired test temperature under an inert atmosphere, usually nitrogen. Oxygen is then added to the system. Any oxidation that occurs is observed as a deviation in the baseline. Such analysis can be used to determine the stability and optimum storage conditions for a material or compound.[15] DSC equipment can also be used to determine the Oxidative-Onset Temperature (OOT) of a material. In this test a sample (and a reference) are exposed to an oxygen atmosphere and subjected to a constant rate of heating (typically from 50 to 300°C). The DSC heat flow curve will deviate when the reaction with oxygen begins (the reaction being either exothermic or endothermic). Both OIT and OOT tests are used as a tools for determining the activity of antioxidants.
Safety screening
DSC makes a reasonable initial safety screening tool. In this mode the sample will be housed in a non-reactive crucible (often gold or gold-plated steel), and which will be able to withstand pressure (typically up to 100 bar). The presence of an exothermic event can then be used to assess the stability of a substance to heat. However, due to a combination of relatively poor sensitivity, slower than normal scan rates (typically 2–3°C/min, due to much heavier crucible) and unknown activation energy, it is necessary to deduct about 75–100°C from the initial start of the observed exotherm to suggest a maximal temperature for the material. A much more accurate data set can be obtained from an adiabatic calorimeter, but such a test may take 2–3 days from ambient at a rate of a 3°C increment per half-hour.[citation needed]
Drug analysis
DSC is widely used in the pharmaceutical and polymer industries. For the polymer chemist, DSC is a handy tool for studying curing processes, which allows the fine tuning of polymer properties. The cross-linking of polymer molecules that occurs in the curing process is exothermic, resulting in a negative peak in the DSC curve that usually appears soon after the glass transition.[15][16][17]
In the pharmaceutical industry it is necessary to have well-characterized drug compounds in order to define processing parameters. For instance, if it is necessary to deliver a drug in the amorphous form, it is desirable to process the drug at temperatures below those at which crystallization can occur.[16]
General chemical analysis
Freezing-point depression can be used as a purity analysis tool when analysed by differential scanning calorimetry. This is possible because the temperature range over which a mixture of compounds melts is dependent on their relative amounts. Consequently, less pure compounds will exhibit a broadened melting peak that begins at lower temperature than a pure compound.[16][17]
↑Poel GV, Mathot V (March 2006). "High-speed/high performance differential scanning calorimetry (HPer DSC): Temperature calibration in the heating and cooling mode and minimization of thermal lag". Thermochimica Acta. 446 (1–2): 41–54. Bibcode:2006TcAc..446...41V. doi:10.1016/j.tca.2006.02.022.
↑Garden JL, Bourgeois O (2016). Nanocalorimetry. In: Bhushan B. (eds) Encyclopedia of Nanotechnology. Springer, Dordrecht. doi:10.1007/978-94-017-9780-1_208.
↑Schick C, Mukhametzyanov TA, Solomonov BN (September 2021). "Fast Scanning Calorimetry of Organic Materials from Low Molecular Mass Materials to Polymers". Reviews and Advances in Chemistry. 11 (1–2): 1–72. doi:10.1134/S2079978021010064. S2CID237539353.
123456Dean JA (1995). The Analytical Chemistry Handbook. New York: McGraw Hill, Inc. pp.15.1 –15.5. ISBN0-07-016197-6.
1234567Pungor E (1995). A Practical Guide to Instrumental Analysis. Florida: Boca Raton. pp.181–191.
1234Skoog DA, Holler FJ, Nieman T (1998). Principles of Instrumental Analysis (5thed.). New York. pp.805–808. ISBN0-03-002078-6.{{cite book}}: CS1 maint: location missing publisher (link)
↑Gabbott, Paul (2008). Principles and applications of thermal analysis. Oxford: Blackwell Pub. ISBN978-14-051-3171-1.
↑Brown, Michael E. (1998). Handbook of Thermal Analysis and Calorimetry, Volume 1 - 1st Edition. Elsevier Science. ISBN978-00-805-3959-1.
↑Mortimer, Charles E.; Müller, Ulrich; Beck, Johannes (2015). Chemie: das Basiswissen der Chemie: 410 Abbildungen, 545 Formelbilder (12., korrigierte und aktualisierte Auflageed.). Stuttgart New York: Georg Thieme Verlag. ISBN978-31-348-4312-5.
↑Wunderlich B (1980). "Chapter 8, Table VIII.6". Macromolecular Physics. Vol.3.
This page is based on this Wikipedia article Text is available under the CC BY-SA 4.0 license; additional terms may apply. Images, videos and audio are available under their respective licenses.