Biostatistics are the development and application of statistical methods to a wide range of topics in biology. It encompasses the design of biological experiments, the collection and analysis of data from those experiments and the interpretation of the results.

A DNA microarray is a collection of microscopic DNA spots attached to a solid surface. Scientists use DNA microarrays to measure the expression levels of large numbers of genes simultaneously or to genotype multiple regions of a genome. Each DNA spot contains picomoles of a specific DNA sequence, known as probes. These can be a short section of a gene or other DNA element that are used to hybridize a cDNA or cRNA sample under high-stringency conditions. Probe-target hybridization is usually detected and quantified by detection of fluorophore-, silver-, or chemiluminescence-labeled targets to determine relative abundance of nucleic acid sequences in the target. The original nucleic acid arrays were macro arrays approximately 9 cm × 12 cm and the first computerized image based analysis was published in 1981. It was invented by Patrick O. Brown. An example of its application is in SNPs arrays for polymorphisms in cardiovascular diseases, cancer, pathogens and GWAS analysis. Also for identification of structural variations and measurement of gene expression.
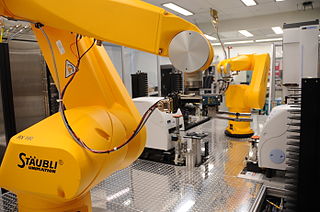
High-throughput screening (HTS) is a method for scientific experimentation especially used in drug discovery and relevant to the fields of biology and chemistry. Using robotics, data processing/control software, liquid handling devices, and sensitive detectors, high-throughput screening allows a researcher to quickly conduct millions of chemical, genetic, or pharmacological tests. Through this process one can rapidly identify active compounds, antibodies, or genes that modulate a particular biomolecular pathway. The results of these experiments provide starting points for drug design and for understanding the noninteraction or role of a particular location.
The Z-factor is a measure of statistical effect size. It has been proposed for use in high-throughput screening (where it is also known as Z-prime, and commonly written as Z' to judge whether the response in a particular assay is large enough to warrant further attention.

In the field of molecular biology, gene expression profiling is the measurement of the activity of thousands of genes at once, to create a global picture of cellular function. These profiles can, for example, distinguish between cells that are actively dividing, or show how the cells react to a particular treatment. Many experiments of this sort measure an entire genome simultaneously, that is, every gene present in a particular cell.
In statistics, particularly in analysis of variance and linear regression, a contrast is a linear combination of variables whose coefficients add up to zero, allowing comparison of different treatments.

Microarray analysis techniques are used in interpreting the data generated from experiments on DNA, RNA, and protein microarrays, which allow researchers to investigate the expression state of a large number of genes - in many cases, an organism's entire genome - in a single experiment. Such experiments can generate very large amounts of data, allowing researchers to assess the overall state of a cell or organism. Data in such large quantities is difficult - if not impossible - to analyze without the help of computer programs.
An MA plot is an application of a Bland–Altman plot for visual representation of genomic data. The plot visualizes the differences between measurements taken in two samples, by transforming the data onto M and A scales, then plotting these values. Though originally applied in the context of two channel DNA microarray gene expression data, MA plots are also used to visualise high-throughput sequencing analysis.
High throughput cell biology is the use of automation equipment with classical cell biology techniques to address biological questions that are otherwise unattainable using conventional methods. It may incorporate techniques from optics, chemistry, biology or image analysis to permit rapid, highly parallel research into how cells function, interact with each other and how pathogens exploit them in disease.
In statistics and regression analysis, moderation occurs when the relationship between two variables depends on a third variable. The third variable is referred to as the moderator variable or simply the moderator. The effect of a moderating variable is characterized statistically as an interaction; that is, a categorical or quantitative variable that affects the direction and/or strength of the relation between dependent and independent variables. Specifically within a correlational analysis framework, a moderator is a third variable that affects the zero-order correlation between two other variables, or the value of the slope of the dependent variable on the independent variable. In analysis of variance (ANOVA) terms, a basic moderator effect can be represented as an interaction between a focal independent variable and a factor that specifies the appropriate conditions for its operation.
Methylated DNA immunoprecipitation is a large-scale purification technique in molecular biology that is used to enrich for methylated DNA sequences. It consists of isolating methylated DNA fragments via an antibody raised against 5-methylcytosine (5mC). This technique was first described by Weber M. et al. in 2005 and has helped pave the way for viable methylome-level assessment efforts, as the purified fraction of methylated DNA can be input to high-throughput DNA detection methods such as high-resolution DNA microarrays (MeDIP-chip) or next-generation sequencing (MeDIP-seq). Nonetheless, understanding of the methylome remains rudimentary; its study is complicated by the fact that, like other epigenetic properties, patterns vary from cell-type to cell-type.
Fold change is a measure describing how much a quantity changes between an original and a subsequent measurement. It is defined as the ratio between the two quantities; for quantities A and B, then the fold change of B with respect to A is B/A. In other words, a change from 30 to 60 is defined as a fold-change of 2. This is also referred to as a "2-fold increase". Similarly, a change from 30 to 15 is referred to as a "2-fold decrease". Fold change is often used when analysing multiple measurements of a biological system taken at different times as the change described by the ratio between the time points is easier to interpret than the difference.

In statistics, a volcano plot is a type of scatter-plot that is used to quickly identify changes in large data sets composed of replicate data. It plots significance versus fold-change on the y and x axes, respectively. These plots are increasingly common in omic experiments such as genomics, proteomics, and metabolomics where one often has a list of many thousands of replicate data points between two conditions and one wishes to quickly identify the most meaningful changes. A volcano plot combines a measure of statistical significance from a statistical test with the magnitude of the change, enabling quick visual identification of those data-points that display large magnitude changes that are also statistically significant.
In statistics, the strictly standardized mean difference (SSMD) is a measure of effect size. It is the mean divided by the standard deviation of a difference between two random values each from one of two groups. It was initially proposed for quality control and hit selection in high-throughput screening (HTS) and has become a statistical parameter measuring effect sizes for the comparison of any two groups with random values.
In statistics, the standardized mean of a contrast variable , is a parameter assessing effect size. The SMCV is defined as mean divided by the standard deviation of a contrast variable. The SMCV was first proposed for one-way ANOVA cases and was then extended to multi-factor ANOVA cases .
In high-throughput screening (HTS), one of the major goals is to select compounds with a desired size of inhibition or activation effects. A compound with a desired size of effects in an HTS screen is called a hit. The process of selecting hits is called hit selection.
In statistics, a c+-probability is the probability that a contrast variable obtains a positive value. Using a replication probability, the c+-probability is defined as follows: if we get a random draw from each group and calculate the sampled value of the contrast variable based on the random draws, then the c+-probability is the chance that the sampled values of the contrast variable are greater than 0 when the random drawing process is repeated infinite times. The c+-probability is a probabilistic index accounting for distributions of compared groups.
The phenotype microarray approach is a technology for high-throughput phenotyping of cells. A phenotype microarray system enables one to monitor simultaneously the phenotypic reaction of cells to environmental challenges or exogenous compounds in a high-throughput manner. The phenotypic reactions are recorded as either end-point measurements or respiration kinetics similar to growth curves.
Transcriptomics technologies are the techniques used to study an organism's transcriptome, the sum of all of its RNA transcripts. The information content of an organism is recorded in the DNA of its genome and expressed through transcription. Here, mRNA serves as a transient intermediary molecule in the information network, whilst non-coding RNAs perform additional diverse functions. A transcriptome captures a snapshot in time of the total transcripts present in a cell. Transcriptomics technologies provide a broad account of which cellular processes are active and which are dormant. A major challenge in molecular biology lies in understanding how the same genome can give rise to different cell types and how gene expression is regulated.
In molecular biology, a batch effect occurs when non-biological factors in an experiment cause changes in the data produced by the experiment. Such effects can lead to inaccurate conclusions when their causes are correlated with one or more outcomes of interest in an experiment. They are common in many types of high-throughput sequencing experiments, including those using microarrays, mass spectrometers, and single-cell RNA-sequencing data. They are most commonly discussed in the context of genomics and high-throughput sequencing research, but they exist in other fields of science as well.
