Economic history of New Zealand

Last updated

Map of New Zealand Map New Zealand-en.svg
Map of New Zealand

The economic history of New Zealand dates to before European colonisation of the country. By the 20th century, it had become one of the most globalized economies in the world, relying heavily on international trade with developed countries including Australia, Canada, China, European Union, the United States, Japan, and South Korea. It is a mixed economy that functions on free-market principles and has a sizable manufacturing and service sector and an efficient agricultural sector. [1] New Zealand has the 54th largest export economy in the world measured by nominal gross domestic product. In 2016, New Zealand exported a total of NZ$35.1billion and imported a total of NZ$35.4 billion, with its top exports being concentrated milk and the top imports being cars. [2] New Zealand has an extremely diverse market economy with a sizable service sector that accounted for 63% of all GDP in 2013. Other industries including mining, manufacturing, waste services, electricity and gas accounted for 16.5% of GDP in 2013 while the primary sector only accounted for 6.5% of GDP, despite continually dominating New Zealand's exports. [3] The biggest capital market for New Zealand is known as the New Zealand Exchange. As of June 2018 the NZX had listed over 300 securities with a market capitalization of NZD $164.5 billion. [4]

Contents

Overview

New Zealand Government Gross Debt as percent of GDP 1860 to 2000 Debt to GDP ratio New Zealand Government timeseriesnotitle 720by540.svg
New Zealand Government Gross Debt as percent of GDP 1860 to 2000

The economy of New Zealand has been listed as seventh in the world for Social Progression, a societal tracker that watches areas such as Basic Human Needs, Foundations of Wellbeing, and the level of Opportunity provided to its residents. [5] However, New Zealand's economy used to be much stronger than it is today. During the 1970s, the New Zealand income level was higher than it was in many of the other countries in Western Europe leading up to the oil shock crisis of this time. Due to the fact that income levels dropped in relative terms and have yet to be able to fully recover, the percentage of New Zealand citizens living in poverty has skyrocketed and there have been further increases in income inequality. Furthermore, New Zealand has dealt with current account deficit issues since the crisis of the 1970s with these deficits peaking in 2006 at −7.8% of GDP, but falling back down to −2.6% of GDP in 2014. [6] Regardless of this, the outstanding government debt, in 2014, stood at 38.4% of GDP and between 1984 and 2006, the debt owed to foreign investors increased 11 times to a total of NZ$182 billion. [7] Undeterred by the current account deficit problems, the difference on external goods and service has typically shown positive gains in the economy. In the 2014 fiscal year exports outpaced imports by NZ$3.9 billion. [6]

Over the last half-century, the government of New Zealand has been able to transform the country from an agrarian-based economy, that was extremely reliant upon the British for access to their markets, to an industrialized, free economy that is able to compete with other highly developed countries on the global scale. [8] Prior to the market crash in 2007, per capita incomes had risen steadily for 10 consecutive years and then receded in 2008 and 2009. However, for the first half of the decade debt-driven spending had driven growth and this, in turn, caused the central bank to continuously raise its key rate from 2004–2008, at which point it was among the highest in the OCED. New Zealand remains focused on expanding its free trade network as a top foreign policy priority as they were one of the earliest backing parties for the Trans Pacific Partnership and the second country to ratify it. [8]

Economy before 1840

Meeting of Settlers and Maoris at Hawke's Bay, New Zealand 1863 Meeting of Settlers and Maoris at Hawke's Bay, New Zealand.jpg
Meeting of Settlers and Maoris at Hawke's Bay, New Zealand

Prior to the arrival of the Europeans in New Zealand, the land was occupied by the Maori. The Maori were Polynesian tribes that had built perennial establishments and exploited the natural resources of the land in order to provide themselves with a way of life. It was around the 15th century that exploitation of these resources slowed down, and the economy went with it. The use of capital during this time, such as clearing forests and building houses, was just enough to cover the population growth and minimal use of capital means that there was little total per-capita economic growth. [9] Some of this slow growth can be attributed to natural events such as; volcanoes, tsunamis, earthquakes, and droughts. It was the warfare between the tribes that kept the economy going during these years as the construction and re-construction of fortifications would have used energy and resources from the tribes. [9]

It was not until the Europeans arrived bringing with them new technologies, ideas, plants, animals, and sources of capital that economic growth was seen in the New Zealand lands again. Many of these European colonies were reliant upon the Maori for food and the Maori obliged by providing the foreigners with goods from their lands. [9] The Maori were keen to trade with the new arrivals and typically bartered with potatoes, corn, and flax for weapons, alcohol, tobacco and most importantly – European tools and products. [10] The relationships between the Maori and the Europeans did not last more than a few decades as the European towns and villages became increasingly self-sustaining and by usurping the fertile lands which the Maori used to grow their crops. [9] By the 1830s, money was becoming widely used among the Maori and it was shortly after this that banks were established in the area.

Growing economy 1840–1930

Banks in New Zealand made a quick entry into society after the Europeans arrived. The first one, The Union Bank of Australia, made its first appearance in Britannia in 1840. [10] It did not take long for others to follow suit and soon there were a large number of banks, state and foreign-owned, that emerged. [11] At first, there was no central authority to regulate or administer the currency and so all banks operated independently and issued their own currency. Today, banks must be registered with the Reserve Bank of New Zealand, which the nation's central bank and issues all the currency. [11] In 1851 the government opened the Colonial Bank of Issue which held the power and ability to issue banknotes, but this did not last long and the bank was closed in 1856. Infrastructure was something that was desperately needed in the young civilization as necessities required to support the economy and society had to be built from the ground up. It was during the 1860s that the settlers began to quarry for a variety of minerals, including gold. Towns and settlements sprung up and flourished near these quarrying sites and they gave the economy a temporary boost as resources were used up and the locals benefited from the business they received. There were long-term benefits from this quarrying as well as the desperately needed roads, railways, ports, and factories were put in place as people moved from site to site. [9]

Gold quickly became the most significant depletable resource of the 19th century in New Zealand. In the 1860s alone, gold export receipts contributed more to the economy than wool did and totalled £46 million by 1890. [12] The gold resource in its entirety was a relatively small one in the world market, but New Zealand was also an extremely small economy in the 1860s.

This boom in the economy allowed Dunedin to become the richest of the New Zealand cities by 1880s, but the citizens soon found they would need another source of capital as the mineral quarrying was largely depleted by the end of the century. The amount of capital the settlers had was declining as they had mainly relied on the capital they had brought with them, upon their arrival, to sustain themselves. Settlements realized there would need to be another product which could be exported to generate revenue to pay for the upkeep of infrastructure and repay their debts. Wool became New Zealand's first large export staple, exported from the Wellington settlement towards the end of the 1850s. New Zealand began to produce and export staple goods at a rapid pace and it helped shape society as well as establish a tone for economic growth, none of which would have happened without the invention of refrigeration in 1882. This new technology allowed New Zealand to export frozen products such as meats and dairy to markets that had been thought of as unreachable. [13] The economy relied largely on the exportation of dairy, meat and wool for the next 100 years.

Depression

From the late 1870s to the mid-1890s, New Zealand experienced a depression that was the result of quarrying a finite amount of resources and part of the worldwide Long Depression. The depression was foreshadowed by the closing of the City Bank of Glasgow in 1878, which in turn led to a reduction of credit that was available to New Zealand. Many farmers lost their homes and lands and turned to "sweating" in the factories because of a lack of jobs for rural workers. Fewer immigrants arrived as people began emigrating to Australia. In 1888 there were 10,000 more people that left New Zealand than arrived and during the years of the depression, 1881–1890, the overall gain from migration was just 40,000. [14]

Trade

The foreign trade of New Zealand was of the Heckscher-Ohlin variety. Throughout the late nineteenth and early twentieth centuries, New Zealand's trade policy was mildly protective, encouraging the development of some light manufacturing, particularly following the Customs and Excise Act of 1888. [15] Britain accounted for the vast majority of both New Zealand's (primary-sector) exports and its (secondary-sector) imports. In the 1890s, the share of New Zealand's imports from the United States and Germany began to increase. One response of policymakers was the adoption of a policy of imperial preference in 1903, but this policy had little effect on New Zealand's imports from Britain. [16]

1930–1990

Reserve Bank of New Zealand Reserve Bank of New Zealand (34216063542).jpg
Reserve Bank of New Zealand

It was not until the 1930s that New Zealand established its own central bank titled The Reserve Bank of New Zealand, it was established in 1934 and was constituted under the Reserve Bank of New Zealand Act of 1989 with its primary purpose being to provide "stability in the general level of prices". [9] Before then, all monetary policy was decided in the United Kingdom and New Zealand Pound, which was the currency until 1967, was issued by independent, private banks. One of the first measures the new central bank took was to give itself the ability to implement its own economic agenda as it saw fit and quickly took strides to better defend the economy and people from the world markets.

By the middle of the century, pastoral products made up over 90% of the country's exports with more than 60% of that going towards the British market, which established a heavy reliance upon Britain for access to its markets. Growth and production were strong and consistent beginning in 1935 following the Great Depression and lasting through the Second World War as both men and women worked outside of the home to contribute to the war. The economy slowed down following the end of the war, but surged again from the 1950s through the 1960s and was brought about by high demand for pastoral products and a labor force that was growing fast enough to fit right into the growing manufacturing sector. Trading had never been better for New Zealand and prices skyrocketed for virtually all of their exporting products, which meant that New Zealand was quickly climbing up the income rankings. During the 1950s, the income per-capita in New Zealand was 88% of that in the United States. [10] This was helped by tough import controls, which gave the local manufacturers the ability to manufacture nearly identical products locally, expand their factories and operations, and compete against the much higher priced imports. The Reserve Bank's primary role during this time was to implement and handle the effects of the fluctuations in government spending as the inflation rates remained low through the end of the 1960s.

The 1950s were exceptionally prosperous for New Zealand, but it was evident that Britain was beginning to look elsewhere in Europe for trading partners. This meant that New Zealand would have to struggle for access to the markets it once supplied with its products, especially once the United Kingdom joined the EEC in 1973 [17] and all trade agreements with New Zealand officially came to an end. At the end of 1966, the price of wool was cut by 40% as it was replaced by a synthetic fiber and this posed a large issue for New Zealand as wool was one of its top exports and the entire economy underwent a diversification period as its solution.

New Zealand began looking for an alternative source of capital via exporting goods as it was no longer able to trade with Britain. The loss of wool in 1966 and the depression of dairy and meat prices meant that change had to happen fast if the economy was to still operate at a functioning level. Through the 1960s, New Zealand had operated by exporting pastoral products such as dairy, meat, and wool. By 2008 the single biggest export good was tourism, bringing in over a quarter of the total export revenue and in 2017 export goods had increased another NZ$406 million. [18] Other forms of diversification are still present; pharmaceuticals, milk powders and fine wool garments.

Think Big

New Zealand money supply and inflation
.mw-parser-output .legend{page-break-inside:avoid;break-inside:avoid-column}.mw-parser-output .legend-color{display:inline-block;min-width:1.25em;height:1.25em;line-height:1.25;margin:1px 0;text-align:center;border:1px solid black;background-color:transparent;color:black}.mw-parser-output .legend-text{}
M3 money supply increases
Housing inflation
Consumer price index New Zealand money supply and inflation.webp
New Zealand money supply and inflation
  M3 money supply increases
  Housing inflation

New Zealand Prime Minister Sir Robert Muldoon was the face behind the Think Big strategy that was implemented during his time at the head of the National party. This strategy was devised to establish 400,000 jobs, following the second oil shock in 1979, and push New Zealand toward being self-sufficient in the energy sector. Massive industrial plants were built on New Zealand's natural gas reserves and a wide variety of new products for export such as ammonia, urea fertilizer, methanol, and petrol were produced. [9] However, bad timing struck and many of these projects were available for use right as oil prices hit the ground, dropping from US$90 a barrel to US$30 a barrel within a few years. Due to these Think Big projects requiring capital to get started, the public debt shot through the roof from NZ$4.2 billion to a staggering NZ$21.9 billion 9 years later when Muldoon left the position of Prime Minister. It has been speculated that these debts have cost taxpayers over NZ$7 billion since the early 1980s. [19]

Reform

Roger Douglas Roger Douglas, 1965.jpg
Roger Douglas

Between the years of 1984 and 1990, New Zealand underwent a period of large reform on the components that guide the economy and public administration. These reforms are sometimes referred to as Rogernomics, named after the Minister of Finance, Roger Douglas, who carried them out. [20] There were a large number of changes to the economy and how it was run during Douglas' time as Minister of Finance, some of the changes included making the Reserve Bank independent of political decisions, subsidy-free agriculture, loosening import regulations, removing controls on interest rates, and more. These changes continued to be implemented under two different governments, helping to solve a wide range of economic restructuring and governmental problems, as well as generating a substantial amount of social change. New Zealand relied heavily on privatization to help with its reform period by selling off telecommunications, airlines, computing services, government printing offices, and many others. The government decided that many agencies in the economy should be viewed as profit-making and tax-paying enterprises. [21]

Open economy

New Zealand gross domestic product and net international debt NzGDPdata 720by540.svg
New Zealand gross domestic product and net international debt

New Zealand's economy entered into the longest period of significant growth in 1998 and lasted until 2006. This growth came as a result of a newly diversified and deregulated economy and benefitted the economy a great deal. For the first time in history, New Zealand was running long-term fiscal surpluses in the OECD and unemployment had fallen to never before seen levels. [10] Despite these improvements, the country remained stagnant on the international income ranking level due to higher interest rates stemming from an unwillingness to save. Nonetheless, New Zealand is still a top choice for foreign investors which totalled NZ$107.69 billion in 2014, a statistic which has increased more than 1,000 times over since 1989 when foreign investment totalled NZ$9.7 billion. [22]

Economic outlook

Since the 1980s, New Zealand has gone from being one of the most heavily regulated economies in the OECD to one of the least regulated and most free market economy. Projecting an increase in growth of 3% for 2018, OECD believes that steady growth "will continue to be driven by strong tourism demand from Asia and increases in dairy exports". [23] The stock market continues to show strong growth as well, rising 22% in 2017, held up by the economy growing at a rate that is above its long-term trend. GDP is forecasted to increase as well due to strong tourism growth, low-interest rates, and high net migration. [24]

Strong economic performance in the near term would greatly benefit New Zealand, but demand from government spending could be weaker than projected if the implementation of policy is slower than expected. [25]

Related Research Articles

<span class="mw-page-title-main">Economy of Armenia</span>

The economy of Armenia grew by 12.6% in 2022, according to the country's Statistical Committee and the International Monetary Fund. Total output amounted to 8.5 trillion Armenian drams, or $19.5 billion. At the same time, Armenia's foreign trade turnover significantly accelerated in growth from 17.7% in 2021 to 68.6% in 2022. GDP contracted sharply in 2020 by 7.2%, mainly due to the COVID-19 recession and the war against Azerbaijan. In contrast it grew by 7.6 per cent in 2019, the largest recorded growth since 2007, while between 2012 and 2018 GDP grew 40.7%, and key banking indicators like assets and credit exposures almost doubled.

<span class="mw-page-title-main">Economy of Chile</span>

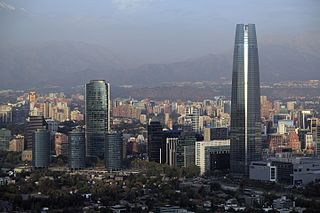
The economy of Chile is a market economy and high-income economy as ranked by the World Bank. The country is considered one of South America's most prosperous nations, leading the region in competitiveness, income per capita, globalization, economic freedom, and low perception of corruption. Although Chile has high economic inequality, as measured by the Gini index, it is close to the regional mean.

<span class="mw-page-title-main">Economy of Cyprus</span>

The economy of Cyprus is a high-income economy as classified by the World Bank, and was included by the International Monetary Fund in its list of advanced economies in 2001. Cyprus adopted the euro as its official currency on 1 January 2008, replacing the Cypriot pound at an irrevocable fixed exchange rate of CYP 0.585274 per €1.

<span class="mw-page-title-main">Economy of Denmark</span>

The economy of Denmark is a modern high-income and highly developed mixed economy. The economy of Denmark is dominated by the service sector with 80% of all jobs, whereas about 11% of all employees work in manufacturing and 2% in agriculture. The nominal gross national income per capita was the ninth-highest in the world at $68,827 in 2023.

<span class="mw-page-title-main">Economy of New Zealand</span>

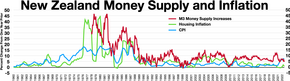
The economy of New Zealand is a highly developed free-market economy. It is the 52nd-largest national economy in the world when measured by nominal gross domestic product (GDP) and the 62nd-largest in the world when measured by purchasing power parity (PPP). New Zealand has one of the most globalised economies and depends greatly on international trade, mainly with China, Australia, the European Union, the United States, and Japan. New Zealand's 1983 Closer Economic Relations agreement with Australia means that the economy aligns closely with that of Australia.

<span class="mw-page-title-main">Economy of Nicaragua</span>

The economy of Nicaragua is focused primarily on the agricultural sector. Nicaragua itself is the least developed country in Central America, and the second poorest in the Americas by nominal GDP. In recent years, under the administrations of Daniel Ortega, the Nicaraguan economy has expanded somewhat, following the Great Recession, when the country's economy actually contracted by 1.5%, due to decreased export demand in the American and Central American markets, lower commodity prices for key agricultural exports, and low remittance growth. The economy saw 4.5% growth in 2010 thanks to a recovery in export demand and growth in its tourism industry. Nicaragua's economy continues to post growth, with preliminary indicators showing the Nicaraguan economy growing an additional 5% in 2011. Consumer Price inflation have also curtailed since 2008, when Nicaragua's inflation rate hovered at 19.82%. In 2009 and 2010, the country posted lower inflation rates, 3.68% and 5.45%, respectively. Remittances are a major source of income, equivalent to 15% of the country's GDP, which originate primarily from Costa Rica, the United States, and European Union member states. Approximately one million Nicaraguans contribute to the remittance sector of the economy.

<span class="mw-page-title-main">Economy of Poland</span>

The economy of Poland is an industrialised, mixed economy with a developed market that serves as the sixth-largest in the European Union by nominal GDP and fifth-largest by GDP (PPP). Poland boasts the extensive public services characteristic of most developed economies. Since 1988, Poland has pursued a policy of economic liberalisation but retained an advanced public welfare system. This includes universal free public healthcare and education, extensive provisions of free public childcare, and parental leave. The country is considered by many to be a successful post-communist state. It is classified as a high-income economy by the World Bank, ranking 20th worldwide in terms of GDP (PPP), 21st in terms of GDP (nominal), and 21st in the 2023 Economic Complexity Index.

<span class="mw-page-title-main">Economy of Pakistan</span>

The economy of Pakistan is categorized as a developing economy. It ranks as the 24th-largest based on GDP using purchasing power parity (PPP) and the 46th largest in terms of nominal GDP. With a population of 241.5 million people as of 2023, Pakistan’s position at per capita income ranks 161st by GDP (nominal) and 138th by GDP (PPP) according to the International Monetary Fund (IMF).

<span class="mw-page-title-main">Economy of Paraguay</span>

The economy of Paraguay is a market economy that is highly dependent on agriculture products. In recent years, Paraguay's economy has grown as a result of increased agricultural exports, especially soybeans. Paraguay has the economic advantages of a young population and vast hydroelectric power. Its disadvantages include the few available mineral resources, and political instability. The government welcomes foreign investment.

<span class="mw-page-title-main">Economy of Senegal</span>

The economy of Senegal is driven by mining, construction, tourism, fishing and agriculture, which are the main sources of employment in rural areas, despite abundant natural resources in iron, zircon, gas, gold, phosphates, and numerous oil discoveries recently. Senegal's economy gains most of its foreign exchange from fish, phosphates, groundnuts, tourism, and services. As one of the dominant parts of the economy, the agricultural sector of Senegal is highly vulnerable to environmental conditions, such as variations in rainfall and climate change, and changes in world commodity prices.

<span class="mw-page-title-main">Economy of Switzerland</span>

The economy of Switzerland is one of the world's most advanced and a highly-developed free market economy. The economy of Switzerland has ranked first in the world since 2015 on the Global Innovation Index and third in the 2020 Global Competitiveness Report. According to United Nations data for 2016, Switzerland is the third richest landlocked country in the world after Liechtenstein and Luxembourg. Together with the latter and Norway, they are the only three countries in the world with a GDP per capita (nominal) above US$90,000 that are neither island nations nor ministates.

<span class="mw-page-title-main">Economy of Uruguay</span>

The economy of Uruguay features an export-oriented agricultural sector and a well-educated workforce, along with high levels of social spending. Tourism and banking are also prominent sectors; Uruguay acts as a regional hub for international finance and tourism. The country also has a history and representation of advanced workers-rights protection, with unions and the eight-hour work-day protected at the beginning of the 20th century.

<span class="mw-page-title-main">Economy of Africa</span>

The economy of Africa consists of the trade, industry, agriculture, and human resources of the continent. As of 2019, approximately 1.3 billion people were living in 53 countries in Africa. Africa is a resource-rich continent. Recent growth has been due to growth in sales, commodities, services, and manufacturing. West Africa, East Africa, Central Africa and Southern Africa in particular, are expected to reach a combined GDP of $29 trillion by 2050.

<span class="mw-page-title-main">Economy of the European Union</span>

The economy of the European Union is the joint economy of the member states of the European Union (EU). It is the second largest economy in the world in nominal terms, after the United States, and the third largest at purchasing power parity (PPP), after China and the US. The European Union's GDP is estimated to be $19.35 trillion (nominal) in 2024 or $26.64 trillion (PPP), representing around one-sixth of the global economy. Germany has the biggest national GDP of all EU countries, followed by France and Italy.

<span class="mw-page-title-main">Economic history of Brazil</span>

The economic history of Brazil covers various economic events and traces the changes in the Brazilian economy over the course of the history of Brazil. Portugal, which first colonized the area in the 16th century, enforced a colonial pact with Brazil, an imperial mercantile policy, which drove development for the subsequent three centuries. Independence was achieved in 1822. Slavery was fully abolished in 1888. Important structural transformations began in the 1930s, when important steps were taken to change Brazil into a modern, industrialized economy.

The economic history of the Republic of Turkey had four eras or periods. The first era had the development policy emphasizing private accumulation between 1923 and 1929. The second era had the development policy emphasized state accumulation in a period of global crises between 1929 and 1945. The third era was state-guided industrialization based on import-substituting protectionism between 1950 and 1980. The final, era was the opening of the economy to liberal trade in goods, services and financial market transactions since 1981.

<span class="mw-page-title-main">Agriculture in New Zealand</span> Overview of agriculture in New Zealand

In New Zealand, agriculture is the largest sector of the tradable economy. The country exported NZ$46.4 billion worth of agricultural products in the 12 months to June 2019, 79.6% of the country's total exported goods. The agriculture, forestry and fisheries sector directly contributed $12.653 billion of the national GDP in the 12 months to September 2020, and employed 143,000 people, 5.9% of New Zealand's workforce, as of the 2018 census.

The economic history of Ecuador covers the development of Ecuador's economy throughout its history, beginning with colonization by the Spanish Empire, through independence and up to the 21st century.

<span class="mw-page-title-main">Economy of Argentina</span>

The economy of Argentina is the second-largest national economy in South America, behind Brazil. Argentina is a developing country with a highly literate population, an export-oriented agricultural sector, and a diversified industrial base.

<span class="mw-page-title-main">Economy of the Western Cape</span>

The economy of the Western Cape in South Africa is dominated by the city of Cape Town, which accounted for 72% of the Western Cape's economic activity in 2016. The single largest contributor to the region's economy is the financial and business services sector, followed by manufacturing. Close to 30% of the gross regional product comes from foreign trade with agricultural products and wine dominating exports. High-tech industries, international call centres, fashion design, advertising and TV production are niche industries rapidly gaining in importance.

References

  1. "The New Zealand economy | The Treasury New Zealand". treasury.govt.nz. Retrieved 13 November 2018.
  2. "OEC – New Zealand (NZL) Exports, Imports, and Trade partners". atlas.media.mit.edu. Retrieved 13 November 2018.
  3. "New Zealand in Profile: 2014". Stats NZ. NZ.Stat.
  4. "Monthly Shareholder Metrics" (PDF). New Zealand's Exchange.
  5. "New Zealand – The Social Progress Imperative". 5 February 2015. Archived from the original on 5 February 2015. Retrieved 13 November 2018.
  6. 1 2 "National Accounts (Income and Expenditure): Year ended March 2014 – corrected". archive.stats.govt.nz. Archived from the original on 26 January 2015. Retrieved 13 November 2018.
  7. "Matt McCarten: Foreign owners muscle in as New Zealand sells off all its assets". NZ Herald. 13 January 2007. ISSN   1170-0777 . Retrieved 13 November 2018.
  8. 1 2 "The World Factbook – Central Intelligence Agency". www.cia.gov. Retrieved 13 November 2018.
  9. 1 2 3 4 5 6 7 Taonga, New Zealand Ministry for Culture and Heritage Te Manatu. "1. – Economic history – Te Ara Encyclopedia of New Zealand" . Retrieved 13 November 2018.
  10. 1 2 3 4 "The Reserve Bank and New Zealand's Economic History" (PDF).
  11. 1 2 "New Zealand – Economy". Encyclopedia Britannica. Retrieved 13 November 2018.
  12. Hawke, G.R. (1982). The Making of New Zealand: An Economic History.
  13. "Refrigeration: underpinning the New Zealand economy for over 125 years" (PDF).
  14. Taonga, New Zealand Ministry for Culture and Heritage Te Manatu. "10. – History of immigration – Te Ara Encyclopedia of New Zealand" . Retrieved 13 November 2018.
  15. Hawke, Gary (1985). The Making of New Zealand. Cambridge: Cambridge University Press.
  16. Varian, Brian D. (19 January 2022). "Imperial preference before the Ottawa Agreements: Evidence from New Zealand's Preferential and Reciprocal Trade Act of 1903". The Economic History Review. 75 (4): 1214–1241. doi:10.1111/ehr.13142. ISSN   0013-0117. S2CID   246067932.
  17. Grier, Kevin B.; Munger, Michael C. (2021). "Breaking up is hard to do: Lessons from the strange case of New Zealand". Social Science Quarterly. 102 (6): 2565–2577. doi:10.1111/ssqu.13047. ISSN   1540-6237. S2CID   239638636.
  18. "Goods and Services Trade" (PDF).
  19. Hembry, Owen Hembry, Owen (30 January 2011). "In the shadow of Think Big". NZ Herald. ISSN   1170-0777 . Retrieved 13 November 2018.{{cite news}}: CS1 maint: multiple names: authors list (link)
  20. Easton, Brian (1994). Economic and Other Ideas Behind the New Zealand Reforms. Oxford Review of Economic Policy. p. 78.
  21. "New Zealand's remarkable economic transformation – Institute of Economic Affairs". iea.org.uk. Retrieved 13 November 2018.
  22. "Balance of Payments and International Investment Position: Year ended 31 March 2014". archive.stats.govt.nz. Retrieved 13 November 2018.
  23. "New Zealand" (PDF). OECD Economic Surveys.
  24. "Half Year Economic and Fiscal Update 2017 | The Treasury New Zealand". treasury.govt.nz. 14 December 2017. Retrieved 13 November 2018.
  25. "New Zealand: Staff Concluding Statement of the 2018 Article IV Mission". IMF. Retrieved 13 November 2018.

Further reading