Egmont (electoral district)

Last updated

Egmont
Flag of Prince Edward Island.svg Prince Edward Island electoral district
Egmont, riding.png
Egmont in relation to the other Prince Edward Island ridings
Coordinates: 46°36′40″N64°00′25″W / 46.611°N 64.007°W / 46.611; -64.007
Federal electoral district
Legislature House of Commons
MP


Bobby Morrissey
Liberal
District created1966
First contested 1968
Last contested 2021
District webpage profile, map
Demographics
Population (2016) [1] 34,168
Electors (2019)28,400
Area (km²) [1] 1,527
Pop. density (per km²)22.4
Census division(s) Prince
Census subdivision(s)Cities:
Summerside
Towns:
Alberton
Miscouche
O'Leary
Villages:
Abram Village, Linkletter, Miminegash, St. Louis, Sherbrooke, Tignish, Tyne Valley, Wellington
First Nations reserves:
Lennox Island 1
Lots:
Lot 1, 2, 3, 4, 5, 6, 7, 8, 9, 10, 11, 12, 13, 14, 15, 16, 17

Egmont is a federal electoral district in Prince Edward Island, Canada, that has been represented in the House of Commons of Canada since 1968. Its population in 2021 was 35,925. [2]

Contents

Following the 2022 Canadian federal electoral redistribution, at the first election held after April 22, 2024. It will gain the Bedeque area plus some areas east and southeast of Summerside from Malpeque. [3]

Demographics

Ethnic groups: 98.0% White, 1.4% Native Canadian
Languages: 87.9% English, 10.9% French
Religions: 54.1% Catholic, 38.4% Protestant, 1.8% Other Christian, 5.5% no affiliation
Average income: $22,065

According to the 2016 Canadian census

Geography

The district includes the part of Prince County located in Summerside and west of Summerside. Communities include Summerside, Alberton, Tignish, O'Leary, Miscouche and Sherbrooke. The area is 1,527 km2.

History

The electoral district was created in 1966 from Prince riding. There were no boundary changes as a result of the 2012 federal electoral redistribution.

Members of Parliament

This riding has elected the following members of Parliament:

ParliamentYearsMemberParty
Egmont
Riding created from Prince
28th  1968–1972   David MacDonald Progressive Conservative
29th  1972–1974
30th  1974–1979
31st  1979–1980
32nd  1980–1984   George Henderson Liberal
33rd  1984–1988
34th  1988–1993 Joe McGuire
35th  1993–1997
36th  1997–2000
37th  2000–2004
38th  2004–2006
39th  2006–2008
40th  2008–2011   Gail Shea Conservative
41st  2011–2015
42nd  2015–2019   Bobby Morrissey Liberal
43rd  2019–2021
44th  2021–present

Election results

Graph of election results in Egmont (minor parties that never got 2% of the vote or didn't run consistently are omitted)
2021 Election by Polling Area 2021 Canadian Federal Election in Egmont.svg
2021 Election by Polling Area

2021

2021 Canadian federal election
PartyCandidateVotes%±%Expenditures
Liberal Bobby Morrissey 9,04046.21+6.48$52,360.87
Conservative Bobby Balsom6,08831.11-3.26$45,649.91
Green Alex Clark1,7719.05-10.76$5,606.29
New Democratic Lisa Bradshaw1,6888.63+2.53$3,620.46
People's Wayne Biggar9744.98$0.00
Total valid votes/expense limit19,56198.77+0.11$89,655.36
Total rejected ballots2441.23-0.11
Turnout19,80569.32-3.12
Eligible voters28,571
Liberal hold Swing +4.89
Source: Elections Canada [5] [6]

2019

2019 Canadian federal election
PartyCandidateVotes%±%Expenditures
Liberal Bobby Morrissey 8,01639.73−9.52$53,702.84
Conservative Logan McLellan6,93434.36+5.41$65,608.31
Green Alex Clark3,99819.81+17.20$14,320.88
New Democratic Sharon Dunn1,2306.10−13.08$0.00
Total valid votes/expense limit20,17898.66 $85,525.15
Total rejected ballots2741.34+0.93
Turnout20,45271.62−5.37
Eligible voters28,557
Liberal hold Swing −7.46
Source: Elections Canada [7]

2015

2015 Canadian federal election
PartyCandidateVotes%±%Expenditures
Liberal Bobby Morrissey 10,52149.25+17.94$67,240.83
Conservative Gail Shea 6,18528.95–25.70$110,058.32
New Democratic Herb Dickieson 4,09719.18+6.81$34,718.49
Green Nils Ling5592.62+0.95$4,895.27
Total valid votes/expense limit21,36299.59 $169,928.60
Total rejected ballots870.41–0.39
Turnout21,44977.29+5.62
Eligible voters27,751
Liberal gain from Conservative Swing +21.82
Source: Elections Canada [8] [9]

2011

2011 Canadian federal election
PartyCandidateVotes%±%Expenditures
Conservative Gail Shea 10,46754.65+10.72$57,565.04
Liberal Guy Gallant5,99731.31-12.32$34,428.58
New Democratic Jacquie Robichaud2,36912.37+3.32$1,780.97
Green Carl Anthony3201.67-1.72$250.00
Total valid votes/expense limit19,153100.0   $69,831.16
Total rejected, unmarked and declined ballots 155 0.80+0.18
Turnout19,308 71.67+3.52
Eligible voters26,941
Conservative hold Swing +11.52
Sources: [10] [11]

2008

2008 Canadian federal election
PartyCandidateVotes%±%Expenditures
Conservative Gail Shea 8,11043.93+12.97$51,795.67
Liberal Keith Milligan 8,05543.63-9.54$45,007.86
New Democratic Orville Lewis1,6709.05-0.50$2,245.18
Green Rebecca Ridlington6263.39-1.80$2,678.98
Total valid votes/expense limit 18,461 100.0    $67,686
Total rejected, unmarked and declined ballots1150.62+0.01
Turnout18,57668.15-3.57
Eligible voters27,256
Conservative gain from Liberal Swing +11.26

2006

2006 Canadian federal election
PartyCandidateVotes%±%Expenditures
Liberal Joe McGuire 10,28853.17-2.28$35,567.52
Conservative Edward Guergis5,99130.96+1.87$58,124.34
New Democratic Regena Kaye Russell1,8479.55-2.03$3,843.89
Green Ron Matsusaki1,0055.19+1.30$2,768.32
Independent Michael Nesbitt2191.13$2,449.39
Total valid votes/expense limit19,350 100.0   $62,678
Total rejected, unmarked and declined ballots1190.61-0.11
Turnout19,46971.72+4.31
Eligible voters27,146
Liberal hold Swing -2.08

2004

2004 Canadian federal election
PartyCandidateVotes%±%Expenditures
Liberal Joe McGuire 10,22055.44+5.48$35,746.29
Conservative Reg Harper5,36329.09-14.77$32,667.92
New Democratic Regena Kaye Russell2,13311.57+5.39$10,211.62
Green Irené Novaczek7173.89$1,199.66
Total valid votes/expense limit18,433100.0   $61,338
Total rejected, unmarked and declined ballots1340.72
Turnout18,56767.41
Eligible voters27,545
Liberal notional hold Swing +10.03
Changes from 2000 are based on redistributed results. Change for the Conservatives is based on the combined totals of the Progressive Conservatives and the Canadian Alliance.
2000 federal election redistributed results
PartyVote %
  Liberal 8,99949.96
  Progressive Conservative 6,99438.83
  New Democratic 1,1146.18
  Alliance 9075.03

2000

2000 Canadian federal election
PartyCandidateVotes%±%
Liberal Joe McGuire 9,22750.05+1.63
Progressive Conservative John Griffin7,11638.60-5.58
New Democratic Nancy Wallace1,1396.18-1.23
Alliance Jeff Sullivan9525.16
Total valid votes18,434 100.00

1997

1997 Canadian federal election
PartyCandidateVotes%±%
Liberal Joe McGuire 8,49848.42-9.29
Progressive Conservative John J. MacDonald7,75444.18+6.70
New Democratic Adelard Pitre1,3007.41+2.60
Total valid votes17,552100.00

1993

1993 Canadian federal election
PartyCandidateVotes%±%
Liberal Joe McGuire 10,54757.71+4.62
Progressive Conservative Basil Stewart 6,85037.48-1.92
New Democratic Basil Brian Dumville8804.81-2.71
Total valid votes18,277100.00

1988

1988 Canadian federal election
PartyCandidateVotes%±%
Liberal Joe McGuire 10,15853.09+3.31
Progressive Conservative Prowse Chappell7,53839.40-5.18
New Democratic Irene N. Dyment1,4387.52+1.88
Total valid votes19,134100.00

1984

1984 Canadian federal election
PartyCandidateVotes%±%
Liberal George Henderson 8,77749.78-2.59
Progressive Conservative George Dewar7,85944.58+1.95
New Democratic Wain Munro9945.64+0.64
Total valid votes17,630100.00

1980

1980 Canadian federal election
PartyCandidateVotes%±%
Liberal George Henderson 8,63952.37+12.93
Progressive Conservative David MacDonald 7,03342.63-13.44
New Democratic Vincent Gallant8245.00+0.51
Total valid votes16,496100.00

1979

1979 Canadian federal election
PartyCandidateVotes%±%
Progressive Conservative David MacDonald 8,86156.07+3.82
Liberal Bill Reese6,23339.44-4.81
New Democratic Vincent Gallant7104.49+0.98
Total valid votes15,804100.00

1974

1974 Canadian federal election
PartyCandidateVotes%±%
Progressive Conservative David MacDonald 7,58352.25-3.53
Liberal Bill Reese6,42244.25+3.97
New Democratic Cletus Shea5093.51-0.04
Total valid votes14,514100.00

1972

1972 Canadian federal election
PartyCandidateVotes%±%
Progressive Conservative David MacDonald 7,86855.78+2.26
Liberal George W. Olscamp5,68140.28-4.02
New Democratic Carroll L. Kadey5013.55+1.37
Social Credit Hugh G. Ryan550.39
Total valid votes14,105100.00

1968

1968 Canadian federal election
PartyCandidateVotes%
Progressive Conservative David MacDonald 7,18253.52
Liberal J. Melville Campbell5,94544.30
New Democratic Harvey Dawson2922.18
Total valid votes13,419100.00

Student vote results

2011

In 2011, a student vote was conducted at participating Canadian schools to parallel the 2011 Canadian federal election results. The vote was designed to educate students and simulate the electoral process for persons who have not yet reached the legal majority. Schools with a large student body that reside in another electoral district had the option to vote for candidates outside of the electoral district then where they were physically located. [12]

2011 Canadian federal election
PartyCandidateVotes%
Conservative Gail Shea47529.87
Liberal Guy Gallant40725.60
Green Carl Anthony39124.59
New Democratic Jacquie Robichaud31719.94
Total valid votes1,590100.00

See also

Related Research Articles

<span class="mw-page-title-main">Cardigan (electoral district)</span> Federal electoral district in Prince Edward Island, Canada

Cardigan is a federal electoral district in Prince Edward Island, Canada, that has been represented in the House of Commons of Canada since 1968.

<span class="mw-page-title-main">Cape Breton—Canso</span> Federal electoral district in Nova Scotia, Canada

Cape Breton—Canso is a federal electoral district in Nova Scotia, Canada, that has been represented in the House of Commons of Canada since 2004. Its population in 2011 was 75,247. It is the successor to Bras d'Or, which was represented in the House of Commons from 1997 to 2004.

<span class="mw-page-title-main">Acadie—Bathurst</span> Federal electoral district in New Brunswick, Canada

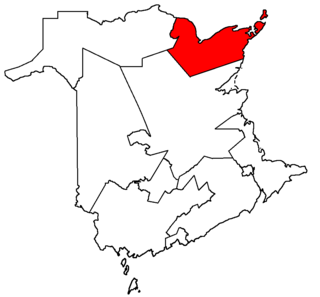
Acadie—Bathurst is a federal electoral district in New Brunswick, Canada, that has been represented in the House of Commons of Canada since 1867.

<span class="mw-page-title-main">Charlottetown (electoral district)</span> Federal electoral district in Prince Edward Island, Canada

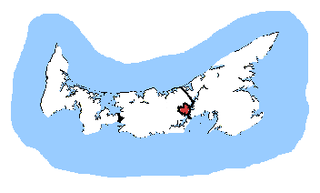
Charlottetown is a federal electoral district in Prince Edward Island, Canada, that has been represented in the House of Commons of Canada since 2004. The district, which includes the entire City of Charlottetown, has an area of 46 km2 and a population of 34,562 as of 2011.

<span class="mw-page-title-main">St. John's South—Mount Pearl</span> Federal electoral district in Newfoundland and Labrador, Canada

St. John's South—Mount Pearl is a federal electoral district in Newfoundland and Labrador, Canada, that has been represented in the House of Commons of Canada since 2004.

<span class="mw-page-title-main">Malpeque (electoral district)</span> Federal electoral district in Prince Edward Island, Canada

Malpeque is a federal electoral district in Prince Edward Island, Canada, that has been represented in the House of Commons of Canada since 1968. Its population in 2011 was 35,039.

<span class="mw-page-title-main">Dartmouth—Cole Harbour</span> Federal electoral district in Nova Scotia, Canada

Dartmouth—Cole Harbour is a federal electoral district in Nova Scotia, Canada, that has been represented in the House of Commons of Canada since 2004.

<span class="mw-page-title-main">Fredericton (federal electoral district)</span> Federal electoral district in New Brunswick, Canada

Fredericton is a federal electoral district in New Brunswick, Canada, that has been represented in the House of Commons of Canada since 1988. Its population in 2021 was 87,436. Its predecessor riding, York—Sunbury, was represented in the House of Commons from 1917 to 1988. Following the 2022 Canadian federal electoral redistribution, the riding will be re-named Fredericton—Oromocto, at the first election held after approximately April 2024. Its border with Tobique—Mactaquac will be rerouted to follow the northern border of the City of Fredericton, and it will lose the remainder of the Parishes of Maugerville, Sheffield and Canning to Miramichi—Grand Lake; and will lose Burton Parish to Saint John—St. Croix, except for those parts of the parish that will be transferred to the Town of Oromocto in 2023.

<span class="mw-page-title-main">Halifax West</span> Federal electoral district in Nova Scotia, Canada

Halifax West is a federal electoral district in Nova Scotia, Canada, that has been represented in the House of Commons of Canada since 1979. Its population in 2021 was 111,944.

<span class="mw-page-title-main">Richmond Centre (federal electoral district)</span> Federal electoral district in British Columbia, Canada

Richmond Centre is a federal electoral district in British Columbia, Canada, that has been represented in the House of Commons of Canada since 1988.

<span class="mw-page-title-main">Renfrew—Nipissing—Pembroke (federal electoral district)</span> Federal electoral district in Ontario, Canada

Renfrew—Nipissing—Pembroke is a federal electoral district in Ontario, Canada, that has been represented in the House of Commons since 1979.

<span class="mw-page-title-main">Brantford—Brant (federal electoral district)</span> Federal electoral district in Ontario, Canada

Brantford—Brant is a federal electoral district in Ontario, Canada, that has been represented in the House of Commons of Canada from 1904 to 1949 and since 1968.

<span class="mw-page-title-main">Montcalm (federal electoral district)</span> Federal electoral district in Quebec, Canada

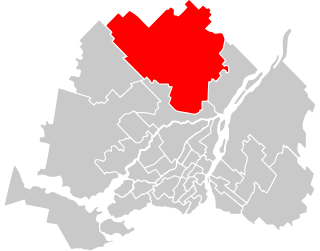
Montcalm is a federal electoral district in Quebec, Canada, which has been represented in the House of Commons of Canada from 1867 to 1917 and since 2004.

<span class="mw-page-title-main">Dufferin—Caledon</span> Federal electoral district in Ontario, Canada

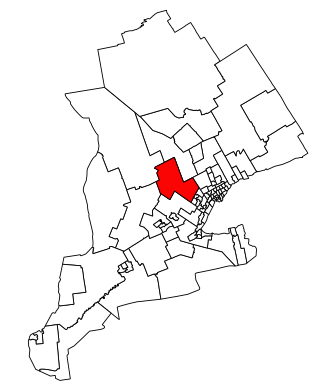
Dufferin—Caledon is a federal electoral district in Ontario, Canada, that has been represented in the House of Commons of Canada since 2004.

<span class="mw-page-title-main">Elgin—Middlesex—London (federal electoral district)</span> Federal electoral district in Ontario, Canada

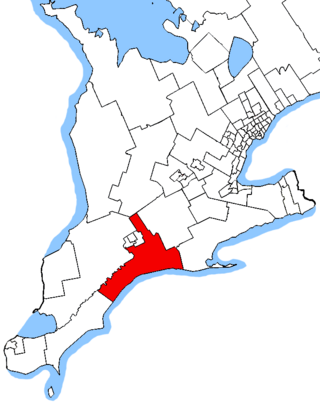
Elgin—Middlesex—London is a federal electoral district in Ontario, Canada, that has been represented in the House of Commons of Canada since 1997.

<span class="mw-page-title-main">Niagara Falls (federal electoral district)</span> Federal electoral district in Ontario, Canada

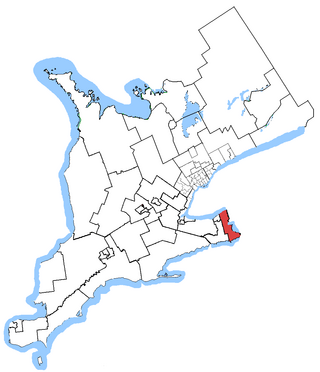
Niagara Falls is a federal electoral district in Ontario, Canada, that has been represented in the House of Commons of Canada since 1953.

<span class="mw-page-title-main">Nipissing—Timiskaming</span> Federal electoral district in Ontario, Canada

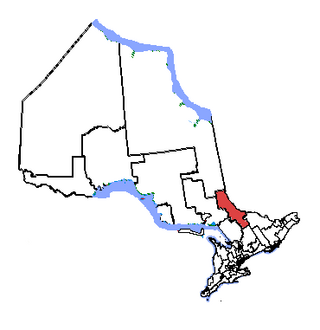
Nipissing—Timiskaming is a federal electoral district in Ontario, Canada, that has been represented in the House of Commons of Canada since 2004. The riding was formed by the amalgamation of the former Nipissing riding with the southeastern portion of the former Timiskaming—Cochrane riding. The 2011 electoral results in this riding were challenged in court on the grounds that there were "irregularities, fraud or corrupt or illegal practices that affected the result of the election".

<span class="mw-page-title-main">Sarnia—Lambton (federal electoral district)</span> Federal electoral district in Ontario, Canada

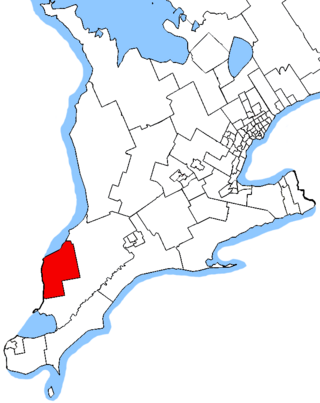
Sarnia—Lambton is a federal electoral district in Ontario, Canada, that has been represented in the House of Commons of Canada since 1968. It is located in the area of the city of Sarnia, in the southwest corner of the province of Ontario.

<span class="mw-page-title-main">Sault Ste. Marie (federal electoral district)</span> Federal electoral district in Ontario, Canada

Sault Ste. Marie is a federal electoral district in Ontario, Canada, that has been represented in the House of Commons of Canada since 1968.

<span class="mw-page-title-main">Calgary Shepard</span> Federal electoral district in Alberta, Canada

Calgary Shepard is a federal electoral district in Alberta, Canada, that has been represented in the House of Commons of Canada since 2015.

References

Notes