The Green Party of England and Wales is a green, left-wing political party in England and Wales. Since October 2021, Carla Denyer and Adrian Ramsay have served as the party's co-leaders. The party currently has four representatives in the House of Commons and two in the House of Lords, in addition to over 800 councillors at the local government level and three members of the London Assembly.
The English Democrats are a right-wing to far-right, English nationalist political party active in England. Being a minor party, it currently has no elected representatives at any level of UK government.

Referendums in the United Kingdom are occasionally held at a national, regional or local level. Historically, national referendums are rare due to the long-standing principle of parliamentary sovereignty. Legally there is no constitutional requirement to hold a national referendum for any purpose or on any issue. However, the UK Parliament is free to legislate through an Act of Parliament for a referendum to be held on any question at any time.
The 2004 European Parliament election was the United Kingdom's part of the wider 2004 European Parliament election which was held between 10 and 13 June 2004 in the 25 member states of the European Union. The United Kingdom's part of this election was held on Thursday 10 June 2004. The election also coincided with the 2004 local elections and the London Assembly and mayoral elections. In total, 78 Members of the European Parliament were elected from the United Kingdom using proportional representation.

Christopher Laurie "Kit" Malthouse is a British Conservative Party politician and businessman who has served as Member of Parliament (MP) for North West Hampshire since 2015. He served as Secretary of State for Education from 6 September to 25 October 2022, and previously served as Chancellor of the Duchy of Lancaster from July to September 2022.

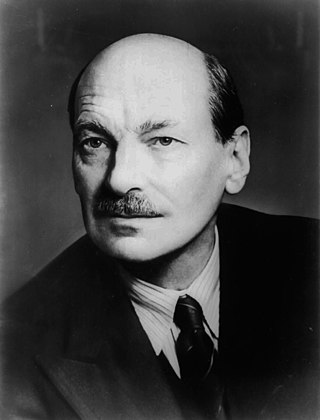
The 2005 United Kingdom general election was held on Thursday 5 May 2005, to elect 646 members to the House of Commons. The governing Labour Party led by Prime Minister Tony Blair won its third consecutive victory, with Blair becoming the second Labour leader after Harold Wilson to form three majority governments. However, its majority fell to 66 seats; the majority it won four years earlier had been of 167 seats. The UK media interpreted the results as an indicator of a breakdown in trust in the government, and especially in Blair.

The dissolution of the Parliament of the United Kingdom occurs automatically five years after the day on which Parliament first met following a general election, or on an earlier date by royal proclamation at the advice of the prime minister. The monarch's prerogative power to dissolve Parliament was revived by the Dissolution and Calling of Parliament Act 2022, which also repealed the Fixed-term Parliaments Act 2011. By virtue of amendments made by the Dissolution and Calling of Parliament Act to Schedule 1 to the Representation of the People Act 1983, the dissolution of Parliament automatically triggers a general election.

Jonathan Charles Bartley is a British politician who was a co-leader of the Green Party of England and Wales, a position he shared with Caroline Lucas from 2016 to 2018, and then, from 2018 to 2021, with Siân Berry. He was the Green Party's national Work and Pensions spokesperson and the party's Parliamentary candidate for Streatham in the 2015 general election. He was the Unite to Remain candidate for Dulwich and West Norwood at the 2019 general election.
There are five types of elections in the United Kingdom: elections to the House of Commons of the United Kingdom, elections to devolved parliaments and assemblies, local elections, mayoral elections, and Police and Crime Commissioner elections. Within each of those categories, there may also be by-elections. Elections are held on Election Day, which is conventionally a Thursday, and under the provisions of the Dissolution and Calling of Parliament Act 2022 the timing of general elections can be held at the discretion of the prime minister during any five-year period. All other types of elections are held after fixed periods, though early elections to the devolved assemblies and parliaments can occur in certain situations. The five electoral systems used are: the single member plurality system (first-past-the-post), the multi-member plurality, the single transferable vote, the additional member system, and the supplementary vote.
The Fixed-term Parliaments Act 2011 (FTPA) was an Act of the Parliament of the United Kingdom which, for the first time, set in legislation a default fixed election date for general elections in the United Kingdom. It remained in force until 2022, when it was repealed. Since then, as before its passage, elections are required by law to be held at least once every five years, but can be called earlier if the prime minister advises the monarch to exercise the royal prerogative to do so. Prime ministers have often employed this mechanism to call an election before the end of their five-year term, sometimes fairly early in it. Critics have said this gives an unfair advantage to the incumbent prime minister, allowing them to call a general election at a time that suits them electorally. While it was in force, the FTPA removed this longstanding power of the prime minister.

The 2016 Scottish parliament election was held on Thursday, 5 May 2016 to elect 129 members to the Scottish Parliament. It was the fifth election held since the devolved parliament was established in 1999. It was the first parliamentary election in Scotland in which 16 and 17 year olds were eligible to vote, under the provisions of the Scottish Elections Act. It was also the first time the three largest parties were led by women.

The 2015 United Kingdom general election was held on Thursday, 7 May 2015 to elect 650 members of Parliament (MPs) to the House of Commons. The Conservative Party, led by Prime Minister David Cameron, won an unexpected majority victory of ten seats; they had been leading a coalition government with the Liberal Democrats. It was the last general election to be held before the UK voted to leave the European Union (EU) in June 2016.

The 2017 United Kingdom general election was held on Thursday 8 June 2017, two years after the previous general election in 2015; it was the first since 1992 to be held on a day that did not coincide with any local elections. The governing Conservative Party led by Prime Minister Theresa May remained the largest single party in the House of Commons but lost its small overall majority, resulting in the formation of a Conservative minority government with a confidence and supply agreement with the Democratic Unionist Party (DUP) of Northern Ireland.

The 2019 United Kingdom general election was held on Thursday 12 December 2019, with 47,074,800 registered voters entitled to vote to elect 650 Members of Parliament (MPs) to the House of Commons. The governing Conservative Party, led by Prime Minister Boris Johnson, won a landslide victory with a majority of 80 seats, a net gain of 48, on 43.6 per cent of the popular vote, the highest percentage for any party since the 1979 general election, though with a narrower popular vote margin than that achieved by the Labour Party over the Conservatives at the 1997 general election. This was the second national election to be held in 2019 in the United Kingdom, the first being the 2019 European Parliament election.
The 2019 European Parliament election was the United Kingdom's component of the 2019 European Parliament election. It was held on Thursday 23 May 2019 and the results announced on Sunday 26 and Monday 27 May 2019, after all the other EU countries had voted. This was the United Kingdom's final participation in a European Parliament election before leaving the European Union on 31 January 2020; it was also the last election to be held under the provisions of the European Parliamentary Elections Act 2002 before its repeal under the European Union (Withdrawal) Act 2018, and was the first European election in the United Kingdom since 1999 to be held on a day that did not coincide with any local elections. This was the first of two national elections held in the United Kingdom in 2019; the 2019 general election occurred six-and-a-half months later in December 2019.

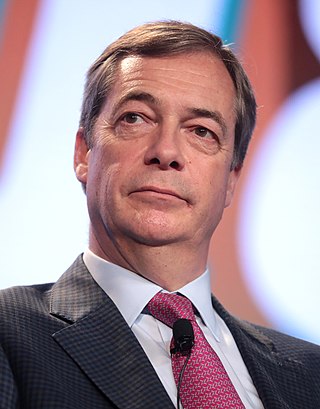
Reform UK is a right-wing populist political party in the United Kingdom. Nigel Farage has served as the party's leader since June 2024 and Richard Tice has served as the party's deputy leader since July 2024. The party currently has five members of Parliament (MPs) in the House of Commons and one member of the London Assembly. The party also holds representation at the local government level, with most of its local councillors having defected from the Conservative Party to Reform UK. Following Farage's resumption of the leadership during the 2024 general election, there was a sharp increase in support for the party. Following the election, it was the third largest party by popular vote, with 4,117,610 votes achieving 14.3 per cent of the vote in total.
Brexit was the withdrawal of the United Kingdom from the European Union at 23:00 GMT on 31 January 2020. As of 2020, the UK is the only member state to have left the EU. Britain entered the predecessor to the EU, the European Communities (EC), on 1 January 1973. Following this, Eurosceptic groups grew in popularity in the UK, opposing aspects of both the EC and the EU. As Euroscepticism increased during the early 2010s, Prime Minister David Cameron delivered a speech in January 2013 at Bloomberg London, in which he called for reform of the EU and promised an in–out referendum on the UK's membership if the Conservative Party won a majority at the 2015 general election. The Conservatives won 330 seats at the election, giving Cameron a majority of 12, and a bill to hold a referendum was introduced to Parliament that month.
The Early Parliamentary General Election Act 2019, also known as the Election Bill, was an Act of the Parliament of the United Kingdom that made legal provision for the holding of the 2019 general election on 12 December 2019.
The Dissolution and Calling of Parliament Act 2022 is an act of the Parliament of the United Kingdom that repealed the Fixed-term Parliaments Act 2011 and reinstated the prior constitutional situation, by reviving the power of the monarch to dissolve and summon parliament. As the monarch exercises this power at the request of the prime minister, this restored the power of the prime minister to have a general election called at a time chosen by the prime minister.
The Labour Party is a centre-left political party in the United Kingdom. Formed in 1900, it is one of the two main political parties along with the Conservative Party. In all general elections since 1918, Labour has been either the governing party or the Official Opposition. Since the 2010 general election, Labour was the second largest party in the UK for 14 years until the 2024 United Kingdom General election. Since 1918, Labour have formed 13 governments.