Electoral results for the South West Region

Last updated

This is a list of electoral results for the South West Region in Western Australian state elections from the region's creation in 1989 until the present.

Contents

Legislation to abolish the region, along with all other Western Australian electoral regions, was passed in November 2021, with the 2025 state election to use a single state-wide electorate of 37 members. [1]

Election results

2021

2021 Western Australian state election: South West [2]
PartyCandidateVotes%±%
Quota 29,300
Labor 1. Sally Talbot (elected 1)
2. Alannah MacTiernan (elected 3)
3. Jackie Jarvis (elected 4)
4. John Mondy
5. Ben Dawkins
6. Kylie Fitzgerald
114,71355.93+19.49
Liberal 1. Steve Thomas (elected 2)
2. Greg Stocks
3. Anita Shortland
4. Hayden Burbidge
37,73618.40−4.28
National 1. James Hayward (elected 6)
2. Louise Kingston
3. Rod Pfeiffer
12,2545.97−6.06
Greens 1. Diane Evers
2. Donald Clarke
3. Jodie Moffat
12,2205.96−1.62
Shooters, Fishers, Farmers 1. Rick Mazza
2. Russell McCarthy
3. Ray Hull
5,1782.52−1.59
Legalise Cannabis 1. Sophia Moermond (elected 5)
2. Nicola Johnson
4,5312.21+2.21
One Nation 1. Colin Tincknell
2. Paul Howard
3. Michael Pelle
3,8411.87−8.76
Christians 1. Laurence Van der Plas
2. Joan Albany
3,7821.84+0.15
No Mandatory Vaccination 1. Keith Bunton
2. Elisabeth Bluntschli
2,5041.22+1.22
Liberal Democrats 1. Eli Bernstein
2. David Fishlock
2,0140.98+0.03
Western Australia 1. Terri Sharp
2. Joanne Munro
1,4200.69+0.55
Sustainable Australia 1. Daniel Minson
2. Heather Scott
9040.44+0.44
WAxit 1. Chas Hopkins
2. Malcolm Gilmour
8100.39+0.20
Animal Justice 1. Vicki Bailey
2. Sarah Gould
7980.39−0.40
Health Australia 1. Justin Zwartkruis
2. Hayley Green
4930.24+0.24
Great Australian 1. Nick Robinson
2. Andy Gleeson
4610.22+0.22
Liberals for Climate 1. Mark Bentley
2. Pieter Lottering
4100.20−0.23
Daylight Saving 1. Garry Spiers
2. Lizabeth Taylor
2830.14−0.22
Independent 1. Yasmin Bartlett
2. Karen Perttula
2420.12+0.12
Independent Dave Schumacher1700.08+0.08
Independent 1. George Seth
2. Noel Avery
1450.07+0.07
Independent 1. John Banks
2. Phillip Spencer
1010.05+0.05
Independent Bob Burdett890.04+0.04
Total formal votes205,09997.92+0.83
Informal votes4,3572.08−0.83
Turnout 209,45686.20−1.00

2017

2017 Western Australian state election: South West
PartyCandidateVotes%±%
Quota 27,727
Labor 1. Sally Talbot (elected 1)
2. Adele Farina (elected 3)
3. John Mondy
4. Barry Winmar
5. Jessica Short
70,73436.44+5.91
Liberal 1. Steve Thomas (elected 2)
2. Wade De Campo
3. Robyn McSweeney
4. Tony Norment
5. Heather Reid
6. Douglas McLarty
44,01422.68−21.27
National 1. Colin Holt (elected 5)
2. Louise Kingston
3. Bevan Eatts
4. Kylie Kennaugh
23,36012.04+1.06
One Nation 1. Colin Tincknell (elected 4)
2. Cameron Bartkowski
3. Sean Butler
20,63610.63+10.63
Greens 1. Diane Evers (elected 6)
2. Hsien Harper
14,7057.58−0.34
Shooters, Fishers, Farmers 1. Nigel Hallett
2. Craig Carbone
3. Ray Hull
7,9944.12+1.75
Christians 1. Greg Spaanderman
2. Rachael Dowdell
3,2921.70+0.24
Liberal Democrats 1. Nathan Dyson
2. Damian Coletta
1,8490.95+0.95
Family First 1. Linda Rose
2. Dave Bolt
1,7920.92−0.60
Animal Justice 1. Alicia Sutton
2. Eric Gobbert
1,5410.79+0.79
Flux the System! 1. Daithí Gleeson
2. Mark Bentley
8410.43+0.43
Daylight Saving 1. Brett Tucker
2. Janet Wilson
6860.35+0.35
Independent 1. Tim Hartley
2. Julio Pieraldi
6220.32+0.32
Fluoride Free WA 1. Hayley Green
2. John Vukovich
5790.30+0.30
Micro Business 1. Jeff Casson
2. Devinder Chinna
3730.19+0.19
Independent 1. Eric Thern
2. Katrina De Ruyck
2910.15+0.15
Matheson for WA 1. Stephen Phelan
2. Blake Phelan
2850.15+0.15
Independent Kyle Hammond2670.14+0.14
Independent John Higgins1550.08+0.08
Independent Zyggi Uchwal720.04+0.04
Total formal votes194,08897.29+0.04
Informal votes5,4112.71−0.04
Turnout 199,49988.25−2.41

2013

2013 Western Australian state election: South West
PartyCandidateVotes%±%
Quota 24,134
Liberal 1. Robyn McSweeney (elected 1)
2. Barry House (elected 3)
3. Nigel Hallett (elected 5)
4. Ian Morison
5. Paul Fitzpatrick
6. Michelle Steck
74,24843.95+4.54
Labor 1. Sally Talbot (elected 2)
2. Adele Farina (elected 4)
3. John Mondy
4. Ian Bishop
5. Aaron Dean
6. Pearl Lim
51,57630.53-2.53
National 1. Colin Holt (elected 6)
2. Sam Harma
3. Dudley Greathead
18,54110.98+0.21
Greens 1. Giz Watson
2. Hsien Harper
13,3747.92-0.71
Shooters and Fishers 1. Daniel Strijk
2. Mark Mazza
3,9972.37+2.37
Family First 1. Bev Custers
2. David Bolt
2,5771.53-2.38
Christians 1. Justin Moseley
2. Tim Schoof
2,4531.45-0.66
Independent 1. Nataporn Sri-Innop Ross
2. Janet Grogan
1,2050.71+0.71
Independent Don Hyland9600.57+0.57
Total formal votes168,93197.25-0.13
Informal votes4,7762.75+0.13
Turnout 173,70790.67+2.22

2008

2008 Western Australian state election: South West
PartyCandidateVotes%±%
Quota 17,908
Liberal 1. Robyn McSweeney (elected 1)
2. Nigel Hallett (elected 3)
3. Barry House (elected 6)
4. Paul Fitzpatrick
5. Dennis Wellington
6. Ross Ryan
60,68439.41+0.3
Labor 1. Sally Talbot (elected 2)
2. Adele Farina (elected 4)
3. John Mondy
4. Wendy Perdon
5. Christopher Hossen
6. Elizabeth Nedela
50,90833.06-4.4
National 1. Colin Holt (elected 5)
2. Patricia Hughes
16,59210.77+5.2
Greens 1. Paul Llewellyn
2. Rae McPherson
13,2858.63+1.0
Family First 1. Dan Sullivan
2. Linda Rose
6,0243.91+0.9
Christian Democrats 1. John Lewis
2. Ray Moran
3,2512.11+0.4
One Nation Brian Burns9950.65-1.5
Independent 1. Elaine Green
2. Terry O'Leary
8810.57+0.6
  Daylight Savings Kara Pascoe6260.41+0.41
Independent Filip Guglielmana3280.21+0.2
New Country Judy Pearce2200.14-0.5
Citizens Electoral Council 1. Ian Tuffnell
2. Allan Dilley
2050.13+0.1
Total formal votes153,99997.38+0.7
Informal votes4,1502.62-0.7
Turnout 158,14988.45-2.7

2005

2005 Western Australian state election: South West
PartyCandidateVotes%±%
Quota 17,908
Liberal 1. Barry House (elected 1)
2. Robyn McSweeney (elected 3)
3. Nigel Hallett (elected 5)
4. Ken Robinson
5. Kerrol Gildersleeve
6. Philippa Reid
7. Narelle King
55,89439.0+3.6
Labor 1. Adele Farina (elected 2)
2. Sally Talbot (elected 4)
3. Matt Benson-Lidholm (elected 6)
4. Liam Costello
5. Jullianne Slater
6. Jasper Trendall
54,03637.7+7.0
Greens 1. Paul Llewellyn (elected 7)
2. Kingsley Gibson
10,8427.6-0.9
National 1. Steve Dilley
2. Colin Holt
7,7345.4-0.8
Family First 1. Linda Rose
2. Coleen Heine
4,3303.0+3.0
One Nation 1. Alan Giorgi
2. Kenneth Waters
3,0912.2-12.0
Christian Democrats 1. Justin Moseley
2. Kerry Watterson
2,3751.7+0.4
Independent Ken Gunson1,5381.1-0.1
Public Hospital Support Group1. Ray Goodwin
2. Val Goodwin
1,1650.8+0.8
New Country 1. Paddy Embry
2. Frances Chester
9360.7+0.7
Democrats 1. Adam Welch
2. John Partridge
7700.5-1.3
Liberals for Forests 1. June Bennett
2. Judy Pryer
5490.4+0.4
Total formal votes143,26096.7-0.7
Informal votes4,8493.3+0.7
Turnout 148,10991.1-1.0

2001

2001 Western Australian state election: South West
PartyCandidateVotes%±%
Quota 16,882
Liberal 1. Barry House (elected 1)
2. Bill Stretch (elected 4)
3. Robyn McSweeney (elected 6)
4. John Silcock
5. Nigel Hallett
6. Robert Nicholson
7. Craig Carbone
47,86235.4*
Labor 1. John Cowdell (elected 2)
2. Adele Farina (elected 5)
3. Matt Benson-Lidholm
4. Ursula Richards
5. Patricia Creevey
6. Garry Newman
41,51630.7+2.6
One Nation 1. Paddy Embry (elected 3)
2. Peter O'Reilly
3. Judith South
19,15214.2+14.2
Greens 1. Chrissy Sharp (elected 7)
2. Basil Schur
3. Judy Trembath
11,4428.5+1.0
National 1. Mal Cameron
2. Steve Dilley
3. Gordon Smith
8,3396.2*
Democrats 1. Alf Denman
2. Alison Wylie
2,3611.7-2.7
Christian Democrats Justin Moseley1,7911.3+1.3
Independent Ken Gunson1,6331.2+1.2
Curtin Labor Alliance Terry Iturbide6400.5+0.5
  Seniors Glen Wood3180.2+0.2
Total formal votes135,05497.4+0.4
Informal votes3,6182.6-0.4
Turnout 138,67292.1+0.2
  • The Liberal and National parties ran a joint ticket for South West in the 1996 election. The overall swing against the Coalition in the South West region was -10.8.

1996

1996 Western Australian state election: South West
PartyCandidateVotes%±%
Quota 15,037
Liberal/National Coalition 1. Barry House (elected 1)
2. Bill Stretch (elected 3)
3. Muriel Patterson (elected 5)
4. Murray Montgomery (elected 6)

5. John Silcock
6. Robyn McSweeney
7. Rick Beatty
8. Pauline McLeod
9. Steve Thomas
10. Nigel Hallett
63,03252.4-1.4
Labor 1. Bob Thomas (elected 2)
2. John Cowdell (elected 4)
3. Lois Anderson
4. Marilyn Elson
5. Gary De Jager
33,76628.1-6.3
Greens 1. Chrissy Sharp (elected 7)
2. Basil Schur
3. Len Howard
9,0287.5+2.4
Democrats 1. Malcolm McKercher
2. Helen van Noort
5,3254.4+2.3
Australia First J.J. Amelia4,1613.5+3.5
Marijuana Paul Roth3,2012.7+2.7
Call to Australia 1. Justin Moseley
2. Laurie Sugg
1,5111.3+1.3
Natural Law 1. Ian Sandwell
2. Elspeth Clairs
2710.2+0.2
Total formal votes120,29597.0-0.4
Informal votes3,7743.0+0.4
Turnout 124,06991.9-3.1

1993

1993 Western Australian state election: South West
PartyCandidateVotes%±%
Quota 13,721
Liberal 1. Barry House (elected 1)
2. Bill Stretch (elected 3)
3. Muriel Patterson (elected 5)
4. John Silcock
5. Ian Mabey
6. Peter Giumelli
7. Gabi Ghasseb
48,05243.78+1.79
Labor 1. Bob Thomas (elected 2)
2. John Cowdell (elected 4)
3. Doug Wenn (elected 6)
4. Brian Procter
5. Lois Anderson
37,79834.44-3.07
National 1. Murray Montgomery (elected 7)
2. David Pover
3. Robert Teale
10,98010.00+0.58
Greens 1. Paul Davis
2. Lyn Serventy
5,6335.13+5.13
Independent Trish Townsend3,1132.84+2.84
Democrats 1. David Churches
2. Lila Ward
2,2902.09-0.06
Independent Sandy Lewis 6280.57+0.57
Grey Power Doug Ratcliffe3670.33-2.82
CALM Resistance MovementRobert Moir3180.29+0.29
Independent Ted Stone2730.25+0.25
Independent J J Amelia1630.15+0.15
Republican Jane King1510.14+0.14
Total formal votes109,76697.40-0.16
Informal votes2,9302.60+0.16
Turnout 112,69694.98

1989

1989 Western Australian state election: South West
PartyCandidateVotes%±%
Quota 11,987
Liberal 1. Barry House (elected 1)
2. Muriel Patterson (elected 3)
3. Bill Stretch (elected 5)
4. Adrian Fawcett
5. Suzanne Carter
6. Jonathan Youngs
40,26841.99
Labor 1. Doug Wenn (elected 2)
2. Beryl Jones (elected 4)
3. Bob Thomas (elected 6)
4. Josephine Lynch
5. Dane Carroll
35,96637.51
National 1. Murray Montgomery (elected 7)
2. Terence House
3. Jennifer Barrett
9,0299.42
Group D1. Marie-Louise Duxbury
2. Lynette Serventy
4,5494.74
Grey Power Herbert Cattrall3,0243.15
Democrats 1. David Churches
2. Daphne Wallace
2,0652.15
Independent Paul Roth9921.03
Total formal votes95,89497.56
Informal votes2,3942.44
Turnout 98,28892.83

Related Research Articles

<span class="mw-page-title-main">Western Australian Legislative Assembly</span> State legislature in Perth, Australia

The Western Australian Legislative Assembly, or lower house, is one of the two chambers of the Parliament of Western Australia, an Australian state. The Parliament sits in Parliament House in the Western Australian capital, Perth.

<span class="mw-page-title-main">Divisions of the Australian House of Representatives</span> Federal electorates in Australia

In Australia, electoral districts for the Australian House of Representatives are called divisions or more commonly referred to as electorates or seats. There are currently 151 single-member electorates for the Australian House of Representatives.

<span class="mw-page-title-main">Western Australian Legislative Council</span> Upper house of the legislature of Western Australia

The Western Australian Legislative Council is the upper house of the Parliament of Western Australia, a state of Australia. It is regarded as a house of review for legislation passed by the Legislative Assembly, the lower house. The two Houses of Parliament sit in Parliament House in the state capital, Perth.

<span class="mw-page-title-main">Division of Canning</span> Australian federal electoral division

The Division of Canning is an Australian Electoral Division in Western Australia.

The Western Australian Legislative Assembly is elected from 59 single-member electoral districts. These districts are often referred to as electorates or seats.

<span class="mw-page-title-main">Electoral district of Albany</span> State electoral district of Western Australia

Albany is a Legislative Assembly electorate in the state of Western Australia. Albany is named for the port and regional city of Western Australia which falls within its borders. It is one of the oldest electorates in Western Australia, with its first member having been elected in the inaugural 1890 elections of the Legislative Assembly. It is regarded as a swinging seat, and has been held by the Labor Party since the 2001 election, at which Peter Watson was first elected. Watson announced his retirement prior to the 2021 election and was succeeded in the seat by Labor Party colleague, Rebecca Stephens.

<span class="mw-page-title-main">Division of O'Connor</span> Australian federal electoral division

The Division of O'Connor is an Australian electoral division in the state of Western Australia. It is one of Western Australia's three rural seats, and one of the largest electoral constituencies in the world.

<span class="mw-page-title-main">Electoral district of Collie-Preston</span> State electoral district of Western Australia

Collie-Preston is a Legislative Assembly electorate in the state of Western Australia. While the seat was known as Collie for just over a century of its existence as an electorate, the seat was known as South West Mining from 1901 to 1904, and Collie-Wellington from 2005 to 2008. It is named for the South West coal mining town of Collie. While historically a very safe seat for the Labor Party, redistributions in 1988 and 2007 due to increases in the quota for country seats which had historically been malapportioned resulted in the seat incorporating surrounding rural shires which were hostile to Labor and thereby becoming more marginal.

<span class="mw-page-title-main">Electoral district of Mandurah</span> State electoral district of Western Australia

Mandurah is an electoral district of the Legislative Assembly in the Australian state of Western Australia.

<span class="mw-page-title-main">Agricultural Region</span> Electoral region of Western Australia

The Agricultural Region is a multi-member electoral region of the Western Australian Legislative Council, located in the South West, Peel and part of the Great Southern regions of the state. It was created by the Acts Amendment Act 1987, and became effective on 22 May 1989 with five members who had been elected at the 1989 state election three months earlier. At the 2008 election, it was increased to six members.

<span class="mw-page-title-main">East Metropolitan Region</span> Electoral region in Perth, Western Australia

The East Metropolitan Region is a multi-member electoral region of the Western Australian Legislative Council, located in the eastern and south-eastern suburbs of Perth. It was created by the Acts Amendment Act 1987, and became effective on 22 May 1989 with five members who had been elected at the 1989 state election three months earlier. At the 2008 election, it was increased to six members.

<span class="mw-page-title-main">Mining and Pastoral Region</span> Electoral region of the Western Australian Legislative Council

The Mining and Pastoral Region is a multi-member electoral region of the Western Australian Legislative Council, located in the northern and eastern regions of the state. It was created by the Acts Amendment Act 1987, and became effective on 22 May 1989 with five members who had been elected at the 1989 state election three months earlier. At the 2008 election, it was increased to six members.

<span class="mw-page-title-main">North Metropolitan Region (Western Australia)</span>

The North Metropolitan Region is a multi-member electoral region of the Western Australian Legislative Council, located in the north-western and western suburbs of Perth. It was created by the Acts Amendment Act 1987, and became effective on 22 May 1989 with seven members who had been elected at the 1989 state election three months earlier. At the 2008 election, it was decreased to six members.

<span class="mw-page-title-main">South Metropolitan Region</span>

The South Metropolitan Region is a multi-member electoral region of the Western Australian Legislative Council, located in the southern suburbs of Perth, Western Australia. It was created by the Acts Amendment Act 1987, and became effective on 22 May 1989 with five members who had been elected at the 1989 state election three months earlier. At the 2008 election, it was increased to six members.

<span class="mw-page-title-main">South West Region (Western Australia)</span> Electoral region of Western Australia

The South West Region is a multi-member electoral region of the Western Australian Legislative Council the South West, Peel and part of the Great Southern regions of the state. It was created by the Acts Amendment Act 1987, and became effective on 22 May 1989 with seven members who had been elected at the 1989 state election three months earlier. At the 2008 election, it was reduced to six members. The region includes the cities of Albany, Bunbury and Mandurah.

<span class="mw-page-title-main">Western Victoria Region</span> Electoral region of the Victorian Legislative Council

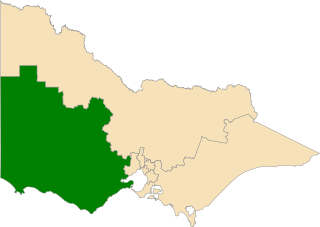
Western Victoria Region is one of the eight electoral regions of Victoria, Australia, which elects five members to the Victorian Legislative Council by proportional representation. The region was created in 2006 following the 2005 reform of the Victorian Legislative Council.

<span class="mw-page-title-main">Electoral regions of Western Australia</span>

The Western Australian Legislative Council was elected from six multi-member electoral regions, which are in turn composed of electoral districts which are used to elect the Legislative Assembly. The current number of electoral regions was established on 22 May 1989. Initially, the South West and Northern Metropolitan regions returned seven members to the Legislative Council, while the other regions each returned five members. This arrangement was changed to have each region return six members for the 2008 Western Australian election, increasing the total number of members from 34 to 36. Before 1989 electoral divisions for the Legislative Council were known as electoral provinces.

<span class="mw-page-title-main">No Mandatory Vaccination Party</span> Political party in Australia

The No Mandatory Vaccination Party is a political party registered in the Australian state of Western Australia.

<span class="mw-page-title-main">Results of the 2021 Western Australian state election (Legislative Council)</span>

This is a list of electoral region results for the Western Australian Legislative Council in the 2021 Western Australian state election.

<span class="mw-page-title-main">Wilson Tucker (politician)</span> Western Australian politician

Wilson Robert Tucker is an Australian politician serving in the Western Australian Legislative Council for the Mining and Pastoral region. He was elected at the 2021 Western Australian state election for the Daylight Saving Party, with 98 primary votes, or 0.18% of the vote – believed to be the lowest primary vote for any politician elected to a parliament in Australia.

References

  1. "'Devastating for regional communities': WA government uses majority to overhaul state's electoral laws". ABC News. 2021-11-16. Retrieved 2023-03-19.
  2. "2021 State General Election Results: South West Region". Western Australian Electoral Commission. Retrieved 1 April 2021.