Pristina, the capital of the Republic of Kosovo, is the country's most populated city, with more than 200,000 inhabitants. Its air pollution level are similar to those of Beijing, Mumbai and New Delhi.[1] The main sources of Pristina's air pollution include power plant emissions during energy production, household emissions and traffic.
Pristina grapples with a myriad of pollution issues that significantly impact the environment and public health. From air and water pollution to waste management challenges, the city faces complex environmental problems that require urgent attention and sustainable solutions.
Air pollution
Pristina suffers from severe air pollution, primarily attributed to industrial activities, vehicular emissions, and the burning of fossil fuels for heating during the winter months. The concentration of pollutants such as particulate matter (PM10 and PM2.5), sulphur dioxide (SO2), nitrogen dioxide (NO2), and carbon monoxide (CO) often exceeds acceptable levels, posing serious health risks to residents.
Water pollution
The quality of water sources is also a cause for concern, with pollution stemming from industrial discharges, agricultural runoff, and inadequate sewage treatment systems. Rivers and streams in the region suffer from contamination by heavy metals, chemicals, and organic pollutants, jeopardizing aquatic ecosystems and the availability of safe drinking water.
Studies have highlighted the presence of pollutants such as lead, arsenic, and pesticides in water samples collected from various sources.[2] The deteriorating water quality not only poses risks to human health but also undermines efforts to achieve sustainable development and preserve natural resources.
Waste management
Inefficient waste management practices contribute to the pollution burden, with inadequate collection, treatment, and disposal systems leading to littering, illegal dumping, and landfill pollution. The proliferation of plastic waste further exacerbates environmental degradation, posing challenges for recycling and waste reduction efforts.
Despite initiatives to improve waste management infrastructure and promote recycling programs, Pristina continues to grapple with systemic challenges. [3] Limited public awareness and engagement, coupled with insufficient investment in sustainable waste management solutions, hinder progress towards a cleaner and healthier environment.
NOx The main nitrogen oxide found in the air in Pristina is nitrogen oxide (NO). NO affects the color of textile materials, causes corrosion in metallic materials, and causes the wilting of leaves in vegetation. NO2 is 4 times more lethal than NO, and it is mostly concentrated in urban areas. NO2 in Pristina is 52% from transport sector, 28% from emissions for energy production, and 11% from industry.[4] Pristina has a lower annual average of NO2 emission as compared to the annual average limit allowed.
Nitrogen dioxide (NO2)-annual average for 2010 and 2011
2010
2011
Annual average value limit for protection of materials
40μg/m3
Pristina-KHMI
20.82
-
Annual average of NO2 in Pristina
The annual average of NO2 emission in Pristina was 20.82μg/m3 in 2010, lower than limit of 40μg/m3. There is no available data for 2011, which means no comparison can be made between 2010 and 2011.[5] However, with only 68% of data being valid, this means that the emission of NO2 may not be accurate. On the other hand, according to a study by the National Institute of Public Health of Kosovo, the emission of NO2 is alarming; in only three months, NO2 measurement exceeded allowed emissions by 18 times.[6] The emission of NO2 is higher in winter, where the heating process is accelerated, with February being the peak month. The main contributor to the pollution of air with NO2 are Kosovo A and B power plants. Thus, NO2 emission is estimated to be higher in urban areas where traffic is enormous. However, in Pristina, the NO2 limit that would cause health problems in people's life is not exceeded; this may not apply for other cities near Pristina.
SO2
Sulphur dioxide (SO2)-annual average(including the winter season 01.10-31.03)2010 and 2011
2010
2011
The limit value for vegetation protection annual average(including the winter 01.10-31.03)
20μg/m3
Pristina, KHMI
11.23
-
Annual average values of SO2 in Pristina
CO2
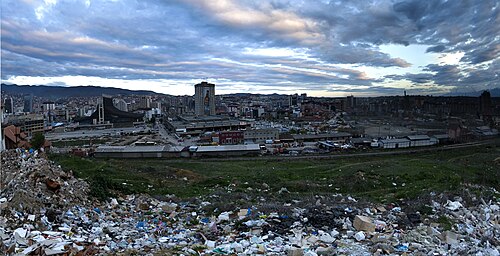
Pristina at sunset
Vehicles and fuel burning companies are the main sources of CO2 in Pristina. Fuel burning includes liquid fuels, natural gas and wood, combustion of coal, and industrial processes such as furnaces, paper factories, the refineries, and facilities for production of construction materials. CO2 emission in air can be mitigated through plants; however, this is another problem in Pristina. The lack of green spaces and well-maintained parks makes the mitigation of CO2 impossible. The highest pollutant is the production of energy, with Pristina's annual CO2 contribution to global warming being 5.5 million tons. CO2 pollution comes 30% from fuel use for power generation, 29% from transport, 20% from industry, 15% from residential commerce, and 6% from other sources. If Pristina is compared with regional countries, it is noticed that Pristina exceeds the OSCE and EU emissions of CO2. Pristina has higher emission of CO2 compared to the region of Serbia, and lower emissions compared to the region of Bosnia and Herzegovina.
Particulate matter (dust)
PM emission on air comes mainly from transportation in Pristina. The problem lies in the significant increase of automobiles in Pristina, where most are old and do not possess catalytic converters. Pristina's cars' life spans range from 5 years to more than 15 years. 7.5% of registered cars are newer than 5 years old, 77.36% are older than 10 years, and 66.82% of them are more than 15 years old.[7] Furthermore, each day in Pristina, an enormous number of cars enter, creating traffic as well as air pollution. Out of the total number of vehicles registered in Kosovo, 31.18% of them are registered in Pristina; 84% are passenger's vehicles, 13% are from transporting, and the others come mainly from urban traffic. The public transportation in Pristina contains mainly buses exported from other countries. There are 757 licensed buses routes per day and out of these 382 are executed on average per day. Buses/minibuses connecting urban and suburban areas total 151 with 935 departures per day.[8]
There are two main stations in Pristina that measure the air pollution, the Kosovo Hydro Meteorological Institute (IHMK) and Rilindja.
PM10
PM10 number of days with exceeded daily limit value for 2010 and 2011
2010
2011
Daily limit value
50μg/m3
Number of days with exceedances within a year
35days
Pristina IHMK
99
68*
Pristina Rilindja
69*
92*
Number of days with exceeded limit values of PM10
As can be seen from the table, the maximum amount allowed to be exceeded with PM10 is 35 days, and the maximum daily value is 50μg/m3. However, according to KHMI, Pristina exceeded this limit for 99 days in 2010 and for 68 days in 2011. The majority of days with exceedance of average daily values were during the winter months.[9] The table below presents PM10 maximum, minimum, and average monthly values, where November is the month with the highest recorded PM10 value.[10]
PM10
Average
Max
Min
Sep
51.7
83.1
24.1
Oct
50.6
128.2
10.6
Nov
153.84
278.63
37.97
Dec
53.23
141.79
16.96
Jan
54.45
155.9
14.07
Feb
51.84
125.98
16.05
Mar
49.74
73.05
24.19
Monthly average values, max and min. of PM10, IHMK station (Pristina 1)
The annual limit of (40μg/m3) was also exceeded in 2010 and 2011, as it can be seen from figure 2. The highest pollution value reached from traffic in Pristina was estimated to be 75.74μg/m3, which is 1.9 times more than the average annual limit.[11]
PM2.5
PM2.5 Annual average
2010
2011
Annual limit value
50μg/m3
Pristina Rilindje
37.34
40.04
Annual Average of PM2.5
The average annual emission of PM2.5 is 25μg/m3. However, Pristina has exceeded this limit in 2010 and 2011. Furthermore, the PM2.5 concentration has increased from 37.34μg/m3 in 2010 to 40.40μg/m3in 2011.[11] The highest value of PM2.5 has been recorded in the winter months, with November leading among other months.
PM2.5
Average
Max
Min
Nov
93.88
148.87
26.02
Dec
39.31
110.2
13.73
Jan
44.38
144.74
11.38
Feb
41.97
110.3
10.23
Mar
32.36
46.61
18.93
Monthly average values, max and min. of PM2.5, station IHMK (Pristina1)
Kosovo A and B power plants are the number one pollutant of Kosovo and Pristina region. It is the primary factor contributing to the pollution of air with the above-mentioned gasses. The power plants located in Obiliq produce 97% of the electrical energy used in Pristina, while only 3% comes from hydropower.[citation needed] There is no continuous emission monitoring system from those two plants. However, lower emissions have been reported in Kosovo B compared to Kosovo A. Kosovo A has three blocks, A1, A3, A5, and Kosovo B has two blocks B1 and B2. According to the state report for environmental conditions in Kosovo, both power plants have exceeded the SO2 limits in air, that of 400mg/Nm3, and the NO2 limit that of 500mg/Nm3, and dust emission limit that of 50mg/Nm3. CO2 emission from Kosovo A is lower than from power plant Kosovo B, as it can be seen in the table below.
2007
2008
2009
2010
2011
2012
Kosovo A
2,087,938
2,008,196
2,364,253
2,848,117
2,893,087
2,762,053
Kosovo B
3,636,361
4,338,011
4,689,615
4,249,301
3,463,901
3,314,555
Sum
5,724,299
6,346,207
7,053,868
7,097,418
6,356,988
6,076,608
CO2 emissions from power plants Kosovo A and B in Pristina
Electro filters are planned to be established in A3, A4 and A5 with the aim to increase the efficiency of the existing electro filters.[12] The plant's CO2 emissions are more than 6 million tons annually, which means 520 tons per hour. When Kosovo A+B produces energy at full capacity (200 MW), it emits 25 tons of dust and ash (that includes gases) per hour, which is 74 times more than the European limit. Critical months are deemed April, June, July, October, November and December, where the emission of gases and dust exceeds the limit allowed.
Facts from Ministry of Environment and Spatial Planning in Kosovo (2006):
Greenhouse gasses: 10,797,000 tons of CO2 and 425,000 t of CH4
CO emissions: 986,000 tons
Dust emissions: 167,000 t with specific values from 1,881mg/m3 to 7,523 mg/m3 at Kosovo A and 250 mg/m3 at Kosovo B
SO2 emissions: 167,000 t with specific values of 895 mg/m3
NOx Emission: 20,000 t with specific values from 358 mg/m3 to 478 mg/m3 at Kosovo A and 735 mg/m3 at Kosovo B.[13]
The Ministry of Environment has concluded that the problem with dust emitted from those two power plants is serious and it cannot be avoided without major redesign of the boilers. Plant units in Kosovo A need serious assessment since they are at the end of their lifespan. On the other hand, Kosovo B has a longer lifespan, but the existing electrostatic precipitator is in very bad conditions and also there is low control of dust emission in the air. The European Union has set some targets that those power plants shall reach by 2017. Dust emission should be max 50mg/Nm3, SO2 max 400mg/Nm3, and NO2 max 500mg/Nm3.
Pollutant
Kosovo A
Kosovo B
Limit value
Limit to be achieved by
Dust
902.32
156.35
50
31 Dec 2017
SO2
251.42
208.55
400
31 Dec 2017
NO2
705.75
835.08
500
31 Dec 2017
Air pollutants released in 2006 from Power Plants Kosovo A and B
District Heating and Household Heating
The district heating company "Termokos" operates a network covering some neighborhoods in the center of Pristina. An extension is foreseen. This company operates a heating station fueled with oil and gas, while a cogeneration system is considered a stable solution for the improvement of the heating system in Pristina. District heating is offered only in three cities in Kosovo, whereas approximately 3–4% of households are connected.
Some challenges related with District heating are:[citation needed]
Loss of hot water (energy) in the distribution network
However, private households in Pristina use mainly wood, wastewood and residual waste for heating, burned in old ovens without filters and low burning temperatures. Thus, air pollutants, dust and smell end up in the urban air and worsen the situation. Heating material is secured from public vegetation. This problem could be reduced if district heating challenges would be solved, and each house in Pristina would be abandoned from firing heating materials, which are cut from woods and bushes in the region. In turn, more vegetation would decrease the air pollution as well.
Water
Pristina City has limited quantities of surface waters and groundwaters, which are mainly distributed to peripheral areas. A small fraction of the available water is underground water, such as the Pajtimi field source that amounts to 50 litres/sec and the "Germia" source with 15 litres/sec.[14] Watercourses are scarce. There are small rivers in the urban area, such as Pristina River and Vellusha River that collect the water flows of creeks coming from Lagjia e Spitalit, Mati, Kodra e Trimave, and Vellusha. Pristina Rivers serve to collect rainwater from all urban areas of Pristina.
The main drinking water sources remain Batllava and Badovc Lakes. Batllava Lake has a capacity of 38 million m3 of water. With 65% of drinking water, Batllava represents the main source of drinking water for the municipality of Pristina. It was built in 1960-1963; initially it worked only for technical water supply to the Power plant complex in Obiliq. From 1982 it turned into water resource for drinking water for the Pristina region. Recently, the drinkwater treatment plant in Shajkovc was built, which has a maximum capacity of 900 liters/sec. Badovci Lake has a volume of 27 million m3 and supplies the town of Pristina with 35% of drinking water. It was initially built in 1960 for the supply of drinking water, irrigation, and technical water for Kishnica mine. From 1980 this lake is mainly used for drinking water purposes for Pristina region. The drinkwater treatment plant has been built in Badovc, which has a maximum capacity of 400 liters/sec. Those two lakes are the main source of potable water in Pristina. They both supply around 90% of population in Pristina region with drinking water.
However, the distribution network has many problems. Most of the pipes used are older than 50 years, which lose around 50% of available water; 35% are technical losses, while 15% are commercial losses. As a result, there are shortages on available water to citizens, with 8-10 hours/day water cuts to each household. A problem is the water contamination. There is no urban water monitoring in Kosovo. There are only regional water companies that do not have capacities on drinking water monitoring.
Contamination in waterbodies
Wastewater discharges remain the main pollutants of water in Pristina. Those wastes are dangerous because they contain substances such as soluble compounds of phosphorus, dissolved oxygen, pathogenic bacteria and viruses, nitrogen (eutrophication), and other matters that affect the water quality.[15] Main carrier of underground waters pollution is Prishtevka River, which at the same time is the main carrier of sewage and rainwater.
There are two major pollutors of waterbodies in Pristina, collective pollutors and commercial pollutors. Collective polluters are households and individuals that throw waste and wastewater in waterbodies or common canalization system. Industries are the largest commercial pollutants, such as agriculture, chemicals, and ironmongery. To Prishtevka River, there are six commercial and one collective pollutor. To Llapi River there are 15 collective and seven commercial pollutors. Sitnica River has 24 collective and seven commercial pollutors, and Gracanka River has three collective and one commercial polluter. The table below shows the individual pollutants in Pristina and their landfills.[16]
Municipality
Pollutant Name
Action
Receiving waterbody
Pristina
"Auto Parkingu"
Autopark Ironmongery
Prishtevke
"Erona Riciklim"
Ironmongery
Prishtevke
"Idea"
Food Industry
Prishtevke
"Kosova Tex"
Textile Industry
Prishtevke
"Kualiteti"
Slaughterhouse
Prishtevke
"Trafiku Urban"
Autopark Oficine
Underground water
"NTP Vjosa"
Food Industry
Prishtevke
Commercial Water Pollutors in Pristina
Sewage waters
In the city of Pristina the sewer system is intended to lead wastewater out of the city center but there is no controlled treatment of sewage waters. Waste waters are disposed towards rivers. Sitnica River is the main receiver of sewage waters coming from citizens of Pristina with a total amount of water discharged 800 litres/sec, from which 450 liter/sec come through Pristina River and 150 litres/sec through Vellusha River. Other amounts are taken through Shkabaj creek. There are only 8 settlements in Pristina with public or private canalization system. The table below presents selected districts of Pristina and their sewage waters dump sites.[16]
District
Inhabitants
Receiving waterbody
Pristina
"Qyteti"
43024.5
Prishtevke
"Bardhosh"
2150
Lumi Llap
"Barileve"
4200
Lumi Llap
"Besi"
907
Lumi Llap
"Hajvali"
6000
Gracanke
"Prroni i njelmet"
1000
Underground water
"Prugovc-Leban"
800
Lumi Llap
"Shkabaj"
1500
Sitnice
"Trude"
540
Lumi Llap
"Vranidoll"
870
Lumi Llap
Waterbody pollution in Pristina districts
As depicted in the table, the most polluted river with sewage waters is Prishtevka, with more than 400,000 inhabitants polluting it. Wastewaters are present also in Taukbashçe Park, causing smell and immission in the park under which elderly park visitor may suffer.[17]
Underground waters
Considering the problem of Pristina to sufficiently supply its citizens with water, underground water has been thought to be a solution for this problem. Kolevica underground waters have been the main water supplier for Pristina from 1950 to 1970. Those waters are placed in the northern side of Pristina, with a maximum capacity of 50 litres/sec. However, with the construction of Batllava River, those underground rivers were left unused, and now they form part of the polluted waters in Pristina. Germia Source is another underground water resource that lies in Germia Park ad is the oldest water sources known. It has been used many years ago, and it has a flow of 15 litres/sec. This source is used for Germia Basis, while in those days Germia's underground waters are considered to be the main source of water for Pristina citizens.
Wells in Pristina
There are hidden wells[clarification needed] in Pristina, which most of them are covered with waste and are in the most polluted areas of Pristina. These sources are used when surface water is lacking. Recently, water has been found in "Pajtimi" field, which currently is one of the waste polluted areas.[18] However, in an attempt to clean Pristina environment and also find water, the opening phase of these wells has started and they are estimated to be completed by mid-2014. In this place, 9 wells are found, and the flow is estimated at 60 litres/sec.
There are two other wells in Llukar village. Those wells are estimated to have a flow of 50 litres/sec. The problem with those two wells is their usage, mainly for auto washing. Those wells ceased being used in 1989, and they are expected to become active again by mid-2014.
A plan to plant trees in Pristina and lower air pollution has prompted that 17 artificial wells to be opened in Pristina. The Pristina municipal government has provided funding for these wells, which would supply the water the irrigation of the newly planted trees.[19]
The region of Pristina produces a high amount of waste. In 2007, 61.644.35 ton of waste have been collected only in Pristina, while in 2008, 80.185.06[clarification needed] tons of waste has been collected in Pristina.
No
Sanitarian Disposal
Jan
Feb
Mar
Apr
May
Jun
Jul
Aug
Sep
Oct
Nov
Dec
Total (ton)
1
Pristina
3665.45
4273.73
5032.07
5017.46
5239.63
4854.54
4938.13
5264.28
5005.82
6256
6413
5703.9
61664.35
No
Sanitarian Disposal
Jan
Feb
Mar
Apr
May
Jun
Jul
Aug
Sep
Oct
Nov
Dec
Total (ton)
1
Pristina
5904.90
5826.06
6250.23
6665.96
6377.97
7032.28
7712.59
7242.91
6114.45
7423.37
6351.12
7278.22
80185.06
Waste Collection in Pristina 2007 and 2008
Wild Landfill in Arberia district
The average amount of municipal waste disposal in Pristina is 0.9kg/day per person, while 332kg/year per person. If Pristina is compared with other municipalities, it can be seen that Pristina differs much more. in other municipalities this average is 95kg/year per person.[20] The problem relies in the disposal of this waste is done in (field-waste) municipal surface. Those waste disposals have not filled the minimum standard requirements for waste. They are settled near habitats and rivers, which most of time end up polluting the rivers also, especially underground waters and wells. Oftentimes those waste disposals are burned from nature, as well as from people. During summer they smell badly because most of waste is not even covered with grit. Some disposals in Pristina have been closed, with the aim to reduce those negative effects in the nature; however, still most of them remain uncovered.
Pristina regional waste disposal collects waste from Prishtinë, Obiliq, Lipjan, Fushë Kosovë and Drenas(Gllogoc). The size of this disposal is approximately 40 hectares, it has a life span of 15 years, and its total capacity is 3,500,000 m3 while its monthly capacity is 6000 tons. The status of this disposal is miserable, with a very bad smell causing many health implications to people.[20]
Local waste
As the capital city of Kosovo, Pristina has the largest number of inhabitants, which in turn means that it has the largest amount of waste disposal. Generation, collection, treatment, and elimination of waste in Pristinais done by "Pastrimi" Company, which covers the highest percentage of people with this service compared to other municipalities. In 2007 this company covered 64% of the population with this service, in 2008 52%, in 2009 53%, and in 2010 55%.[20] Collection of waste is done through two ways: 52% door-to-door collection and 48% for collective apartments.
Vendi i grumbullimit
Banesa kolektive
Dere me dere
Gjithsej
Njesia
1000 ton
Prishtina dhe religjioni
99,496
149,336
248,832
Waste collection in Pristina
In 2012, local yearly waste per capita was 515kg, while daily waste per capita was 1.4kg. The total amount of waste collected in Pristina is 248,832 ton. (cite 37) The collection of local waste in Pristina has increased from 2007 to 2012. In 2007 182,000 ton were collected, while in 2012 249,000 ton were collected. This is an example of an increase in the efficiency of waste collection. If Pristina is compared with the other regions, the collection of waste per capita is much higher. Only in 2012, the difference between Pristina and other regions collection of waste was 0.7kg.[21]
Industrial waste
Industrial waste contains substances in various aggregate forms that remained for a long time in different facilities, warehouses, and industrial units. Over time, the usage of some of these substances has expired or degraded by changing their composition, making them as highly hazardous substances for people's health.
As it can be seen, Kosovo A power plant is one of the largest pollutants with industrial waste, followed by Kishnica Laboratory.
Medicinal waste
This type of waste includes medicinal pills whose usage is not valid anymore. This sector in Pristina does not have a system of collection, transportation, or elimination. Even though new waste disposals have been set in hospital as well as in medicinal family centers, they are not being used as much. Medicinal pills are thrown in normal waste disposals. When medicinal pills stay for a long time without valid usage time, then they release dangerous substances for human's health. The Municipal Family Medicine Center in Pristina releases 60 tons/year medicinal waste.[20] Medicinal waste is found also in some pharmacies in Pristina. The central pharmacy of Pristina has declared 200kg of medical waste. Other pharmacies have also reported medical waste, such as the Agani Warehouse.
Land degradation
The continued impact of human activities on land causes land degradation, which is harmful for human and socio-economic environment. Since Pristina is the capital city of Kosovo, most of the population lives here. This means that land degradation issue is more present in the Pristina region; however, Pristina was always industrial-oriented city, with less agricultural land used for food cultivation. Land degradation happens because of the increased construction of settlements (unplanned constructions), road construction, industry (solid waste, surface mining), local and sanitary waste, erosion and uncontrolled exploitation of gravel.
Land usage
Below are some facts for land usage in Pristina Municipality:[citation needed]
Constructed Land: 2365.6 hectares or 30.45% of the total surface
Residential Areas: 2011.58 hectares. It is characterized with individual residence 23.17%, with only 2.72% collective residence.
Economic Areas: 217.94 hectares or 2.81% of total constructed areas belongs to the industrial development.
Educational Institutions: occupy a surface of 34.7 hectares or 0.45% of the constructed area.
Health Institutions: occupy a surface of 33.9 hectares or 0.44% of the constructed area.
Administrative Institutions: occupy a surface of 50.08 hectares or 0.64% of the constructed area.
Green Areas: 5023.05 hectares or 64.04% of the total area.
Specific Areas: 149.11 hectares or 1.92% of the total area.
Transport and Traffic Areas: 231 hectares or 2.97% of total area.
Ownership in Pristina Municipality is divided into two groups:
Public Ownership: 2695.21 hectares or 34.7%.
Private Ownership: 5073.48 hectares or 65.3%.
Degradation of agricultural land
Pristina has 9,155 hectares of agricultural land, from which 8508 hectares are irrigated. Since Pristina has highly polluted air, it is assumed that air pollution is also harming vegetation and soil layers. This happens through rainfall that washes pollutants from air and deposits it in soil. One of the most common ways of agricultural land degradation is the transformation of agricultural land into industrial land. According to the Ministry of Agriculture, Forestry and Rural Development, in the period from 1998 to 2006 one hectare of land in Pristina was transformed. However, the construction of Pristina started the last five years, with more people building apartments in each neighborhood of Pristina.[20]
The problem of land use re-dedication is happening with and without the permission of the municipality of Pristina. According to the Director of the Kosovo Agricultural association, land degradation is daily happening more and more, and the most endangered agricultural lands are located between Pristina and the Motorway to Skopje.[22]
Spatial planning
Spatial planning in Pristina is very important, given the enormous construction plans happening currently. The construction of collective apartments has started in Pristina the last five years, and some of them follow the directives for constructing from Pristina Municipality, but others do not. However, when dealing with spatial planning, it is very important to protect local zones from construction, especially parks that people use for recreational activities. One of the natural spatial areas protected from the municipality of Pristina is the Regional park "Germia."
Germia Protected Zone
-Germia national park Pristina 2014-01-29 12-19
Germia Regional Park lies in the northern part of Pristina and has a surface of 62 km2. Due to its biodiversity in fauna and flora, the park is protected and monitored by Hortikultura Public enterprise. Construction is prohibited. 610 types of vascular flora have been found in Germia separated into 82 families. 83 types of mushrooms have been found and 4 forest communities.[23]
Due to better air quality in the forest, most people use it as a recreational place. 4140.52 hectares of Germia are under the protected zone, starting from the Germia Basis and continue with fields, children parks and toys, and sporting centers. The status of Germia is a Protected Regional Park, including 1.126.01.00 hectares. Germia Park is evidenced as a protected zone in the international list of protected places. The boundaries of Germia are Miredita hills in the north towards the Hajvalia mining and Gracanica River. In the east the Badovci River, it continues with Busise River in the south, and vineyards in the west.
Environmental protection measures
During 2011–2012, the Ministry of the Environment and Spatial Planning in Kosovo, has formulated the Strategy for the protection of the Environment in Pristina. Those strategies have been created for the future of Pristina environment in 2015-2022. Those strategies entail specific plans and EU standards that Pristina needs to fulfill by the end of year 2022. Local Plans for Environmental Actions are mandatory for each municipality in Kosovo. In Pristina, this plan has been approved and it only waits for the starting period of implementation. This plan has been taken in cooperation with the Swedish Agence for International Development. The municipality of Pristina is developing and implementing this plan for other municipalities as well. 14 plans have been established for waste management in Pristina, according to the Kosovo Law for Waste.
↑ Alija, Avdulla J.; Bresgen, Nikolaus; Bojaxhi, Ekramije; Krenn, Margit; Bajraktari, Ismet D.; Eckl, Peter M. (2018). "River pollution in the Kosovo: Cyto- and genotoxic effects of water samples in the primary rat hepatocyte assay". Toxicology and Industrial Health. 34 (8): 563–570. Bibcode:2018ToxIH..34..563A. doi:10.1177/0748233718773027. PMID29871550.
This page is based on this Wikipedia article Text is available under the CC BY-SA 4.0 license; additional terms may apply. Images, videos and audio are available under their respective licenses.