Overview of expenditures in the United States federal budget
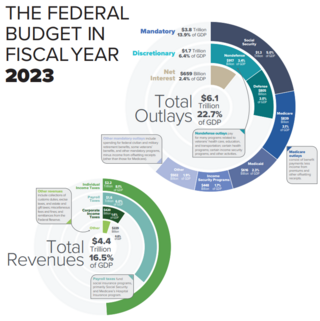
CBO: U.S. Federal spending and revenue components for fiscal year 2023. Major expenditure categories are healthcare, Social Security, and defense; income and payroll taxes are the primary revenue sources.
During FY2022, the federal government spent $6.3 trillion. Spending as% of GDP is 25.1%, almost 2 percentage points greater than the average over the past 50 years. Major categories of FY 2022 spending included: Medicare and Medicaid ($1,339B or 5.4% of GDP), Social Security ($1.2T or 4.8% of GDP), non-defense discretionary spending used to run federal Departments and Agencies ($910B or 3.6% of GDP), Defense Department ($751B or 3.0% of GDP), and net interest ($475B or 1.9% of GDP).[1]
Expenditures are classified as "mandatory", with payments required by specific laws to those meeting eligibility criteria (e.g., Social Security and Medicare), or "discretionary", with payment amounts renewed annually as part of the budget process, such as defense. Around two thirds of federal spending is for "mandatory" programs. CBO projects that mandatory program spending and interest costs will rise relative to GDP over the 2016–2026 period, while defense and other discretionary spending will decline relative to GDP.[2]
Discretionary vs. mandatory spending
US Federal Government OutlaysUS Federal Government expendituresThe expenditures of the United States federal government as a percentage of GDP over time.
Discretionary spending requires an annual appropriation bill, which is a piece of legislation. Discretionary spending is typically set by the House and Senate Appropriations Committees and their various subcommittees. Since the spending is typically for a fixed period (usually a year), it is said to be under the discretion of the Congress. Some appropriations last for more than one year (see Appropriation bill for details). In particular, multi-year appropriations are often used for housing programs and military procurement programs.
Direct spending, also known as mandatory spending, refers to spending enacted by law, but not dependent on an annual or periodic appropriation bill. Most mandatory spending consists of entitlement programs such as Social Security benefits, Medicare, and Medicaid. These programs are called "entitlements" because individuals satisfying given eligibility requirements set by past legislation are entitled to Federal government benefits or services. Many other expenses, such as salaries of Federal judges, are mandatory, but account for a relatively small share of federal spending.
The Congressional Budget Office (CBO) reports the costs of mandatory spending programs in a variety of annual and special topic publications.[3] Congress can affect spending on entitlement programs by changing eligibility requirements or the structure of programs. Certain entitlement programs, because the language authorizing them are included in appropriation bills, are termed "appropriated entitlements." This is a convention rather than a substantive distinction, since the programs, such as Food Stamps, would continue to be funded even if the appropriation bill were to be vetoed or otherwise not enacted.
The share of Federal spending for mandatory programs has been increasing as the U.S. population ages, while the discretionary spending share has fallen.[4]
CBO projects that spending for Social Security, healthcare programs and interest costs will rise relative to GDP between 2017 and 2027, while defense and other discretionary spending will decline relative to GDP.[5]
Over the past 40 years, mandatory spending for programs like Medicare and Social Security has grown as a share of the budget and relative to GDP, while other discretionary categories have declined. Medicare, Medicaid, and Social Security grew from 4.3% of GDP in 1971 to 10.7% of GDP in 2016.[5]
In the long-run, expenditures related to Social Security, Medicare, and Medicaid are growing considerably faster than the economy overall as the population matures.[6][7] The Congressional Budget Office (CBO) estimates that Social Security spending will rise from 4.8% of GDP in 2009 to 6.2% of GDP by 2035, where it will stabilize. However, the CBO expects Medicare and Medicaid to continue growing, rising from 5.3% GDP in 2009 to 10.0% in 2035 and 19.0% by 2082. CBO has indicated healthcare spending per beneficiary is the primary long-term fiscal challenge.[8][9] Further, multiple government and private sources have indicated the overall expenditure path is unsustainable.[10][11][12]
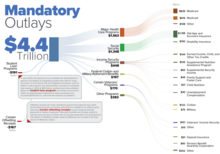
Mandatory spending of the US Federal Government in 2023.Table compares US federal spending and revenue in 2018 vs. 2017 using CBO historical data.Historical and projected US Federal Government revenues and spending from 2018 GAO financial reportMedicare & Social Security.
Social Security and Medicare expenditures are funded by permanent appropriations and so are considered mandatory spending according to the 1997 Budget Enforcement Act (BEA). Social Security and Medicare are sometimes called "entitlements," because people meeting relevant eligibility requirements are legally entitled to benefits, although most pay taxes into these programs throughout their working lives.
Some programs, such as Food Stamps, are appropriated entitlements. Some mandatory spending, such as Congressional salaries, is not part of any entitlement program. Funds to make federal interest payments have been automatically appropriated since 1847.
Major categories of FY 2014 mandatory spending included:
Social Security ($845B or 24% of spending),
Healthcare such as Medicare and Medicaid ($831B or 24%),
other mandatory programs such as food stamps and unemployment compensation ($420B or 12%) and interest ($229B or 6.5%).[5]
As a share of federal budget, mandatory spending has increased over time.[14] Mandatory spending accounted for 53% of total federal outlays in FY2008, with net interest payments accounting for an additional 8.5%.[15] In 2011, mandatory spending had increased to 56% of federal outlays.[14]
From 1991 to 2011, mandatory spending grew from 10.1 percent to 13.6 percent of GDP, according to figures from the Congressional Budget Office.[16] This spending is expected to continue to increase as a share of GDP. According to The Heritage Foundation, spending on Social Security, Medicare, and Medicaid will rise from 8.7% of GDP in 2010, to 11.0% by 2020 and to 18.1% by 2050.[17]
Since the federal government has historically collected about 18.4% of GDP in tax revenues, this means these three mandatory programs may absorb all federal revenues sometime around 2050.[18] Unless these long-term fiscal imbalances are addressed by reforms to these programs, raising taxes or drastic cuts in discretionary programs, the federal government will at some point be unable to pay its obligations without significant risk to the value of the dollar (inflation).[19][20]
According to the U.S. Census Bureau, in 2011 49.1% of the U.S. population lived in a household where at least one household member received a government benefit including Social Security and Medicare.[21][failed verification] This figure represented an increase from 30% in the early 1980s and 44.4% in 2008.[22] While federal outlay for welfare was reduced by half since 1996, programs such as food stamps have seen increases in spending.[23] In 2012, 35% of the U.S. population lived in a household that received government benefits, counting only means-tested programs such as food stamps, housing assistance and Medicaid.[24]
Mandatory programs are affected by demographic trends. The number of workers continues declining relative to those receiving benefits. For example, the number of workers per retiree was 5.1 in 1960; this declined to 3.3 in 2007 and is projected to decline to 2.1 by 2040.[25] According to census data for 2011, 16% of the population lived in a household where at least one individual received Social Security and 15% lived in a household where at least one individual received Medicare.[22] From 2012 to 2027, approximately 78 million individuals will retire and begin receiving Social Security and Medicare.[23]
These programs are also affected by per-person costs, which are also expected to increase at a rate significantly higher than the economy. The unfavorable combination of demographics and per-capita rate increases is expected to drive both Social Security and Medicare into large deficits during the 21st century. Multiple government sources have argued these programs are fiscally unsustainable as presently structured due to the extent of future borrowing and related interest required to fund them; here is a 2009 summary from the Social Security and Medicare Trustees:
The financial condition of the Social Security and Medicare programs remains challenging. Projected long run program costs are not sustainable under current program parameters. Social Security's annual surpluses of tax income over expenditures are expected to fall sharply this year and to stay about constant in 2010 because of the economic recession, and to rise only briefly before declining and turning to cash flow deficits beginning in 2016 that grow as the baby boom generation retires. The deficits will be made up by redeeming trust fund assets until reserves are exhausted in 2037, at which point tax income would be sufficient to pay about three fourths of scheduled benefits through 2083. Medicare's financial status is much worse. As was true in 2008, Medicare's Hospital Insurance (HI) Trust Fund is expected to pay out more in hospital benefits and other expenditures this year than it receives in taxes and other dedicated revenues. The difference will be made up by redeeming trust fund assets. Growing annual deficits are projected to exhaust HI reserves in 2017, after which the percentage of scheduled benefits payable from tax income would decline from 81 percent in 2017 to about 50 percent in 2035 and 30 percent in 2080. In addition, the Medicare Supplementary Medical Insurance (SMI) Trust Fund that pays for physician services and the prescription drug benefit will continue to require general revenue financing and charges on beneficiaries that grow substantially faster than the economy and beneficiary incomes over time.[10]
Since the government borrowed and spent the trust funds' assets, there is no "lockbox" or marketable investment portfolio of $2.4 trillion for Social Security or $380 billion for Medicare. The trust funds contain non-marketable treasury securities that the government is legally obligated to pay. In the absence of a balanced budget, the government will be required to convert these non-marketable securities to marketable securities by borrowing in the future, as trust fund claims are redeemed.[26][27]
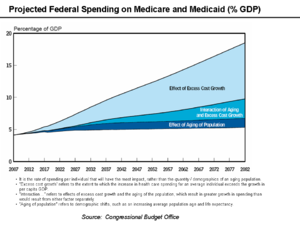
Medicare and Medicaid Spending as% GDP.The Medicare Trustees have reduced their forecast for Medicare costs as %GDP, mainly due to a lower rate of healthcare cost increases.
Medicare was established in 1965 and expanded thereafter. In 2009, the program covered an estimated 45 million persons (38 million aged and 7 million disabled). It consists of four distinct parts which are funded differently:
Part A (Hospital Insurance, or HI) covers inpatient hospital services, skilled nursing care, and home health and hospice care. The HI trust fund is mainly funded by a dedicated payroll tax of 2.9% of earnings, shared equally between employers and workers.
Part B (Supplementary Medical Insurance, or SMI) covers physician services, outpatient services, and home health and preventive services. The SMI trust fund is funded through beneficiary premiums (set at 25% of estimated program costs for the aged) and general revenues (the remaining amount, approximately 75%).
Part C (Medicare Advantage, or MA) is a private plan option for beneficiaries that covers all Part A and B services, except hospice. Individuals choosing to enroll in Part C must also enroll in Part B. Part C is funded through the HI and SMI trust funds.
Part D covers prescription drug benefits. Funding is included in the SMI trust fund and is financed through beneficiary premiums (about 25%) and general revenues (about 75%).[28]
Various reform strategies were proposed for healthcare, including Medicare and Medicaid. Examples include: comparative effectiveness research; independent review panels; modifying doctor incentives to focus on better care rather than fee for service; addressing a shortage of doctors and nurses; taxing healthcare benefits paid for by employers; addressing tort reform and defensive medicine; preventing obesity and related expensive conditions; addressing fraud; streamlining redundant payment systems; and improved healthcare technology.[29]
Growth in medical spending
Spending on Medicare and Medicaid is projected to grow dramatically in coming decades. The number of persons enrolled in Medicare is expected to increase from 47 million in 2010 to 80 million by 2030.[30] While the same demographic trends that affect Social Security also affect Medicare, rapidly rising medical prices appear to be a more important cause of projected spending increases.
The CBO has indicated that: "Future growth in spending per beneficiary for Medicare and Medicaid—the federal government’s major health care programs—will be the most important determinant of long-term trends in federal spending. Changing those programs in ways that reduce the growth of costs—which will be difficult, in part because of the complexity of health policy choices—is ultimately the nation’s central long-term challenge in setting federal fiscal policy." Further, the CBO also projects that "total federal Medicare and Medicaid outlays will rise from 4 percent of GDP in 2007 to 12 percent in 2050 and 19 percent in 2082—which, as a share of the economy, is roughly equivalent to the total amount that the federal government spends today. The bulk of that projected increase in health care spending reflects higher costs per beneficiary rather than an increase in the number of beneficiaries associated with an aging population."[31]
President Obama stated in May 2009: "But we know that our families, our economy, and our nation itself will not succeed in the 21st century if we continue to be held down by the weight of rapidly rising health care costs and a broken health care system...Our businesses will not be able to compete; our families will not be able to save or spend; our budgets will remain unsustainable unless we get health care costs under control."[32]
The present value of unfunded obligations under all parts of Medicare during FY 2007 is approximately $34.1 trillion. In other words, this amount would have to be set aside today such that the principal and interest would cover the shortfall over the next 75 years. This is over six times as large as the Social Security unfunded obligation of $5.3 trillion, discussed below.[33]
OASDI Income and Cost Rates Under Intermediate Assumptions. Source: 2009 OASDI Trustees Report.Note: CBO estimates that policy changes with a 0.6% of GDP annual impact are sufficient to address the 75-year program shortfall. Abbreviations are explained in the chart page. Source: CBO Report – July 2010.
Social Security is a social insurance program officially called "Old-Age, Survivors, and Disability Insurance" (OASDI), in reference to its three components. It is primarily funded through a dedicated payroll tax. During 2009, total benefits of $686 billion were paid out versus income (taxes and interest) of $807 billion, a $121 billion annual surplus. An estimated 156 million people paid into the program and 53 million received benefits, roughly 2.94 workers per beneficiary.[34] During 2008, total benefits of $625 billion were paid out versus income (taxes and interest) of $805 billion, a $180 billion annual surplus. An estimated 162 million people paid into the program and 51 million received benefits, roughly 3.2 workers per beneficiary.[35]
There is significant confusion about the program, due in part to the accounting for surplus payroll tax receipts and the agendas of various political constituencies. A few key points to understand under current law, if no reforms are implemented:
Social Security is funded by a dedicated payroll tax of 12.4%. This means that Social Security will be paid at least to the extent of payroll tax collections. Program payroll tax collections were roughly equal to payouts in 2010 and are estimated to fall to about 75% of payouts by the mid-2030s and continue around that level through the early 2080s. Claims that the program is "bankrupt" or "going bankrupt" can be evaluated in this context.
Since the Greenspan Commission in the early 1980s, Social Security has cumulatively collected far more in payroll taxes dedicated to the program than it has paid out to recipients—nearly $2.4 trillion by 2008. This surplus amount is commonly referred to as the "Social Security Trust Fund." This surplus amount has not added to the public debt; rather it is the spending of surplus funds dedicated to the program for other purposes that has added to the debt.
The Trust Fund represents a legal claim by Social Security recipients, enabling them to compel the government to borrow or otherwise fund 100% of program obligations as long as Trust Fund amounts remain. As sources of funds (other than the dedicated payroll taxes) are diverted to the program, the Trust Fund balance is reduced. Once the Trust Fund is liquidated in the mid-2030s under various estimates, program payouts will fall to about 75% of currently scheduled benefits. Social Security then becomes a true "pay as you go" program, without Trust Fund amounts to cover shortfalls.
Redemption of Trust Fund claims means that the government will have to borrow an additional $2.4 trillion in total (based on the 2008 Trust Fund balance) over approximately 20 years, from the time the program payouts begin to exceed tax collections around 2015 to the time the Trust Fund is exhausted in the mid-2030s. This is a funding challenge for the government overall, not just Social Security.[36][37]
Social Security spending will increase sharply over the next decades, largely due to the retirement of the baby boom generation. The number of program recipients is expected to increase from 44 million in 2010 to 73 million in 2030.[30] Program spending is projected to rise from 4.8% of GDP in 2010 to 5.9% of GDP by 2030, where it will stabilize.[38]
The CBO projected in 2010 that an increase in payroll taxes ranging from 1.6–2.1% of the payroll tax base, equivalent to 0.6%-0.8% of GDP, would be necessary to put the Social Security program in fiscal balance for the next 75 years.[39] In other words, raising the payroll tax rate to about 14.4% during 2009 (from the current 12.4%) or cutting benefits by 13.3% would address the program's budgetary concerns indefinitely; these amounts increase to around 16% and 24% if no changes are made until 2037. Projections of Social Security's solvency are sensitive to assumptions about rates of economic growth and demographic changes.[40]
Since recommendations of the Greenspan Commission were adopted in the early 1980s, Social Security payroll taxes have exceeded benefit payments. In FY2008, Social Security received $180 billion more in payroll taxes and accrued interest than it paid out in benefits. This annual surplus is credited to Social Security trust funds that hold special non-marketable Treasury securities. The Social Security surplus reduces the amount of U.S. Treasury borrowing from the public, as the surplus funds may be used for other government purposes. The total balance of the trust funds was $2.4 trillion in 2008 and is estimated to reach $3.7 trillion by 2016. At that point, payments will exceed payroll tax revenues, resulting in the gradual reduction of the trust funds balance as the securities are redeemed against other types of government revenues. By 2037, according to some estimates, the trust funds will be exhausted. Under current law, Social Security payouts would be reduced by 24% at that time, as only payroll taxes are authorized to cover benefits.[41]
The present value of unfunded obligations under Social Security as of January 1, 2009 has been estimated at approximately $5.3 trillion over a 75-year horizon. In other words, this amount would have to be set aside today such that the principal and interest would cover the shortfall over the next 75 years. The estimated annual shortfall averages 1.9% of the payroll tax base or 0.7% of gross domestic product. For a GDP of approximately $14 trillion in 2009, this 0.7% gap is roughly $100 billion per year or 5% of tax revenue. Over an infinite time horizon, these shortfalls average 3.4% of the payroll tax base and 1.2% of GDP.[42]
Various reforms have been debated for Social Security. Examples include reducing future annual cost of living adjustments (COLA) provided to recipients, raising the retirement age, and raising the income limit subject to the payroll tax ($106,800 in 2009).[43][44] The Urban Institute estimated the effects of solution alternatives during May 2010, including an estimated program deficit reduction for each:[45]
Reducing the COLA by one percentage point: 75%
Indexing the COLA to prices rather than wages, except for bottom one-third of income earners: 65%
Raising the payroll tax rate by one percentage point: 50%.
Raising the payroll tax cap (currently at $106,800) to cover 90% instead of 84% of earnings: 35%
Increasing the full retirement age to 68: 30%
The CBO reported in July 2010 the effects of a series of policy options on the "actuarial balance" shortfall, which over the 75 year horizon is approximately 0.6% of GDP. This is slightly different from the 0.7% estimated by the Social Security Trustees, as indicated above. For example, CBO estimates that raising the payroll tax by two percentage points (from 12.4% to 14.4%) over 20 years would increase annual program revenues by 0.6% of GDP, solving the 75-year shortfall. The various impacts are summarized in the CBO chart at right.[36]
CBO estimated in January 2012 that raising the full retirement age for Social Security from 67 to 70 would reduce outlays by about 13%. Raising the early retirement age from 62 to 64 has little impact, as those who wait longer to begin receiving benefits get a higher amount. Raising the retirement age increases the size of the workforce and the size of the economy by about 1%.[46]
This section needs to be updated. Please help update this article to reflect recent events or newly available information.(April 2019)
Defense Spending as% Outlays FY 1950–2007.Total United States Defense Outlays 1962-2024, $millions (2019-2024 estimated)
During FY 2009, the GAO reported that the U.S. government incurred approximately $683 billion in expenses for the Department of Defense (DoD) and $54 billion for Homeland Security, a total of $737 billion. The GAO financial statements present data on an accrual basis, meaning as expenses are incurred rather than actual cash payments.[47]
President Obama's 2010 budget proposal includes a total of $663.8 billion, including $533.8 billion for the DOD and $130 billion for overseas contingencies, primarily the wars in Iraq and Afghanistan. The proposed DoD base budget represents an increase of $20.5 billion over the $513.3 billion enacted for fiscal 2009. This is an increase of 4%, or 2.1% percent real growth after adjusting for inflation. The fiscal 2010 budget proposal brought the overseas contingency supplemental requests into the budget process, adding the $130 billion amount to the deficit.[48]
The U.S. defense budget (excluding spending for the wars in Iraq and Afghanistan, Homeland Security, and Veteran's Affairs) is around 4% of GDP.[49] Adding these other costs places defense and homeland security spending between 5% and 6% of GDP.
The DoD baseline budget, excluding supplemental funding for the wars, has grown from $297 billion in FY2001 to a budgeted $534 billion for FY2010, an 81% increase.[50] According to the CBO, defense spending grew 9% annually on average from fiscal year 2000–2009.[51]
Debate about military spending
Democratic Congressman Barney Frank called for a significant reduction in the defense budget during February 2009: "The math is compelling: if we do not make reductions approximating 25 percent of the military budget starting fairly soon, it will be impossible to continue to fund an adequate level of domestic activity even with a repeal of Bush's tax cuts for the very wealthy. I am working with a variety of thoughtful analysts to show how we can make very substantial cuts in the military budget without in any way diminishing the security we need...[American] well-being is far more endangered by a proposal for substantial reductions in Medicare, Social Security or other important domestic areas than it would be by canceling weapons systems that have no justification from any threat we are likely to face."[52]
U.S. Secretary of Defense Robert Gates wrote in January 2009 that the U.S. should adjust its priorities and spending to address the changing nature of threats in the world: "What all these potential adversaries—from terrorist cells to rogue nations to rising powers—have in common is that they have learned that it is unwise to confront the United States directly on conventional military terms. The United States cannot take its current dominance for granted and needs to invest in the programs, platforms, and personnel that will ensure that dominance's persistence. But it is also important to keep some perspective. As much as the U.S. Navy has shrunk since the end of the Cold War, for example, in terms of tonnage, its battle fleet is still larger than the next 13 navies combined—and 11 of those 13 navies are U.S. allies or partners."[53]
A pie chart showing global military expenditures by country for 2019, in US$ billions, according to SIPRI.
In 2009, the US Department of Defense's annual report to Congress on China's military strength offered several estimates of actual 2008 Chinese military spending. In terms of the prevailing exchange rate, Pentagon estimates range between US$105 and US$150 billion,[54] the second highest in the world after the US.
Budgetary treatment of Iraq & Afghanistan war expenses
CBO estimated in January 2010 that approximately $1.1 trillion was authorized for spending on the Iraq and Afghanistan Wars between 2001 and 2010. Spending peaked in 2008 at $187 billion and declined to $130 billion by 2010.[55]
Much of the costs for the wars in Iraq and Afghanistan have not been funded through regular appropriations bills, but through emergency supplemental appropriations bills. As such, most of these expenses were not included in the budget deficit calculation prior to FY2010. Some budget experts argue that emergency supplemental appropriations bills do not receive the same level of legislative care as regular appropriations bills.[56] In addition, emergency supplemental appropriations are not subject to the same budget enforcement mechanisms imposed on regular appropriations. Funding for the first stages of the Vietnam War was provided by supplemental appropriations, although President Johnson eventually acceded to Congressional demands to fund that war through the regular appropriations process.
Budget authority is legal authority to obligate the federal government. For many war-related activities there may be a long lag between the time when budget authority is granted and when payments (outlays) are made by the U.S. Treasury. In particular, spending on reconstruction activities in Iraq and Afghanistan has lagged behind available budget authority. In other cases, the military uses contracts that are payable upon completion, which can create long lags between appropriations and outlays.
In principle, the Department of Defense (DoD) separates war funding from base funding. In most cases, however, funds for operations in Iraq and Afghanistan use the same accounts as other DoD accounts. This raises challenges to attempts to achieve a precise separation of expenditures on operations in Iraq and Afghanistan from the base defense operations.
Discretionary spending
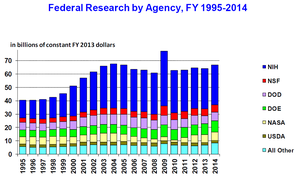
Breakdown of discretionary outlays of US Federal Government for 2023.FY 2013 Estimated Federal Spending per 2012 BudgetFederal funding of science and technology research by year. The spike in 2009 is due to the American Reinvestment and Recovery Act.
Discretionary spending is spending that is not mandated on a multi-year basis by existing legislation, and thus must be determined anew in each year's budget. Discretionary spending is used to fund the Cabinet Departments (e.g., the Department of Education) and Agencies (e.g., the Environmental Protection Agency), although these are often the recipients of some mandatory funding as well. Discretionary budget authority is established annually by Congress, as opposed to mandatory spending that is required by laws that span multiple years, such as Social Security or Medicare.
The Federal government spent approximately $600 billion during 2016 on the Cabinet departments and Agencies, excluding the Department of Defense, representing 16% of budgeted expenditures[5] or about 3.3% of GDP. The 2011 budget included estimated spending for 2010, shown in the graph at right for selected departments and agencies with over $10 billion in budget authority.
Funding for the Department of Defense is mostly discretionary, but is excluded from this total and analyzed separately in this article. However, certain defense-related spending is included in other departments, such as Homeland Security and Veteran's Affairs. The U.S. Constitution (Article I, Section 8) grants the Congress the authority to "To raise and support armies, but no appropriation of money to that use shall be for a longer term than two years."[58]
Several politicians and think tanks have proposed freezing non-defense discretionary spending at particular levels and holding this spending constant for various periods of time. President Obama proposed freezing discretionary spending representing approximately 12% of the budget in his 2011 State of the Union address.[59]
Interest expense
2023 Interest on federal debt
Interest expense on the public debt was approximately $678 billion in FY2023. During FY2023, the government also accrued a non-cash interest expense of $197 billion for intra-governmental debt, primarily the Social Security Trust Fund, for a total interest expense of $875 billion. This accrued interest is added to the Social Security Trust Fund and therefore the national debt each year and will be paid to Social Security recipients in the future. However, since it is a non-cash expense it is excluded from the budget deficit calculation.[60]
U.S. spending per person from 1980 to 2011. Blue line indicates nominal spending per person, while the cyan line is adjusted for inflation based on the Consumer Price Index (CPI) excluding food and energy.
Analytical perspectives
Federal spending per capita
Federal spending per capita (that is, per person in the U.S.) was approximately $11,551 during 2011, versus $6,338 in 2000. Adjusted for inflation, these amounts were $5,133 in 2011 and $3,496 in 2000. Adjusted for inflation, federal spending per person remained around $3,500 throughout the 1990s. It then began to rise steadily after 2000, then jumped in 2008 and 2009 due to the federal response to the subprime mortgage crisis.[61]
Related Research Articles
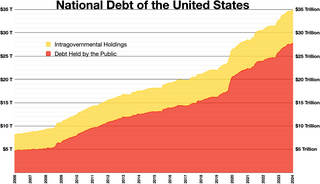
The national debt of the United States is the total national debt owed by the federal government of the United States to Treasury security holders. The national debt at any point in time is the face value of the then-outstanding Treasury securities that have been issued by the Treasury and other federal agencies. The terms "national deficit" and "national surplus" usually refer to the federal government budget balance from year to year, not the cumulative amount of debt. In a deficit year the national debt increases as the government needs to borrow funds to finance the deficit, while in a surplus year the debt decreases as more money is received than spent, enabling the government to reduce the debt by buying back some Treasury securities. In general, government debt increases as a result of government spending and decreases from tax or other receipts, both of which fluctuate during the course of a fiscal year. There are two components of gross national debt:
In American public finance, discretionary spending is government spending implemented through an appropriations bill. This spending is an optional part of fiscal policy, in contrast to social programs for which funding is mandatory and determined by the number of eligible recipients. Some examples of areas funded by discretionary spending are national defense, foreign aid, education and transportation.
This article concerns proposals to change the Social Security system in the United States. Social Security is a social insurance program officially called "Old-age, Survivors, and Disability Insurance" (OASDI), in reference to its three components. It is primarily funded through a dedicated payroll tax. During 2015, total benefits of $897 billion were paid out versus $920 billion in income, a $23 billion annual surplus. Excluding interest of $93 billion, the program had a cash deficit of $70 billion. Social Security represents approximately 40% of the income of the elderly, with 53% of married couples and 74% of unmarried persons receiving 50% or more of their income from the program. An estimated 169 million people paid into the program and 60 million received benefits in 2015, roughly 2.82 workers per beneficiary. Reform proposals continue to circulate with some urgency, due to a long-term funding challenge faced by the program as the ratio of workers to beneficiaries falls, driven by the aging of the baby-boom generation, expected continuing low birth rate, and increasing life expectancy. Program payouts began exceeding cash program revenues in 2011; this shortfall is expected to continue indefinitely under current law.
PAYGO is the practice in the United States of financing expenditures with funds that are currently available rather than borrowed.
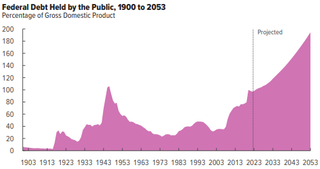
The United States budget comprises the spending and revenues of the U.S. federal government. The budget is the financial representation of the priorities of the government, reflecting historical debates and competing economic philosophies. The government primarily spends on healthcare, retirement, and defense programs. The non-partisan Congressional Budget Office provides extensive analysis of the budget and its economic effects. CBO estimated in February 2024 that Federal debt held by the public is projected to rise from 99 percent of GDP in 2024 to 116 percent in 2034 and would continue to grow if current laws generally remained unchanged. Over that period, the growth of interest costs and mandatory spending outpaces the growth of revenues and the economy, driving up debt. Those factors persist beyond 2034, pushing federal debt higher still, to 172 percent of GDP in 2054.
The budget of the United States government for fiscal year 2007 was produced through a budget process involving both the legislative and executive branches of the federal government. While the Congress has the constitutional "power of the purse", the President and his appointees play a major role in budget deliberations. Since 1976, the federal fiscal year has started on October 1 of each year.
The history of the United States public debt began with federal government debt incurred during the American Revolutionary War by the first U.S treasurer, Michael Hillegas, after the country's formation in 1776. The United States has continuously experienced fluctuating public debt, except for about a year during 1835–1836. To facilitate comparisons over time, public debt is often expressed as a ratio to gross domestic product (GDP). Historically, the United States public debt as a share of GDP has increased during wars and recessions, and subsequently declined.
The United States federal budget is divided into three categories: mandatory spending, discretionary spending, and interest on debt. Also known as entitlement spending, in US fiscal policy, mandatory spending is government spending on certain programs that are required by law. Congress established mandatory programs under authorization laws. Congress legislates spending for mandatory programs outside of the annual appropriations bill process. Congress can only reduce the funding for programs by changing the authorization law itself. This normally requires a 60-vote majority in the Senate to pass. Discretionary spending on the other hand will not occur unless Congress acts each year to provide the funding through an appropriations bill.
The United States federal budget for fiscal year 2009 began as a spending request submitted by President George W. Bush to the 110th Congress. The final resolution written and submitted by the 110th Congress to be forwarded to the President was approved by the House on June 5, 2008.
The United States Federal Budget for Fiscal Year 1997, was a spending request by President Bill Clinton to fund government operations for October 1996-September 1997. Figures shown in the spending request do not reflect the actual appropriations for Fiscal Year 1997, which must be authorized by Congress. The requested budget was submitted to Congress on February 5, 1996.
The 2012 United States federal budget was the budget to fund government operations for the fiscal year 2012, which lasted from October 1, 2011 through September 30, 2012. The original spending request was issued by President Barack Obama in February 2011. That April, the Republican-held House of Representatives announced a competing plan, The Path to Prosperity, emboldened by a major victory in the 2010 Congressional elections associated with the Tea Party movement. The budget plans were both intended to focus on deficit reduction, but differed in their changes to taxation, entitlement programs, defense spending, and research funding.
The Path to Prosperity: Restoring America's Promise was the Republican Party's budget proposal for the federal government of the United States in the fiscal year 2012. It was succeeded in March 2012 by "The Path to Prosperity: A Blueprint for American Renewal", the Republican budget proposal for 2013. Representative Paul Ryan, Chairman of the House Budget Committee, played a prominent public role in drafting and promoting both The Path to Prosperity proposals, and they are therefore often referred to as the Ryan budget, Ryan plan or Ryan proposal.
The 1996 United States federal budget is the United States federal budget to fund government operations for the fiscal year 1996, which was October 1995 – September 1996. This budget was the first to be submitted after the Republican Revolution in the 1994 midterm elections. Disagreements between Democratic President Bill Clinton and Republicans led by Speaker of the House Newt Gingrich resulted in the United States federal government shutdown of 1995 and 1996.
The 2013 United States federal budget is the budget to fund government operations for the fiscal year 2013, which began on October 1, 2012, and ended on September 30, 2013. The original spending request was issued by President Barack Obama in February 2012.
Political debates about the United States federal budget discusses some of the more significant U.S. budgetary debates of the 21st century. These include the causes of debt increases, the impact of tax cuts, specific events such as the United States fiscal cliff, the effectiveness of stimulus, and the impact of the Great Recession, among others. The article explains how to analyze the U.S. budget as well as the competing economic schools of thought that support the budgetary positions of the major parties.
Deficit reduction in the United States refers to taxation, spending, and economic policy debates and proposals designed to reduce the federal government budget deficit. Government agencies including the Government Accountability Office (GAO), Congressional Budget Office (CBO), the Office of Management and Budget (OMB), and the U.S. Treasury Department have reported that the federal government is facing a series of important long-run financing challenges, mainly driven by an aging population, rising healthcare costs per person, and rising interest payments on the national debt.
The United States fiscal cliff refers to the combined effect of several previously-enacted laws that came into effect simultaneously in January 2013, increasing taxes and decreasing spending.
Budget sequestration is a provision of United States law that causes an across-the-board reduction in certain kinds of spending included in the federal budget. Sequestration involves setting a hard cap on the amount of government spending within broadly defined categories; if Congress enacts annual appropriations legislation that exceeds these caps, an across-the-board spending cut is automatically imposed on these categories, affecting all departments and programs by an equal percentage. The amount exceeding the budget limit is held back by the Treasury and not transferred to the agencies specified in the appropriation bills. The word sequestration was derived from a legal term referring to the seizing of property by an agent of the court, to prevent destruction or harm, while any dispute over said property is resolved in court.
As a result of the Budget Control Act of 2011, a set of automatic spending cuts to United States federal government spending in particular of outlays were initially set to begin on January 1, 2013. They were postponed by two months by the American Taxpayer Relief Act of 2012 until March 1 when this law went into effect.
Government spending in the United States is the spending of the federal government of the United States and the spending of its state and local governments.
1 2 D. Andrew Austin; Mindy R. Levit (March 23, 2012). "Mandatory Spending Since 1962"(PDF). fas.org. Congressional Research Service. Retrieved November 27, 2012.
↑ U.S. Congressional Budget Office, An Analysis of the President's Budgetary Proposals for Fiscal Year 2010, June 2009.
This page is based on this Wikipedia article Text is available under the CC BY-SA 4.0 license; additional terms may apply. Images, videos and audio are available under their respective licenses.