There are two main uses of the term calibration in statistics that denote special types of statistical inference problems. "Calibration" can mean
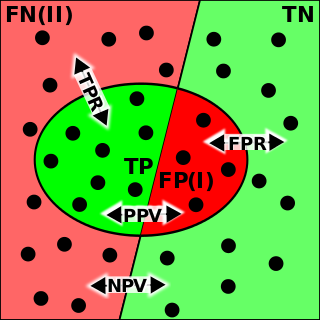
In the field of machine learning and specifically the problem of statistical classification, a confusion matrix, also known as error matrix, is a specific table layout that allows visualization of the performance of an algorithm, typically a supervised learning one; in unsupervised learning it is usually called a matching matrix.
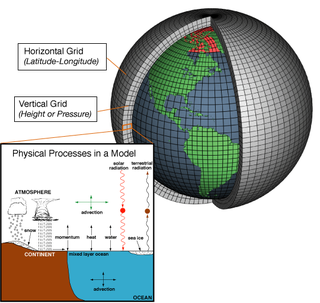
Numerical weather prediction (NWP) uses mathematical models of the atmosphere and oceans to predict the weather based on current weather conditions. Though first attempted in the 1920s, it was not until the advent of computer simulation in the 1950s that numerical weather predictions produced realistic results. A number of global and regional forecast models are run in different countries worldwide, using current weather observations relayed from radiosondes, weather satellites and other observing systems as inputs.
Ensemble forecasting is a method used in or within numerical weather prediction. Instead of making a single forecast of the most likely weather, a set of forecasts is produced. This set of forecasts aims to give an indication of the range of possible future states of the atmosphere. Ensemble forecasting is a form of Monte Carlo analysis. The multiple simulations are conducted to account for the two usual sources of uncertainty in forecast models: (1) the errors introduced by the use of imperfect initial conditions, amplified by the chaotic nature of the evolution equations of the atmosphere, which is often referred to as sensitive dependence on initial conditions; and (2) errors introduced because of imperfections in the model formulation, such as the approximate mathematical methods to solve the equations. Ideally, the verified future atmospheric state should fall within the predicted ensemble spread, and the amount of spread should be related to the uncertainty (error) of the forecast. In general, this approach can be used to make probabilistic forecasts of any dynamical system, and not just for weather prediction.
Data assimilation is a mathematical discipline that seeks to optimally combine theory with observations. There may be a number of different goals sought – for example, to determine the optimal state estimate of a system, to determine initial conditions for a numerical forecast model, to interpolate sparse observation data using knowledge of the system being observed, to set numerical parameters based on training a model from observed data. Depending on the goal, different solution methods may be used. Data assimilation is distinguished from other forms of machine learning, image analysis, and statistical methods in that it utilizes a dynamical model of the system being analyzed.
The Brier Score is a strictly proper score function or strictly proper scoring rule that measures the accuracy of probabilistic predictions. For unidimensional predictions, it is strictly equivalent to the mean squared error as applied to predicted probabilities.
In decision theory, a scoring rule provides a summary measure for the evaluation of probabilistic predictions or forecasts. It is applicable to tasks in which predictions assign probabilities to events, i.e. one issues a probability distribution as prediction. This includes probabilistic classification of a set of mutually exclusive outcomes or classes.

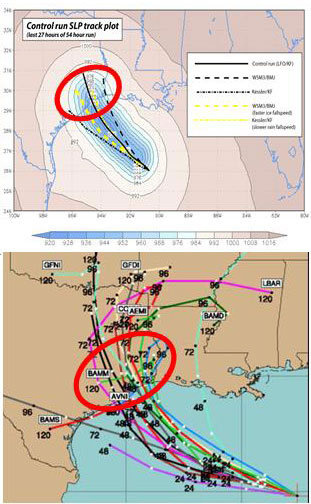
A tropical cyclone forecast model is a computer program that uses meteorological data to forecast aspects of the future state of tropical cyclones. There are three types of models: statistical, dynamical, or combined statistical-dynamic. Dynamical models utilize powerful supercomputers with sophisticated mathematical modeling software and meteorological data to calculate future weather conditions. Statistical models forecast the evolution of a tropical cyclone in a simpler manner, by extrapolating from historical datasets, and thus can be run quickly on platforms such as personal computers. Statistical-dynamical models use aspects of both types of forecasting. Four primary types of forecasts exist for tropical cyclones: track, intensity, storm surge, and rainfall. Dynamical models were not developed until the 1970s and the 1980s, with earlier efforts focused on the storm surge problem.
TAMDAR is a weather monitoring system that consists of an in situ atmospheric sensor mounted on commercial aircraft for data gathering. It collects information similar to that collected by radiosondes carried aloft by weather balloons. It was developed by AirDat LLC, which was acquired by Panasonic Avionics Corporation in April 2013 and was operated until October 2018 under the name Panasonic Weather Solutions. It is now owned by FLYHT Aerospace Solutions Ltd.
In weather forecasting, model output statistics (MOS) is a multiple linear regression technique in which predictands, often near-surface quantities, are related statistically to one or more predictors. The predictors are typically forecasts from a numerical weather prediction (NWP) model, climatic data, and, if applicable, recent surface observations. Thus, output from NWP models can be transformed by the MOS technique into sensible weather parameters that are familiar to a layperson.

Tropical cyclone forecasting is the science of forecasting where a tropical cyclone's center, and its effects, are expected to be at some point in the future. There are several elements to tropical cyclone forecasting: track forecasting, intensity forecasting, rainfall forecasting, storm surge, tornado, and seasonal forecasting. While skill is increasing in regard to track forecasting, intensity forecasting skill remains unchanged over the past several years. Seasonal forecasting began in the 1980s in the Atlantic basin and has spread into other basins in the years since.

The quantitative precipitation forecast is the expected amount of melted precipitation accumulated over a specified time period over a specified area. A QPF will be created when precipitation amounts reaching a minimum threshold are expected during the forecast's valid period. Valid periods of precipitation forecasts are normally synoptic hours such as 00:00, 06:00, 12:00 and 18:00 GMT. Terrain is considered in QPFs by use of topography or based upon climatological precipitation patterns from observations with fine detail. Starting in the mid-to-late 1990s, QPFs were used within hydrologic forecast models to simulate impact to rivers throughout the United States. Forecast models show significant sensitivity to humidity levels within the planetary boundary layer, or in the lowest levels of the atmosphere, which decreases with height. QPF can be generated on a quantitative, forecasting amounts, or a qualitative, forecasting the probability of a specific amount, basis. Radar imagery forecasting techniques show higher skill than model forecasts within 6 to 7 hours of the time of the radar image. The forecasts can be verified through use of rain gauge measurements, weather radar estimates, or a combination of both. Various skill scores can be determined to measure the value of the rainfall forecast.

In pattern recognition, information retrieval, object detection and classification, precision and recall are performance metrics that apply to data retrieved from a collection, corpus or sample space.

The history of numerical weather prediction considers how current weather conditions as input into mathematical models of the atmosphere and oceans to predict the weather and future sea state has changed over the years. Though first attempted manually in the 1920s, it was not until the advent of the computer and computer simulation that computation time was reduced to less than the forecast period itself. ENIAC was used to create the first forecasts via computer in 1950, and over the years more powerful computers have been used to increase the size of initial datasets as well as include more complicated versions of the equations of motion. The development of global forecasting models led to the first climate models. The development of limited area (regional) models facilitated advances in forecasting the tracks of tropical cyclone as well as air quality in the 1970s and 1980s.
Forecast verification is a subfield of the climate, atmospheric and ocean sciences dealing with validating, verifying and determining the predictive power of prognostic model forecasts. Because of the complexity of these models, forecast verification goes a good deal beyond simple measures of statistical association or mean error calculations.
The North American Ensemble Forecast System (NAEFS) is a joint project involving the Meteorological Service of Canada (MSC) in Canada, the National Weather Service (NWS) in the United States, and the National Meteorological Service of Mexico (NMSM) in Mexico providing numerical weather prediction ensemble guidance for the 1- to 16-day forecast period. The NAEFS combines the Canadian MSC and the US NWS global ensemble prediction systems, improving probabilistic operational guidance over what can be built from any individual country's ensemble. Model guidance from the NAEFS is incorporated into the forecasts of the respective national agencies.
The cost-loss model, also called the cost/loss model or the cost-loss decision model, is a model used to understand how the predicted probability of adverse events affects the decision of whether to take a costly precautionary measure to protect oneself against losses from that event. The threshold probability above which it makes sense to take the precautionary measure equals the ratio of the cost of the preventative measure to the loss averted, and this threshold is termed the cost/loss ratio or cost-loss ratio. The model is typically used in the context of using prediction about weather conditions to decide whether to take a precautionary measure or not.
The evaluation of binary classifiers compares two methods of assigning a binary attribute, one of which is usually a standard method and the other is being investigated. There are many metrics that can be used to measure the performance of a classifier or predictor; different fields have different preferences for specific metrics due to different goals. For example, in medicine sensitivity and specificity are often used, while in computer science precision and recall are preferred. An important distinction is between metrics that are independent on the prevalence, and metrics that depend on the prevalence – both types are useful, but they have very different properties.
Non-homogeneous Gaussian regression (NGR) is a type of statistical regression analysis used in the atmospheric sciences as a way to convert ensemble forecasts into probabilistic forecasts. Relative to simple linear regression, NGR uses the ensemble spread as an additional predictor, which is used to improve the prediction of uncertainty and allows the predicted uncertainty to vary from case to case. The prediction of uncertainty in NGR is derived from both past forecast errors statistics and the ensemble spread. NGR was originally developed for site-specific medium range temperature forecasting, but has since also been applied to site-specific medium-range wind forecasting and to seasonal forecasts, and has been adapted for precipitation forecasting. The introduction of NGR was the first demonstration that probabilistic forecasts that take account of the varying ensemble spread could achieve better skill scores than forecasts based on standard Model output statistics approaches applied to the ensemble mean.
Glenn Brier was an American statistician, weather forecaster and academic.
