Fundamentally based indexes

Last updated

Fundamentally based indexes or fundamental indexes, also called fundamentally weighted indexes, are indexes in which stocks are weighted according to factors related to their fundamentals such as earnings, dividends and assets, commonly used when performing corporate valuations. Indexes that use a composite of several fundamental factors attempt to average out sector biases that may arise from relying on a single fundamental factor. A key belief behind the fundamental index methodology is that underlying corporate accounting/valuation figures are more accurate estimators of a company's intrinsic value, rather than the listed market value of the company, i.e. that one should buy and sell companies in line with their accounting figures rather than according to their current market prices. In this sense fundamental indexing is linked to so-called fundamental analysis.

Contents

The fundamental factors commonly used by fundamental index managers are sales, earnings, book value, cash flow and dividends. Even the number of employees have been used in empirical studies on fundamental indexation. Fundamental indices are often contrasted to capitalization-weighted indices. Fundamentally based indices were arguably pioneered by Research Affiliates (RA), which first circulated research on the methodology in mid-2004. However, the method is in practice very similar to the so-called Core Equity Strategy-method launched by Dimensional Fund Advisors (DFA) during the same year. They are similar since DFA evaluates weight of small cap stocks and value stocks in a direct way whereas RA evaluates weight of small cap stocks and value stocks in a more indirect way. Furthermore, fundamental indexation is also seen by some people as merely a practical application and repackaging of the findings of one of the most famous journal articles in modern financial economics: "The Cross-Section of Expected Stock Returns" by Fama & French (1992). [1] This is because the key characteristic of fundamental indices is that they have a combined relative small cap and value stock tilt vs. a capitalization-weighted index, which is for example explicitly shown in a Swedish context by Olof Andersson (2009) in his Thesis "Irrational Indexation". [2] Fundamental indices ride on the small cap and the value stock premiums which have been present in international stock markets during the last 30–40 years so it is not strange that they might beat the market.

Rationale of weighting by fundamentals versus other methods of index weighting

The traditional method of capitalization-weighting indices might by definition imply overweighting overvalued stocks and underweighting undervalued stocks, assuming a price inefficiency. [3] Since investors cannot observe the true fair value of a company, they cannot remove inefficiency altogether but may be able to remove the systematic inefficiency that is arguably inherent in capitalization-weighted indices. Equal-weighting is one method to remove this claimed inefficiency but suffers from high turnover, high volatility, and the requirement to invest potentially large sums in illiquid stocks. [4]

Weighting by fundamental factors avoids the pitfalls of equal weighting while still removing the claimed systematic inefficiency of capitalization weighting. [5] It weights industries by fundamental factors (also called "Main Street" factors [6] ) such as sales, book value, dividends, earnings, or employees. [5] If a stock’s price gets either too high or too low relative to its fair value, weighting by fundamentals will not reflect this bias as far as there is not perfect correlation between stock prices and economic fundamentals. However, the correlation is quite close since the economic fundamentals used are commonly driving the value of a stock. If we assume no correlation in line with Robert Arnott, this arguably prevents fundamentally based indices from participating in bubbles and crashes and thus reduces its volatility while delivering a higher return. [7] However, the strong underperformance of fundamental indices in 2008 when companies such as banks with large fundamentals crashed has shown that it may not prevent it from participating in stock market crashes. When fundamentals change rapidly so may the stock price. [2]

Empirical evidence

If the assumptions of the Capital Asset Pricing Model (CAPM) do not hold then there could be three states of the world in line with the so-called joint hypothesis problem explained by Campbell (1997): [8]

  1. The capitalization-weighted market portfolio is not efficient. [9]
  2. The CAPM model is not an efficient pricing model.
  3. Both the cap-weighted market portfolio and the CAPM model are inefficient.

If we assume that the capitalization-weighted market portfolio is not efficient, assuming a pricing inefficiency, capitalization-weighting might be sub-optimal and the degree of sub-performance might be proportional to the degree of random noise. [3] [10] [11]

Forty years of back-tested Indices weighted by any of several fundamental factors including sales, EBIT, earnings, cash flow, book value, or dividends in U.S. markets outperformed the S&P 500 by approximately 2% per annum with volatility similar to the S&P 500. Thus, fundamentally based indices also had a higher Sharpe ratio than capitalization-weighted indices. [5] In non-U.S. markets, fundamentally based indices outperformed capitalization weighted indices by approximately 2.5% with slightly less volatility and outperformed in all 23 MSCI EAFE countries. [12]

Financial economists — Walkshäusl and Lobe — investigate the performance of global and 50 country-specific (28 developed and 22 emerging) fundamentally weighted indices compared to capitalization-weighted indices between 1982 and 2008. First, they establish that superior performance of domestic indices diminishes considerably when applying a bootstrap procedure for robust performance testing. Second, even after controlling for data snooping biases and the value premium, they find evidence that fundamental indexing produces economically and statistically significant positive alphas. This holds for global and country-specific versions which are heavily weighted in the world portfolio. [13]

In a 2023 empirical update, Research Affiliates confirmed the original 2004 research with a finding that fundamental indexation outperformed the Russell 1000 Index by 1.5% with equal volatility from 1988-2022. The paper found a smaller outperformance of 0.6% from 2005-2022, which the authors attributed to the extraordinary outperformance of growth stocks compared to value stocks in the post-GFC period. [14]

Criticisms and responses

Since the first research was disseminated, fundamentally based indices have been criticized by proponents of capitalization weighting including John Bogle, Burton Malkiel, and William Sharpe. The opposing opinions rely heavily on opposing assumptions. Proponents claiming a new revolutionary paradigm in index fund investing such as for example Robert D. Arnott, Jeremy Siegel and Jack Treynor — all affiliated with fundamental index funds — assume somewhat irrational markets whereas the opponents mentioned — some affiliated with conventional index funds — assume more rational and efficient markets. Responses to criticisms have come primarily from the publications of one of the founders of fundamentally based indices, Robert Arnott.

Notes

  1. Fama, Eugene F.; French, Kenneth R. (1992). "The Cross-Section of Expected Stock Returns". Journal of Finance 47 (2): 427–465
  2. 1 2 "Andersson, Olof. "Irrational Indexation"". September 28, 2009.
  3. 1 2 Hsu, Jason. Journal of Investment Management, Vol. 4, No. 3, (2006), pp. 1–10
  4. 1 2 "Rob Arnott Discusses the Fundamental Approach to Stock Market Indexing with PIMCO". June 2005.
  5. 1 2 3 "Arnott, Robert. Hsu, Jason. Moore, Phil. "Fundamental Indexation." Financial Analyst Journal. Volume 61. Number 2" (PDF). 2005.
  6. "Burns, Scott. "Weight watching for funds." The Dallas Morning News". November 29, 2004.
  7. "Morris, Sonya. "What's the Right Way to Index?"". December 12, 2006.
  8. Campbell, J.Y., A.W. Lo, and C. MacKinlay, The Econometrics of Financial Markets, Princeton University Press, Princeton, NJ, 1997):
  9. "Markowitz, Harry. "Market Efficiency: A Theoretical Distinction and So What?". Financial Analysts Journal, Vol. 61, No. 5, pp. 17–30, September/October 2005" (PDF).
  10. Arnott, Robert. Hsu, Jason. Journal of Investment Management, Vol. 5, No. 1, (2007), pp. 1–11.
  11. Treynor, Jack L. 2005. “Why Fundamental Indexing Beats Cap-Weighted Portfolios.”
  12. "Fundamental Index Newsletter, December 2007" (PDF).
  13. Walkshäusl, Christian and Lobe, Sebastian, Fundamental Indexing Around the World (August 25, 2009). Available at SSRN: http://ssrn.com/abstract=1364450
  14. Arnott, Leadbetter, Nguyen (February 2023). "RAFI Rocks!! Taking Smart Beta Back to Basics". ResearchAffiliates.com.{{cite web}}: CS1 maint: multiple names: authors list (link)
  15. "Fund Times: Gross, Sauter speak at Morningstar Conference". June 24, 2005.
  16. Lauricella, Tom. Gullapalli, Diya. “Not All Index ETFs Are What They Seem to Be.” Wall Street Journal. July 21st, 2006.
  17. "Buttonwood. "Weights and Measures." The Economist". The Economist . December 13, 2006.
  18. "Spence, John. "ETFs claiming superior stock selection draw fire." Investor's Business Daily". February 13, 2006. Archived from the original on September 29, 2007. Retrieved January 9, 2007.
  19. Bogle, John C. Malkiel, Burton G. “Turn on a Paradigm?” Wall Street Journal, Page A-14. June 27th, 2006.
  20. "Rob Arnott Discusses Fundamental Indexes". December 1, 2005. Archived from the original on November 29, 2006. Retrieved January 9, 2007.{{cite web}}: More than one of |archivedate= and |archive-date= specified (help); More than one of |archiveurl= and |archive-url= specified (help)
  21. "Rob Arnott and Fundamental Indexes Revisited". September 23, 2005. Archived from the original on October 27, 2006. Retrieved January 9, 2007.{{cite web}}: More than one of |archivedate= and |archive-date= specified (help); More than one of |archiveurl= and |archive-url= specified (help)
  22. "Hajim, Corey. "A better way to index?" Fortune". CNN. October 30, 2006.
  23. Hsu, Jason C. Campollo, Carmen. “New Frontiers in Index Investing.” Journal of Indexes. January / February 2006.
  24. Arnott, Robert D. West, John M. “Fundamental Indexes: Current and Future Applications.” Institutional Investor's fifth annual Exchange-Traded Funds review.
  25. Clements, Jonathan. “Getting Going When Good Index Funds Go Bad - The Case for a `Fundamental' Strategy.” Wall Street Journal. September 21st, 2006.
  26. "Wang, Penelope. "The Unlikeliest Bubble." Money". CNN. September 1, 2006.
  27. "Carrel, Lawrence. "Index Wars" SmartMoney.com". August 16, 2006.
  28. Schwab Asset Management website, Fundamental Index ETFs (March 31, 2024). "Schwab Fundamental US Large Company Index Fund". schwabassetmanagement.com.
  29. Pysarenko, Sergiy; Alexeev, Vitali; Tapon, Francis (2019-03-01). "Predictive blends: Fundamental Indexing meets Markowitz". Journal of Banking & Finance. 100: 28–42. doi:10.1016/j.jbankfin.2018.12.016. hdl: 10453/135914 . ISSN   0378-4266. S2CID   158400831.
  30. Cuthbertson, Keith; Nitzsche, Dirk (2005-05-05). Quantitative Financial Economics: Stocks, Bonds and Foreign Exchange. John Wiley & Sons. ISBN   9780470091722.

Related Research Articles

Passive management is an investing strategy that tracks a market-weighted index or portfolio. Passive management is most common on the equity market, where index funds track a stock market index, but it is becoming more common in other investment types, including bonds, commodities and hedge funds.

An index fund is a mutual fund or exchange-traded fund (ETF) designed to follow certain preset rules so that it can replicate the performance ("track") of a specified basket of underlying investments. While index providers often emphasize that they are for-profit organizations, index providers have the ability to act as "reluctant regulators" when determining which companies are suitable for an index. Those rules may include tracking prominent indices like the S&P 500 or the Dow Jones Industrial Average or implementation rules, such as tax-management, tracking error minimization, large block trading or patient/flexible trading strategies that allow for greater tracking error but lower market impact costs. Index funds may also have rules that screen for social and sustainable criteria.

<span class="mw-page-title-main">CAC 40</span> Blue chip stock market index

The CAC 40 is a benchmark French stock market index. The index represents a capitalization-weighted measure of the 40 most significant stocks among the 100 largest market caps on the Euronext Paris. It is a price return index. It is one of the main national indices of the pan-European stock exchange group Euronext alongside Euronext Amsterdam's AEX, Euronext Brussels' BEL20, Euronext Dublin's ISEQ 20, Euronext Lisbon's PSI-20 and the Oslo Bors OBX Index. It is an index without dividends. Cotation operates every working day from 9:00 a.m. to 5:30 p.m. It is updated every 15 seconds.

<span class="mw-page-title-main">S&P 500</span> American stock market index

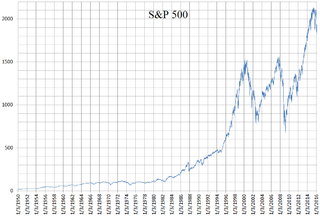
The Standard and Poor's 500, or simply the S&P 500, is a stock market index tracking the stock performance of 500 of the largest companies listed on stock exchanges in the United States. It is one of the most commonly followed equity indices and includes approximately 80% of the total market capitalization of U.S. public companies, with an aggregate market cap of more than $43 trillion as of January 2024.

In finance, arbitrage pricing theory (APT) is a multi-factor model for asset pricing which relates various macro-economic (systematic) risk variables to the pricing of financial assets. Proposed by economist Stephen Ross in 1976, it is widely believed to be an improved alternative to its predecessor, the capital asset pricing model (CAPM). APT is founded upon the law of one price, which suggests that within an equilibrium market, rational investors will implement arbitrage such that the equilibrium price is eventually realised. As such, APT argues that when opportunities for arbitrage are exhausted in a given period, then the expected return of an asset is a linear function of various factors or theoretical market indices, where sensitivities of each factor is represented by a factor-specific beta coefficient or factor loading. Consequently, it provides traders with an indication of ‘true’ asset value and enables exploitation of market discrepancies via arbitrage. The linear factor model structure of the APT is used as the basis for evaluating asset allocation, the performance of managed funds as well as the calculation of cost of capital. Furthermore, the newer APT model is more dynamic being utilised in more theoretical application than the preceding CAPM model. A 1986 article written by Gregory Connor and Robert Korajczyk, utilised the APT framework and applied it to portfolio performance measurement suggesting that the Jensen coefficient is an acceptable measurement of portfolio performance.

The Bovespa Index, best known as Ibovespa is the benchmark index of about 86 stocks traded on the B3, accounting for the majority of trading and market capitalization in the Brazilian stock market. It is a weighted measurement index.

<span class="mw-page-title-main">Russell 2000 Index</span> US small-cap stock market index

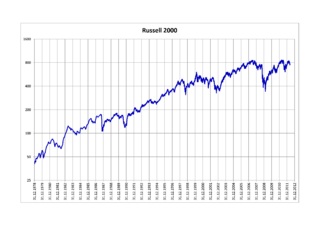
The Russell 2000 Index is a small-cap U.S. stock market index that makes up the smallest 2,000 stocks in the Russell Index. It was started by the Frank Russell Company in 1984. The index is maintained by FTSE Russell, a subsidiary of the London Stock Exchange Group (LSEG).

Active management is an approach to investing. In an actively managed portfolio of investments, the investor selects the investments that make up the portfolio. Active management is often compared to passive management or index investing.

<span class="mw-page-title-main">S&P/TSX Composite Index</span> Canadian stock market index

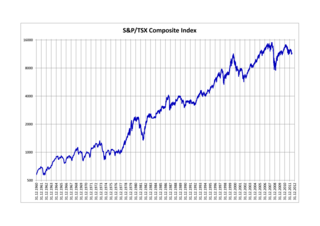
The S&P/TSX Composite Index is the benchmark Canadian index representing roughly 70% of the total market capitalization on the Toronto Stock Exchange (TSX). Having replaced the TSE 300 Composite Index on May 1, 2002, as of September 20, 2021 the S&P/TSX Composite Index comprises 237 of the 3,451 companies listed on the TSX. The index reached an all-time closing high of 22,185.25 on April 1, 2024 and an intraday record high of 22,220.91 on March 28, 2024.

The EURO STOXX 50 is a stock index of Eurozone stocks designed by STOXX, an index provider owned by Deutsche Börse Group. The index is composed of 50 stocks from 11 countries in the Eurozone.

A capitalization-weightedindex, also called a market-value-weighted index is a stock market index whose components are weighted according to the total market value of their outstanding shares. Every day an individual stock's price changes and thereby changes a stock index's value. The impact that individual stock's price change has on the index is proportional to the company's overall market value, in a capitalization-weighted index. In other types of indices, different ratios are used.

<span class="mw-page-title-main">Swiss Market Index</span> Blue-chip stock market index of Switzerland

The Swiss Market Index (SMI) is Switzerland's blue-chip stock market index, which makes it the most followed in the country. It is made up of 20 of the largest and most liquid Swiss Performance Index (SPI) stocks. As a price index, the SMI is not adjusted for dividends.

The S&P/ASX 300, or simply, ASX 300, is a stock market index of Australian stocks listed on the Australian Securities Exchange (ASX). The index is market-capitalisation weighted, meaning each company included is in proportion to the indexes total market value, and float-adjusted, meaning the index only considers shares available to public investors.

In asset pricing and portfolio management the Fama–French three-factor model is a statistical model designed in 1992 by Eugene Fama and Kenneth French to describe stock returns. Fama and French were colleagues at the University of Chicago Booth School of Business, where Fama still works. In 2013, Fama shared the Nobel Memorial Prize in Economic Sciences for his empirical analysis of asset prices. The three factors are (1) market excess return, (2) the outperformance of small versus big companies, and (3) the outperformance of high book/market versus low book/market companies. There is academic debate about the last two factors.

<span class="mw-page-title-main">Stock market index</span> Financial metric which investors use to determine market performance

In finance, a stock index, or stock market index, is an index that measures the performance of a stock market, or of a subset of a stock market. It helps investors compare current stock price levels with past prices to calculate market performance.

<span class="mw-page-title-main">Low-volatility anomaly</span>

In investing and finance, the low-volatility anomaly is the observation that low-volatility stocks have higher returns than high-volatility stocks in most markets studied. This is an example of a stock market anomaly since it contradicts the central prediction of many financial theories that taking higher risk must be compensated with higher returns.

Returns-based style analysis (RBSA) is a statistical technique used in finance to deconstruct the returns of investment strategies using a variety of explanatory variables. The model results in a strategy's exposures to asset classes or other factors, interpreted as a measure of a fund or portfolio manager's investment style. While the model is most frequently used to show an equity mutual fund’s style with reference to common style axes, recent applications have extended the model’s utility to model more complex strategies, such as those employed by hedge funds.

In portfolio management, the Carhart four-factor model is an extra factor addition in the Fama–French three-factor model, proposed by Mark Carhart. The Fama-French model, developed in the 1990, argued most stock market returns are explained by three factors: risk, price and company size. Carhart added a momentum factor for asset pricing of stocks. The Four Factor Model is also known in the industry as the Monthly Momentum Factor (MOM). Momentum is the speed or velocity of price changes in a stock, security, or tradable instrument.

VN30 Equal Weight Index tracks the total performance of the top 30 large-cap, liquid stocks listed on the Ho Chi Minh City stock exchange along with two popular indices in Vietnam: VN Index and VN30 Index. All index constituents are equal-weighted to help investors deal with liquidity, foreign ownership and state-owned enterprise constraints when investing in Vietnam.