Public health is another focus area that has made increasing use of GIS techniques. A strict definition of public health is difficult to pin down, as it is used in different ways by different groups. In general, public health differs from personal health in that it is (1) focused on the health of populations rather than of individuals, (2) focused more on prevention than on treatment, and (3) operates in a mainly governmental (rather than private) context.[1] These efforts fall naturally within the domain of problems requiring use of spatial analysis as part of the solution, and GIS and other spatial analysis tools are therefore recognized as providing potentially transformational capabilities for public health efforts.
This article presents some history of use of geographic information and geographic information systems in public health application areas, provides some examples showing the utilization of GIS techniques in solving specific public health problems, and finally addresses several potential issues arising from increased use of these GIS techniques in the public health arena.
History
Dr. Snow's map showing cholera cases in London during the epidemic of 1854
Public health efforts have been based on analysis and use of spatial data for many years. Dr. John Snow (physician), often credited as the father of epidemiology, is arguably the most famous of those examples.[2] Dr. Snow used a hand-drawn map to analyze the geographic locations of deaths related to cholera in London in the mid-1850s. His map, which superimposed the locations of cholera deaths with those of public water supplies, pinpointed the Broad Street pump as the most likely source of the cholera outbreak. Removal of the pump handle led to a rapid decline in the incidence of cholera, helping the medical community to eventually conclude that cholera was a water-borne disease.[citation needed]
Dr. Snow's work provides an indication of how a GIS could benefit public health investigations and other research. He continued to analyze his data, eventually showing that the incidence rate of cholera was also related to local elevation as well as soil type and alkalinity. Low-lying areas, particularly those with poorly draining soil, were found to have higher incidence rates for cholera, which Dr. Snow attributed to the pools of water that tended to collect there, again showing evidence that cholera was in fact a water-borne disease (rather than one borne by 'miasma' as was commonly believed at the time.[3]
This is an early example of what has come to be known as disease diffusion mapping, an area of study based on the idea that a disease starts from some source or central point and then spreads throughout the local area according to patterns and conditions there. This is another area of research where the capabilities of a GIS have been shown to be of help to practitioners.[citation needed]
GIS for public health
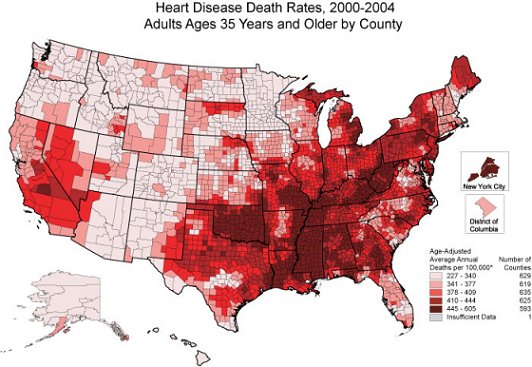
More modern disease map showing deaths from heart disease among white males in the US from 2000–2004
Today’s public health problems are much larger in scope than those Dr. Snow faced, and researchers today depend on modern GIS and other computer mapping applications to assist in their analyses. For example, see the map to the right depicting death rates from heart disease among white males above age 35 in the US between 2000 and 2004.[4]
Public health informatics (PHI) is an emerging specialty which focuses on the application of information science and technology to public health practice and research.[3] As part of that effort, a GIS – or more generally a spatial decision support system (SDSS) – offers improved geographic visualization techniques, leading to faster, better, and more robust understanding and decision-making capabilities in the public health arena.[5]
For example, GIS displays have been used to show a clear relationship between clusters of emergent Hepatitis C cases and those of known intravenous drug users in Connecticut.[6] Causality is difficult to prove conclusively – collocation does not establish causation – but confirmation of previously established causal relationships (like intravenous drug use and Hepatitis C) can strengthen acceptance of those relationships, as well as help to demonstrate the utility and reliability of GIS-related solution techniques. Conversely, showing the coincidence of potential causal factors with the ultimate effect can help suggest a potential causal relationship, thereby driving further investigation and analysis [citation needed]
Alternately, GIS techniques have been used to show a lack of correlation between causes and effects or between different effects. For example, the distributions of both birth defects and infant mortality in Iowa were studied, and the researchers found no relationship in those data.[7] This led to the conclusion that birth defects and infant mortality are likely unrelated, and are likely due to different causes and risk factors.
GIS can support public health in different ways as well. First and foremost, GIS displays can help inform proper understanding and drive better decisions. For example, elimination of health disparities is one of two primary goals of Healthy People 2010, one of the preeminent public health programs in existence today in the US. GIS can play a significant role in that effort, helping public health practitioners identify areas of disparities or inequities, and ideally helping them identify and develop solutions to address those shortcomings. GIS can also help researchers integrate disparate data from a wide variety of sources, and can even be used to enforce quality control measures on those data. Much public health data is still manually generated, and is therefore subject to human-generated mistakes and miscoding. For example, geographic analysis of health care data from North Carolina showed that just over 40% of the records contained errors of some sort in the geographic information (city, county, or zip code), errors that would have gone undetected without the visual displays provided by GIS.[3] Correction of these errors led not only to more correct GIS displays, but also improved ALL analyses using those data.
Issues with GIS for public health
There are also concerns or issues with use of GIS tools for public health efforts. Chief among those is a concern for privacy and confidentiality of individuals.[3] Public health is concerned about the health of the population as a whole, but must use data on the health of individuals to make many of those assessments, and protecting the privacy and confidentiality of those individuals is of paramount importance. Use of GIS displays and related databases raises the potential of compromising those privacy standards, so some precautions are necessary to avoid pinpointing individuals based on spatial data. For example, data may need to be aggregated to cover larger areas such as a census tract or county, helping to mask individual identities. Maps can also be constructed at smaller scales so that less detail is revealed. Alternately, key identifying features (such as the road and street network) can be left off the maps to mask exact location, or it may even be advisable to intentionally offset the location markers by some random amount if deemed necessary.[3]
It is well established in the literature that statistical inference based on aggregated data can lead researchers to erroneous conclusions, suggesting relationships that in fact do not exist or obscuring relationships that do in fact exist. This issue is known as the modifiable areal unit problem.[8][9] For example, New York public health officials worried that cancer clusters and causes would be misidentified after they were forced to post maps showing cancer cases by ZIP code on the internet. Their assertion was that ZIP codes were designed for a purpose unrelated to public health issues, and so use of these arbitrary boundaries might lead to inappropriate groupings and then to incorrect conclusions.[9][10][11] Further, when comparing data in different aerial units, the difference in size and population means that comparing totals can hide underlying trends in the data.[12] This issue is particularly prevalent with choropleth maps.[12] To solve this, cartographers often apply some form of normalization, such as cases per 100,000 people. Unfortunately, this practice is not always adhered to and can cause potentially misleading maps.[12]
Summary
Use of GIS in public health is an application area still in its infancy. Like most new applications, there is a lot of promise, but also a lot of pitfalls that must be avoided along the way. Many researchers and practitioners are concentrating of this effort, hoping that the benefits outweigh the risks and the costs associated with this emerging application area for modern GIS techniques.
↑ O’Carroll, P.W. (2003). Introduction to public health informatics. In P.W. O’Carroll, Y.A. Yasnoff, M.E. Ward, L.H. Ripp, and E.L. Martin (Ed.), Public Health Informatics (pp. 1–15). New York, NY: Springer.
↑ Lumpkin, J.R. (2003). History and significance of information systems and public health. In P.W. O’Carroll, Y.A. Yasnoff, M.E. Ward, L.H. Ripp, and E.L. Martin (Ed.), Public Health Informatics (pp. 16–38). New York, NY: Springer.
1 2 3 4 5 Hanchette, C.L. (2003). Geographic Information Systems. In P.W. O’Carroll, Y.A. Yasnoff, M.E. Ward, L.H. Ripp, and E.L. Martin (Ed.), Public Health Informatics (pp. 431–466). New York, NY: Springer.
↑ Yasnoff, W.A. and Miller, P.L. (2003). Decision Support and Expert Systems in Public Health. In P.W. O’Carroll, Y.A. Yasnoff, M.E. Ward, L.H. Ripp, and E.L. Martin (Ed.), Public Health Informatics (pp. 494–512). New York, NY: Springer.
↑ Trooskin S, Hadler J, St. Louis T, and Navarro V (2005). Geospatial analysis of hepatitis C in Connecticut: a novel application of a public health tool. Public Health, 119(11), 1042–7. Retrieved from Academic Search Premier database.
↑ Rushton, G., Krishnamurthy, R., Krishnamurti, D., Lolonis, P., and Song, H. (1996). The spatial relationship between infant mortality and birth defects rates in a US city. Statistics in Medicine, 15, Retrieved from Academic Search Premier database.1907–19. Retrieved from Academic Search Premier database.
↑ Openshaw, Stan (1983). The Modifiable Aerial Unit Problem. Geo Books. ISBN0-86094-134-5.
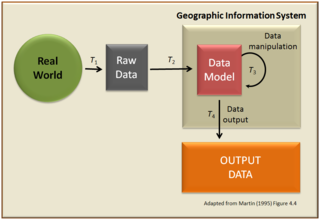
A geographic information system (GIS) consists of integrated computer hardware and software that store, manage, analyze, edit, output, and visualize geographic data. Much of this often happens within a spatial database, however, this is not essential to meet the definition of a GIS. In a broader sense, one may consider such a system also to include human users and support staff, procedures and workflows, the body of knowledge of relevant concepts and methods, and institutional organizations.
A ZIP Code is a system of postal codes used by the United States Postal Service (USPS). Introduced on July 1, 1963, the basic format consisted of five digits. In 1983, an extended ZIP+4 code was introduced; it included the five digits of the ZIP Code, followed by a hyphen and four digits that designated a more specific location.
Geomatics is defined in the ISO/TC 211 series of standards as the "discipline concerned with the collection, distribution, storage, analysis, processing, presentation of geographic data or geographic information". Under another definition, it consists of products, services and tools involved in the collection, integration and management of geographic (geospatial) data. It is also known as geomatic(s) engineering. Surveying engineering was the widely used name for geomatic(s) engineering in the past.
Geoinformatics is a technical science primarily within the domain of Computer Science. It focuses on the programming of applications, spatial data structures, and the analysis of objects and space-time phenomena related to the surface and underneath of Earth and other celestial bodies. The field develops software and web services to model and analyse spatial data, serving the needs of geosciences and related scientific and engineering disciplines. The term is often used interchangeably with Geomatics, although the two have distinct focuses; Geomatics emphasizes acquiring spatial knowledge and leveraging information systems, not their development.
Address geocoding, or simply geocoding, is the process of taking a text-based description of a location, such as an address or the name of a place, and returning geographic coordinates, frequently latitude/longitude pair, to identify a location on the Earth's surface. Reverse geocoding, on the other hand, converts geographic coordinates to a description of a location, usually the name of a place or an addressable location. Geocoding relies on a computer representation of address points, the street / road network, together with postal and administrative boundaries.
Health geography is the application of geographical information, perspectives, and methods to the study of health, disease, and health care. Medical geography, a sub-discipline of or sister field of health geography, focuses on understanding spatial patterns of health and disease as related to the natural and social environment. Conventionally, there are two primary areas of research within medical geography: the first deals with the spatial distribution and determinants of morbidity and mortality, while the second deals with health planning, help-seeking behavior, and the provision of health services.
Spatial analysis is any of the formal techniques which studies entities using their topological, geometric, or geographic properties. Spatial analysis includes a variety of techniques using different analytic approaches, especially spatial statistics. It may be applied in fields as diverse as astronomy, with its studies of the placement of galaxies in the cosmos, or to chip fabrication engineering, with its use of "place and route" algorithms to build complex wiring structures. In a more restricted sense, spatial analysis is geospatial analysis, the technique applied to structures at the human scale, most notably in the analysis of geographic data. It may also be applied to genomics, as in transcriptomics data.
The modifiable areal unit problem (MAUP) is a source of statistical bias that can significantly impact the results of statistical hypothesis tests. MAUP affects results when point-based measures of spatial phenomena are aggregated into spatial partitions or areal units as in, for example, population density or illness rates. The resulting summary values are influenced by both the shape and scale of the aggregation unit.
Spatial epidemiology is a subfield of epidemiology focused on the study of the spatial distribution of health outcomes; it is closely related to health geography.
A thematic map is a type of map that portrays the geographic pattern of a particular subject matter (theme) in a geographic area. This usually involves the use of map symbols to visualize selected properties of geographic features that are not naturally visible, such as temperature, language, or population. In this, they contrast with general reference maps, which focus on the location of a diverse set of physical features, such as rivers, roads, and buildings. Alternative names have been suggested for this class, such as special-subject or special-purpose maps, statistical maps, or distribution maps, but these have generally fallen out of common usage. Thematic mapping is closely allied with the field of Geovisualization.
Public health informatics has been defined as the systematic application of information and computer science and technology to public health practice, research, and learning. It is one of the subdomains of health informatics.
Statistical geography is the study and practice of collecting, analysing and presenting data that has a geographic or areal dimension, such as census or demographics data. It uses techniques from spatial analysis, but also encompasses geographical activities such as the defining and naming of geographical regions for statistical purposes. For example, for the purposes of statistical geography, the Australian Bureau of Statistics uses the Australian Standard Geographical Classification, a hierarchical regionalisation that divides Australia up into states and territories, then statistical divisions, statistical subdivisions, statistical local areas, and finally census collection districts.
A dot distribution map is a type of thematic map that uses a point symbol to visualize the geographic distribution of a large number of related phenomena. Dot maps are a type of unit visualizations that rely on a visual scatter to show spatial patterns, especially variances in density. The dots may represent the actual locations of individual phenomena, or be randomly placed in aggregation districts to represent a number of individuals. Although these two procedures, and their underlying models, are very different, the general effect is the same.
A boundary problem in analysis is a phenomenon in which geographical patterns are differentiated by the shape and arrangement of boundaries that are drawn for administrative or measurement purposes. The boundary problem occurs because of the loss of neighbors in analyses that depend on the values of the neighbors. While geographic phenomena are measured and analyzed within a specific unit, identical spatial data can appear either dispersed or clustered depending on the boundary placed around the data. In analysis with point data, dispersion is evaluated as dependent of the boundary. In analysis with areal data, statistics should be interpreted based upon the boundary.
Geospatial topology is the study and application of qualitative spatial relationships between geographic features, or between representations of such features in geographic information, such as in geographic information systems (GIS). For example, the fact that two regions overlap or that one contains the other are examples of topological relationships. It is thus the application of the mathematics of topology to GIS, and is distinct from, but complementary to the many aspects of geographic information that are based on quantitative spatial measurements through coordinate geometry. Topology appears in many aspects of geographic information science and GIS practice, including the discovery of inherent relationships through spatial query, vector overlay and map algebra; the enforcement of expected relationships as validation rules stored in geospatial data; and the use of stored topological relationships in applications such as network analysis. Spatial topology is the generalization of geospatial topology for non-geographic domains, e.g., CAD software.
Data mining, the process of discovering patterns in large data sets, has been used in many applications.
Arbia’s law of geography states, "Everything is related to everything else, but things observed at a coarse spatial resolution are more related than things observed at a finer resolution." Originally proposed as the 2nd law of geography, this is one of several laws competing for that title. Because of this, Arbia's law is sometimes referred to as the second law of geography, or Arbia's second law of geography.
The uncertain geographic context problem or UGCoP is a source of statistical bias that can significantly impact the results of spatial analysis when dealing with aggregate data. The UGCoP is very closely related to the Modifiable areal unit problem (MAUP), and like the MAUP, arises from how we divide the land into areal units. It is caused by the difficulty, or impossibility, of understanding how phenomena under investigation in different enumeration units interact between enumeration units, and outside of a study area over time. It is particularly important to consider the UGCoP within the discipline of time geography, where phenomena under investigation can move between spatial enumeration units during the study period. Examples of research that needs to consider the UGCoP include food access and human mobility.
The Modified Temporal Unit Problem (MTUP) is a source of statistical bias that occurs in time series and spatial analysis when using temporal data that has been aggregated into temporal units. In such cases, choosing a temporal unit can affect the analysis results and lead to inconsistencies or errors in statistical hypothesis testing.
The neighborhood effect averaging problem or NEAP delves into the challenges associated with understanding the influence of aggregating neighborhood-level phenomena on individuals when mobility-dependent exposures influence the phenomena. The problem confounds the neighbourhood effect, which suggests that a person's neighborhood impacts their individual characteristics, such as health. It relates to the boundary problem, in that delineated neighborhoods used for analysis may not fully account for an individuals activity space if the borders are permeable, and individual mobility crosses the boundaries. The term was first coined by Mei-Po Kwan in the peer-reviewed journal "International Journal of Environmental Research and Public Health" in 2018.
This page is based on this Wikipedia article Text is available under the CC BY-SA 4.0 license; additional terms may apply. Images, videos and audio are available under their respective licenses.