Gel electrophoresis of nucleic acids

Last updated
Digital printout of an agarose gel electrophoresis of cat-insert plasmid DNA DNA Agarose Gel Electrophor.jpg
Digital printout of an agarose gel electrophoresis of cat-insert plasmid DNA
DNA electropherogram trace Electropherogram trace.jpg
DNA electropherogram trace

Gel electrophoresis of nucleic acids is an analytical technique to separate DNA or RNA fragments by size and reactivity. Nucleic acid molecules are placed on a gel, where an electric field induces the nucleic acids (which are negatively charged due to their sugar-phosphate backbone) to migrate toward the positively charged anode. The molecules separate as they travel through the gel based on the each molecule's size and shape. Longer molecules move more slowly because they the gel resists their movement more forcefully than it resists shorter molecules. After some time, the electricity is turned off and the positions of the different molecules are analyzed.

Contents

The nucleic acid to be separated can be prepared in several ways before separation by electrophoresis. In the case of large DNA molecules, the DNA is frequently cut into smaller fragments using a DNA restriction endonuclease (or restriction enzyme). In other instances, such as PCR amplified samples, enzymes present in the sample that might affect the separation of the molecules are removed through various means before analysis. Once the nucleic acid is properly prepared, the samples of the nucleic acid solution are placed in the wells of the gel and a voltage is applied across the gel for a specified amount of time.

The DNA fragments of different lengths are visualized using a fluorescent dye specific for DNA, such as ethidium bromide. The gel shows bands corresponding to different nucleic acid molecules populations with different molecular weight. Fragment size is usually reported in "nucleotides", "base pairs" or "kb" (for thousands of base pairs) depending upon whether single- or double-stranded nucleic acid has been separated. Fragment size determination is typically done by comparison to commercially available DNA markers containing linear DNA fragments of known length.

The types of gel most commonly used for nucleic acid electrophoresis are agarose (for relatively long DNA molecules) and polyacrylamide (for high resolution of short DNA molecules, for example in DNA sequencing). Gels have conventionally been run in a "slab" format such as that shown in the figure, but capillary electrophoresis has become important for applications such as high-throughput DNA sequencing. Electrophoresis techniques used in the assessment of DNA damage include alkaline gel electrophoresis and pulsed field gel electrophoresis.

For short DNA segments such as 20 to 60 bp double stranded DNA, running them in polyacrylamide gel (PAGE) will give better resolution (native condition). [1] Similarly, RNA and single-stranded DNA can be run and visualised by PAGE gels containing denaturing agents such as urea. PAGE gels are widely used in techniques such as DNA foot printing, EMSA and other DNA-protein interaction techniques.

The measurement and analysis are mostly done with a specialized gel analysis software. Capillary electrophoresis results are typically displayed in a trace view called an electropherogram.

Factors affecting migration of nucleic acids

A number of factors can affect the migration of nucleic acids: the dimension of the gel pores, the voltage used, the ionic strength of the buffer, and the concentration intercalating dye such as ethidium bromide if used during electrophoresis. [2]

Size of DNA

The gel sieves the DNA by the size of the DNA molecule whereby smaller molecules travel faster. Double-stranded DNA moves at a rate that is approximately inversely proportional to the logarithm of the number of base pairs. This relationship however breaks down with very large DNA fragments and it is not possible to separate them using standard agarose gel electrophoresis. The limit of resolution depends on gel composition and field strength. [3] and the mobility of larger circular DNA may be more strongly affected than linear DNA by the pore size of the gel. [4] Separation of very large DNA fragments requires pulse field gel electrophoresis (PFGE). In field inversion gel electrophoresis (FIGE, a kind of PFGE), it is possible to have "band inversion" - where large molecules may move faster than small molecules.

Gels of plasmid preparations usually show a major band of supercoiled DNA with other fainter bands in the same lane. Note that by convention DNA gel is displayed with smaller DNA fragments near the bottom of the gel. This is because historically DNA gel were run vertically and the smaller DNA fragments move downwards faster. Plasmid miniprep.jpg
Gels of plasmid preparations usually show a major band of supercoiled DNA with other fainter bands in the same lane. Note that by convention DNA gel is displayed with smaller DNA fragments near the bottom of the gel. This is because historically DNA gel were run vertically and the smaller DNA fragments move downwards faster.

Conformation of DNA

The conformation of the DNA molecule can significantly affect the movement of the DNA, for example, supercoiled DNA usually moves faster than relaxed DNA because it is tightly coiled and hence more compact. In a normal plasmid DNA preparation, multiple forms of DNA may be present, [5] and gel from the electrophoresis of the plasmids would normally show a main band which would be the negatively supercoiled form, while other forms of DNA may appear as minor fainter bands. These minor bands may be nicked DNA (open circular form) and the relaxed closed circular form which normally run slower than supercoiled DNA, and the single-stranded form (which can sometimes appear depending on the preparation methods) may move ahead of the supercoiled DNA. The rate at which the various forms move however can change using different electrophoresis conditions, for example linear DNA may run faster or slower than supercoiled DNA depending on conditions, [6] and the mobility of larger circular DNA may be more strongly affected than linear DNA by the pore size of the gel. [4] Unless supercoiled DNA markers are used, the size of a circular DNA like plasmid therefore may be more accurately gauged after it has been linearized by restriction digest.

DNA damage due to increased cross-linking will also reduce electrophoretic DNA migration in a dose-dependent way. [7] [8]

Concentration of ethidium bromide

Circular DNA are more strongly affected by ethidium bromide concentration than linear DNA if ethidium bromide is present in the gel during electrophoresis. All naturally occurring DNA circles are underwound, but ethidium bromide which intercalates into circular DNA can change the charge, length, as well as the superhelicity of the DNA molecule, therefore its presence during electrophoresis can affect its movement in gel. Increasing ethidium bromide intercalated into the DNA can change it from a negatively supercoiled molecule into a fully relaxed form, then to positively coiled superhelix at maximum intercalation. [9] Agarose gel electrophoresis can be used to resolve circular DNA with different supercoiling topology.

Gel concentration

The concentration of the gel determines the pore size of the gel which affects the migration of DNA. The resolution of the DNA changes with the percentage concentration of the gel. Increasing the agarose concentration of a gel reduces the migration speed and improves separation of smaller DNA molecules, while lowering gel concentration permits large DNA molecules to be separated. For a standard agarose gel electrophoresis, 0.7% gel concentration gives good separation or resolution of large 5–10kb DNA fragments, while 2% gel concentration gives good resolution for small 0.2–1kb fragments. Up to 3% gel concentration can be used for separating very tiny fragments but a vertical polyacrylamide gel would be more appropriate for resolving small fragments. High concentrations gel, however, requires longer run times (sometimes days) and high percentage gels are often brittle and may not set evenly. High percentage agarose gels should be run with PFGE or FIGE. Low percentage gels (0.1−0.2%) are fragile and may break. 1% gels are common for many applications. [10]

Applied field

At low voltages, the rate of migration of the DNA is proportional to the voltage applied, i.e. the higher the voltage, the faster the DNA moves. However, in increasing electric field strength, the mobility of high-molecular-weight DNA fragments increases differentially, and the effective range of separation decreases and resolution therefore is lower at high voltage. For optimal resolution of DNA greater than 2kb in size in standard gel electrophoresis, 5 to 8 V/cm is recommended. [6] Voltage is also limited by the fact that it heats the gel and may cause the gel to melt if a gel is run at high voltage for a prolonged period, particularly for low-melting point agarose gel.

The mobility of DNA however may change in an unsteady field. In a field that is periodically reversed, the mobility of DNA of a particular size may drop significantly at a particular cycling frequency. [11] This phenomenon can result in band inversion whereby larger DNA fragments move faster than smaller ones in PFGE.

Mechanism of migration and separation

The negative charge of its phosphate backbone moves the DNA towards the positively charged anode during electrophoresis. However, the migration of DNA molecules in solution, in the absence of a gel matrix, is independent of molecular weight during electrophoresis, i.e. there is no separation by size without a gel matrix. [12] Hydrodynamic interaction between different parts of the DNA are cut off by streaming counterions moving in the opposite direction, so no mechanism exists to generate a dependence of velocity on length on a scale larger than screening length of about 10 nm. [11] This makes it different from other processes such as sedimentation or diffusion where long-ranged hydrodynamic interaction are important.

The gel matrix is therefore responsible for the separation of DNA by size during electrophoresis, however the precise mechanism responsible the separation is not entirely clear. A number of models exists for the mechanism of separation of biomolecules in gel matrix, a widely accepted one is the Ogston model which treats the polymer matrix as a sieve consisting of randomly distributed network of inter-connected pores. [13] A globular protein or a random coil DNA moves through the connected pores large enough to accommodate its passage, and the movement of larger molecules is more likely to be impeded and slowed down by collisions with the gel matrix, and the molecules of different sizes can therefore be separated in this process of sieving. [11]

The Ogston model however breaks down for large molecules whereby the pores are significantly smaller than size of the molecule. For DNA molecules of size greater than 1 kb, a reptation model (or its variants) is most commonly used. This model assumes that the DNA can crawl in a "snake-like" fashion (hence "reptation") through the pores as an elongated molecule. At higher electric field strength, this turned into a biased reptation model, whereby the leading end of the molecule become strongly biased in the forward direction, and this leading edge pulls the rest of the molecule along. In the fully biased mode, the mobility reached a saturation point and DNA beyond a certain size cannot be separated. [13] Perfect parallel alignment of the chain with the field however is not observed in practice as that would mean the same mobility for long and short molecules. [11] Further refinement of the biased reptation model takes into account of the internal fluctuations of the chain. [14]

The biased reptation model has also been used to explain the mobility of DNA in PFGE. The orientation of the DNA is progressively built up by reptation after the onset of a field, and the time it reached the steady state velocity is dependent on the size of the molecule. When the field is changed, larger molecules take longer to reorientate, it is therefore possible to discriminate between the long chains that cannot reach its steady state velocity from the short ones that travel most of the time in steady velocity. [14] Other models, however, also exist.

Real-time fluorescence microscopy of stained molecules showed more subtle dynamics during electrophoresis, with the DNA showing considerable elasticity as it alternately stretching in the direction of the applied field and then contracting into a ball, or becoming hooked into a U-shape when it gets caught on the polymer fibres. [15] [16] This observation may be termed the "caterpillar" model. [17] Other model proposes that the DNA gets entangled with the polymer matrix, and the larger the molecule, the more likely it is to become entangled and its movement impeded. [18]

Visualization

DNA gel electrophoresis Gel electrophoresis 2.jpg
DNA gel electrophoresis

The most common dye used to make DNA or RNA bands visible for agarose gel electrophoresis is ethidium bromide, usually abbreviated as EtBr. It fluoresces under UV light when intercalated into the major groove of DNA (or RNA). By running DNA through an EtBr-treated gel and visualizing it with UV light, any band containing more than ~20 ng DNA becomes distinctly visible. EtBr is a known mutagen, [19] and safer alternatives are available, such as GelRed, produced by Biotium, which binds to the minor groove. [20]

SYBR Green I is another dsDNA stain, produced by Invitrogen. It is more expensive, but 25 times more sensitive, and possibly safer than EtBr, though there is no data addressing its mutagenicity or toxicity in humans. [21]

SYBR Safe is a variant of SYBR Green that has been shown to have low enough levels of mutagenicity and toxicity to be deemed nonhazardous waste under U.S. Federal regulations. [22] It has similar sensitivity levels to EtBr, [22] but, like SYBR Green, is significantly more expensive. In countries where safe disposal of hazardous waste is mandatory, the costs of EtBr disposal can easily outstrip the initial price difference, however.

Since EtBr stained DNA is not visible in natural light, scientists mix DNA with negatively charged loading buffers before adding the mixture to the gel. Loading buffers are useful because they are visible in natural light (as opposed to UV light for EtBr stained DNA), and they co-sediment with DNA (meaning they move at the same speed as DNA of a certain length). Xylene cyanol and Bromophenol blue are common dyes found in loading buffers; they run about the same speed as DNA fragments that are 5000 bp and 300 bp in length respectively, but the precise position varies with percentage of the gel. Other less frequently used progress markers are Cresol Red and Orange G which run at about 125 bp and 50 bp, respectively.

Visualization can also be achieved by transferring DNA after SDS-PAGE to a nitrocellulose membrane followed by exposure to a hybridization probe. This process is termed Southern blotting.

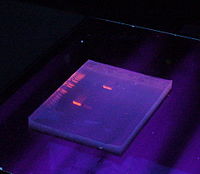
For fluorescent dyes, after electrophoresis the gel is illuminated with an ultraviolet lamp (usually by placing it on a light box, while using protective gear to limit exposure to ultraviolet radiation). The illuminator apparatus mostly also contains imaging apparatus that takes an image of the gel, after illumination with UV radiation. The ethidium bromide fluoresces reddish-orange in the presence of DNA, since it has intercalated with the DNA. The DNA band can also be cut out of the gel, and can then be dissolved to retrieve the purified DNA. The gel can then be photographed usually with a digital or polaroid camera. Although the stained nucleic acid fluoresces reddish-orange, images are usually shown in black and white (see figures). UV damage to the DNA sample can reduce the efficiency of subsequent manipulation of the sample, such as ligation and cloning. Shorter wavelength UV radiations (302 or 312 nm) cause greater damage, for example exposure for as little as 45 seconds can significantly reduce transformation efficiency. Therefore if the DNA is to be use for downstream procedures, exposure to a shorter wavelength UV radiations should be limited, instead higher-wavelength UV radiation (365 nm) which cause less damage should be used. Higher wavelength radiations however produces weaker fluorescence, therefore if it is necessary to capture the gel image, a shorter wavelength UV light can be used a short time. Addition of Cytidine or guanosine to the electrophoresis buffer at 1 mM concentration may protect the DNA from damage. [23] Alternatively, a blue light excitation source with a blue-excitable stain such as SYBR Green or GelGreen may be used.

Gel electrophoresis research often takes advantage of software-based image analysis tools, such as ImageJ.

123
A 1% agarose 'slab' gel under normal light, behind a perspex UV shield. Only the marker dyes can be seen Agarosegel.jpg
A 1% agarose 'slab' gel under normal light, behind a perspex UV shield. Only the marker dyes can be seen
The gel with UV illumination, the ethidium bromide stained DNA glows orange AgarosegelUV.jpg
The gel with UV illumination, the ethidium bromide stained DNA glows orange
Digital photo of the gel. Lane 1. Commercial DNA Markers (1kbplus), Lane 2. empty, Lane 3. a PCR product of just over 500 bases, Lane 4. Restriction digest showing a similar fragment cut from a 4.5 kb plasmid vector Agarosegelphoto.jpg
Digital photo of the gel. Lane 1. Commercial DNA Markers (1kbplus), Lane 2. empty, Lane 3. a PCR product of just over 500 bases, Lane 4. Restriction digest showing a similar fragment cut from a 4.5 kb plasmid vector

Related Research Articles

<span class="mw-page-title-main">Agarose gel electrophoresis</span> Method for separation and analysis of biomolecules using agarose gel

Agarose gel electrophoresis is a method of gel electrophoresis used in biochemistry, molecular biology, genetics, and clinical chemistry to separate a mixed population of macromolecules such as DNA or proteins in a matrix of agarose, one of the two main components of agar. The proteins may be separated by charge and/or size, and the DNA and RNA fragments by length. Biomolecules are separated by applying an electric field to move the charged molecules through an agarose matrix, and the biomolecules are separated by size in the agarose gel matrix.
<span class="mw-page-title-main">Agarose</span> Heteropolysaccharide found in red algae

Agarose is a heteropolysaccharide, generally extracted from certain red seaweed. It is a linear polymer made up of the repeating unit of agarobiose, which is a disaccharide made up of D-galactose and 3,6-anhydro-L-galactopyranose. Agarose is one of the two principal components of agar, and is purified from agar by removing agar's other component, agaropectin.

<span class="mw-page-title-main">Gel electrophoresis</span> Method for separation and analysis of biomolecules

Gel electrophoresis is a method for separation and analysis of biomacromolecules and their fragments, based on their size and charge. It is used in clinical chemistry to separate proteins by charge or size and in biochemistry and molecular biology to separate a mixed population of DNA and RNA fragments by length, to estimate the size of DNA and RNA fragments or to separate proteins by charge.
<span class="mw-page-title-main">Northern blot</span> Molecular biology technique

The northern blot, or RNA blot, is a technique used in molecular biology research to study gene expression by detection of RNA in a sample.
<span class="mw-page-title-main">Polyacrylamide gel electrophoresis</span> Analytical technique

Polyacrylamide gel electrophoresis (PAGE) is a technique widely used in biochemistry, forensic chemistry, genetics, molecular biology and biotechnology to separate biological macromolecules, usually proteins or nucleic acids, according to their electrophoretic mobility. Electrophoretic mobility is a function of the length, conformation, and charge of the molecule. Polyacrylamide gel electrophoresis is a powerful tool used to analyze RNA samples. When polyacrylamide gel is denatured after electrophoresis, it provides information on the sample composition of the RNA species.

<span class="mw-page-title-main">Ethidium bromide</span> DNA gel stain and veterinary drug

Ethidium bromide is an intercalating agent commonly used as a fluorescent tag in molecular biology laboratories for techniques such as agarose gel electrophoresis. It is commonly abbreviated as EtBr, which is also an abbreviation for bromoethane. To avoid confusion, some laboratories have used the abbreviation EthBr for this salt. When exposed to ultraviolet light, it will fluoresce with an orange colour, intensifying almost 20-fold after binding to DNA. Under the name homidium, it has been commonly used since the 1950s in veterinary medicine to treat trypanosomiasis in cattle. The high incidence of antimicrobial resistance makes this treatment impractical in some areas, where the related isometamidium chloride is used instead. Despite its reputation as a mutagen, tests have shown it to have low mutagenicity without metabolic activation.

<span class="mw-page-title-main">Gel electrophoresis of proteins</span> Technique for separating proteins

Protein electrophoresis is a method for analysing the proteins in a fluid or an extract. The electrophoresis may be performed with a small volume of sample in a number of alternative ways with or without a supporting medium, namely agarose or polyacrylamide. Variants of gel electrophoresis include SDS-PAGE, free-flow electrophoresis, electrofocusing, isotachophoresis, affinity electrophoresis, immunoelectrophoresis, counterelectrophoresis, and capillary electrophoresis. Each variant has many subtypes with individual advantages and limitations. Gel electrophoresis is often performed in combination with electroblotting or immunoblotting to give additional information about a specific protein.

<span class="mw-page-title-main">Temperature gradient gel electrophoresis</span>

Temperature gradient gel electrophoresis (TGGE) and denaturing gradient gel electrophoresis (DGGE) are forms of electrophoresis which use either a temperature or chemical gradient to denature the sample as it moves across an acrylamide gel. TGGE and DGGE can be applied to nucleic acids such as DNA and RNA, and proteins. TGGE relies on temperature dependent changes in structure to separate nucleic acids. DGGE separates genes of the same size based on their different denaturing ability which is determined by their base pair sequence. DGGE was the original technique, and TGGE a refinement of it.

In molecular biology, gel extraction or gel isolation is a technique used to isolate a desired fragment of intact DNA from an agarose gel following agarose gel electrophoresis. After extraction, fragments of interest can be mixed, precipitated, and enzymatically ligated together in several simple steps. This process, usually performed on plasmids, is the basis for rudimentary genetic engineering.

<span class="mw-page-title-main">Pulsed-field gel electrophoresis</span> Lab technique for separation of DNA

Pulsed-field gel electrophoresis (PFGE) is a technique used for the separation of large DNA molecules by applying to a gel matrix an electric field that periodically changes direction. Pulsed-field gel electrophoresis is a method used to separate large segments of DNA using an alternating and cross field. In a uniform magnetic field, components larger than 50kb move through the gel in a zigzag pattern, allowing for more effective separation of DNA molecules. This method is commonly used in microbiology for typing bacteria and is a valuable tool for epidemiological studies and gene mapping in microbes and mammalian cells. It also played a role in the development of large-insert cloning systems such as bacterial and yeast artificial chromosomes.

<span class="mw-page-title-main">Electrophoretic mobility shift assay</span>

An electrophoretic mobility shift assay (EMSA) or mobility shift electrophoresis, also referred as a gel shift assay, gel mobility shift assay, band shift assay, or gel retardation assay, is a common affinity electrophoresis technique used to study protein–DNA or protein–RNA interactions. This procedure can determine if a protein or mixture of proteins is capable of binding to a given DNA or RNA sequence, and can sometimes indicate if more than one protein molecule is involved in the binding complex. Gel shift assays are often performed in vitro concurrently with DNase footprinting, primer extension, and promoter-probe experiments when studying transcription initiation, DNA gang replication, DNA repair or RNA processing and maturation, as well as pre-mRNA splicing. Although precursors can be found in earlier literature, most current assays are based on methods described by Garner and Revzin and Fried and Crothers.

<span class="mw-page-title-main">Molecular-weight size marker</span> Set of standards

A molecular-weight size marker, also referred to as a protein ladder, DNA ladder, or RNA ladder, is a set of standards that are used to identify the approximate size of a molecule run on a gel during electrophoresis, using the principle that molecular weight is inversely proportional to migration rate through a gel matrix. Therefore, when used in gel electrophoresis, markers effectively provide a logarithmic scale by which to estimate the size of the other fragments.

<span class="mw-page-title-main">SYBR Green I</span> Dye used for molecular genetics

SYBR Green I (SG) is an asymmetrical cyanine dye used as a nucleic acid stain in molecular biology. The SYBR family of dyes is produced by Molecular Probes Inc., now owned by Thermo Fisher Scientific. SYBR Green I binds to DNA. The resulting DNA-dye-complex best absorbs 497 nanometer blue light and emits green light. The stain preferentially binds to double-stranded DNA, but will stain single-stranded (ss) DNA with lower performance. SYBR Green can also stain RNA with a lower performance than ssDNA.

<span class="mw-page-title-main">Electrophoretic color marker</span>

An electrophoretic color marker is a chemical used to monitor the progress of agarose gel electrophoresis and polyacrylamide gel electrophoresis (PAGE) since DNA, RNA, and most proteins are colourless. The color markers are made up of a mixture of dyes that migrate through the gel matrix alongside the sample of interest. They are typically designed to have different mobilities from the sample components and to generate colored bands that can be used to assess the migration and separation of sample components.

<span class="mw-page-title-main">Affinity electrophoresis</span>

Affinity electrophoresis is a general name for many analytical methods used in biochemistry and biotechnology. Both qualitative and quantitative information may be obtained through affinity electrophoresis. Cross electrophoresis, the first affinity electrophoresis method, was created by Nakamura et al. Enzyme-substrate complexes have been detected using cross electrophoresis. The methods include the so-called electrophoretic mobility shift assay, charge shift electrophoresis and affinity capillary electrophoresis. The methods are based on changes in the electrophoretic pattern of molecules through biospecific interaction or complex formation. The interaction or binding of a molecule, charged or uncharged, will normally change the electrophoretic properties of a molecule. Membrane proteins may be identified by a shift in mobility induced by a charged detergent. Nucleic acids or nucleic acid fragments may be characterized by their affinity to other molecules. The methods have been used for estimation of binding constants, as for instance in lectin affinity electrophoresis or characterization of molecules with specific features like glycan content or ligand binding. For enzymes and other ligand-binding proteins, one-dimensional electrophoresis similar to counter electrophoresis or to "rocket immunoelectrophoresis", affinity electrophoresis may be used as an alternative quantification of the protein. Some of the methods are similar to affinity chromatography by use of immobilized ligands.

<span class="mw-page-title-main">Gel doc</span>

A gel doc, also known as a gel documentation system, gel image system or gel imager, refers to equipment widely used in molecular biology laboratories for the imaging and documentation of nucleic acid and protein suspended within polyacrylamide or agarose gels. Genetic information is stored in DNA. Polyacrylamide or agarose gel electrophoresis procedures are carried out to examine nucleic acids or proteins in order to analyze the genetic data. For protein analysis, two-dimensional gel electrophoresis is employed (2-DGE) which is one of the methods most frequently used in comparative proteomic investigations that can distinguish thousands of proteins in a single run. Proteins are separated using 2-DGE first, based on their isoelectric points (pIs) in one dimension and then based on their molecular mass in the other. After that, a thorough qualitative and quantitative analysis of the proteomes is performed using gel documentation with software image assessment methods on the 2-DGE gels stained for protein visibility. Gels are typically stained with Ethidium bromide or other nucleic acid stains such as GelGreen.

<span class="mw-page-title-main">GelRed</span> DNA gel stain for molecular genetics

GelRed is an intercalating nucleic acid stain used in molecular genetics for agarose gel DNA electrophoresis. GelRed structurally consists of two ethidium subunits that are bridged by a linear oxygenated spacer.

<span class="mw-page-title-main">GelGreen</span> DNA gel stain for molecular genetics

GelGreen is an intercalating nucleic acid stain used in molecular genetics for agarose gel DNA electrophoresis. GelGreen consists of two acridine orange subunits that are bridged by a linear oxygenated spacer.

<span class="mw-page-title-main">SYBR Safe</span> DNA gel stain for molecular genetics

SYBR Safe is a cyanine dye used as a nucleic acid stain in molecular biology. SYBR Safe is one of a number of SYBR dyes made by the Life Technologies Corporation. SYBR Safe binds to DNA. The resulting DNA-dye-complex absorbs blue light and emits green light.

<span class="mw-page-title-main">SYBR Gold</span> Chemical compound

SYBR Gold is an asymmetrical cyanine dye. It can be used as a stain for double-stranded DNA, single-stranded DNA, and RNA. SYBR Gold is the most sensitive fluorescent stain of the SYBR family of dyes for the detection of nucleic acids. The SYBR family of dyes is produced by Molecular Probes Inc., now owned by Thermo Fisher Scientific

References

  1. Jaguva Vasudevan, Ananda Ayyappan; Mario Perkovic; Yannick Bulliard; Klaus Cichutek; Didier Trono; Dieter Häussinger; Carsten Münk (August 2013). "Prototype Foamy Virus Bet Impairs the Dimerization and Cytosolic Solubility of Human APOBEC3G". Journal of Virology. 87 (16): 9030–9040. doi:10.1128/JVI.03385-12. PMC   3754047 . PMID   23760237.
  2. G. Lucotte; F. Baneyx (1993). Introduction to Molecular Cloning Techniques. Wiley-Blackwell. p. 32. ISBN   978-0471188490.
  3. Joseph Sambrook; David Russell. "Chapter 5, protocol 1". Molecular Cloning - A Laboratory Manual. Vol. 1 (3rd ed.). p. 5.2. ISBN   978-0-87969-577-4.
  4. 1 2 Aaij C, Borst P (1972). "The gel electrophoresis of DNA". Biochim Biophys Acta. 269 (2): 192–200. doi:10.1016/0005-2787(72)90426-1. PMID   5063906.
  5. Richard R. Sinden (24 November 1994). DNA Structure and Function. Academic Press Inc. p. 97. ISBN   978-0126457506.
  6. 1 2 Joseph Sambrook; David Russell. "Chapter 5, protocol 1". Molecular Cloning - A Laboratory Manual. Vol. 1 (3rd ed.). pp. 5.5–5.6. ISBN   978-0-87969-577-4.
  7. Blasiak J, Trzeciak A, Malecka-Panas E, Drzewoski J, Wojewódzka M (2000). "In vitro genotoxicity of ethanol and acetaldehyde in human lymphocytes and the gastrointestinal tract mucosa cells". Toxicology in Vitro. 14 (4): 287–295. doi:10.1016/S0887-2333(00)00022-9. PMID   10906435.
  8. Lu Y, Morimoto K (2009). "Is habitual alcohol drinking associated with reduced electrophoretic DNA migration in peripheral blood leukocytes from ALDH2-deficient male Japanese?". Mutagenesis. 24 (4): 303–308. doi: 10.1093/mutage/gep008 . PMID   19286920.
  9. Donald Voet; Judith G. Voet (1995). Biochemistry (2nd ed.). John Wiley & Sons. pp.  877–878. ISBN   978-0471586517.
  10. "Agarose gel electrophoresis (basic method)". Biological Protocols. Retrieved 23 August 2011.
  11. 1 2 3 4 Zimm BH, Levene SD (1992). "Problems and prospects in the theory of gel electrophoresis of DNA" (PDF). Quarterly Reviews of Biophysics. 25 (2): 171–204. doi:10.1017/s0033583500004662. PMID   1518924. S2CID   27976751.
  12. Robert W. Old; Sandy B. Primrose (27 September 1994). Principle of Gene Manipulation - An Introduction to Genetic Engineering (5th ed.). Blackwell Scientific. p.  9. ISBN   9780632037124.
  13. 1 2 Li Zhu; Hong Wang (2 March 2009). "Chapter 4 - Genetic Analysis in Miniaturized Electrophoresis Systems". In Tian, Wei-Cheng; Finehout, Erin (eds.). Microfluidics for Biological Applications. Springer. p. 125. ISBN   978-0-387-09480-9.
  14. 1 2 Jean-Louis Viovy (2000). "Electrophoresis of DNA and other polyelectrolytes: Physical mechanisms". Reviews of Modern Physics. 72 (3): 813–872. Bibcode:2000RvMP...72..813V. doi:10.1103/RevModPhys.72.813.
  15. Smith SB, Aldridge PK, Callis JB (1989). "Observation of individual DNA molecules undergoing gel electrophoresis". Science. 243 (4888): 203–206. Bibcode:1989Sci...243..203S. doi:10.1126/science.2911733. PMID   2911733.
  16. Schwartz DC, Koval M (1989). "Conformational dynamics of individual DNA molecules during gel electrophoresis". Nature. 338 (6215): 520–2. Bibcode:1989Natur.338..520S. doi:10.1038/338520a0. PMID   2927511. S2CID   4249063.
  17. David Sheehan (2009), Physical Biochemistry: Principles and Applications (2nd ed.), Wiley-Blackwell, p. 181, ISBN   978-0470856031
  18. Forster RE, Hert DG, Chiesl TN, Fredlake CP, Barron AE (2009). "DNA migration mechanism analyses for applications in capillary and microchip electrophoresis". Electrophoresis. 30 (12): 2014–24. doi:10.1002/elps.200900264. PMC   2762034 . PMID   19582705.
  19. Begusová, M; et al. (2000). "Effect of ethidium bromide intercalation on DNA radiosensitivity". Int J Radiat Biol. 76 (1): 1–9. doi:10.1080/095530000138952. PMID   10665952. S2CID   218867604.
  20. "The most safe and sensitive nucleic acid gel stains" (PDF).
  21. "SYBR Green I Nucleic Acid Gel Stain" (PDF). Archived from the original (PDF) on 2012-05-22. Retrieved 2013-06-23.
  22. 1 2 "SYBR Safe DNA Gel Stain" (PDF). Archived from the original (PDF) on 2012-09-07. Retrieved 2013-06-23.
  23. Gründemann D, Schömig E. (1996). "Protection of DNA during preparative agarose gel electrophoresis against damage induced by ultraviolet light". BioTechniques. 21 (5): 898–903. doi: 10.2144/96215rr02 . PMID   8922632.