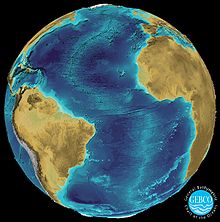
A digital elevation model (DEM) or digital surface model (DSM) is a 3D computer graphics representation of elevation data to represent terrain or overlaying objects, commonly of a planet, moon, or asteroid. A "global DEM" refers to a discrete global grid. DEMs are used often in geographic information systems (GIS), and are the most common basis for digitally produced relief maps. A digital terrain model (DTM) represents specifically the ground surface while DEM and DSM may represent tree top canopy or building roofs.

Topography is the study of the forms and features of land surfaces. The topography of an area may refer to the land forms and features themselves, or a description or depiction in maps.

Hydrographic survey is the science of measurement and description of features which affect maritime navigation, marine construction, dredging, offshore oil exploration and drilling and related activities. Strong emphasis is placed on soundings, shorelines, tides, currents, seabed and submerged obstructions that relate to the previously mentioned activities. The term hydrography is used synonymously to describe maritime cartography, which in the final stages of the hydrographic process uses the raw data collected through hydrographic survey into information usable by the end user.
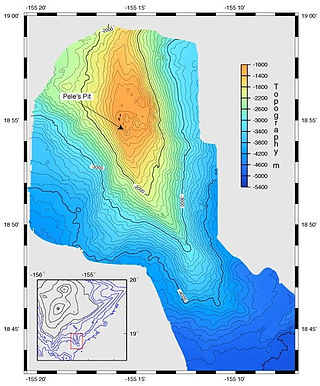
A bathymetric chart is a type of isarithmic map that depicts the submerged topography and physiographic features of ocean and sea bottoms. Their primary purpose is to provide detailed depth contours of ocean topography as well as provide the size, shape and distribution of underwater features. Topographic maps display elevation above ground and are complementary to bathymetric charts. Charts use a series of lines and points at equal intervals to showcase depth or elevation. A closed shape with increasingly smaller shapes inside of it can indicate an ocean trench or a seamount, or underwater mountain, depending on whether the depths increase or decrease going inward.
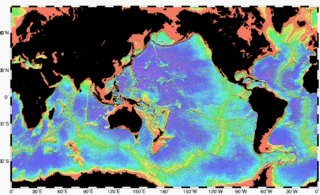
Bathymetry is the study of underwater depth of ocean floors, lake floors, or river floors. In other words, bathymetry is the underwater equivalent to hypsometry or topography. The first recorded evidence of water depth measurements are from Ancient Egypt over 3000 years ago. Bathymetric charts, are typically produced to support safety of surface or sub-surface navigation, and usually show seafloor relief or terrain as contour lines and selected depths (soundings), and typically also provide surface navigational information. Bathymetric maps may also use a Digital Terrain Model and artificial illumination techniques to illustrate the depths being portrayed. The global bathymetry is sometimes combined with topography data to yield a global relief model. Paleobathymetry is the study of past underwater depths.
The Sunda Trench, earlier known as and sometimes still indicated as the Java Trench, is an oceanic trench located in the Indian Ocean near Sumatra, formed where the Australian-Capricorn plates subduct under a part of the Eurasian Plate. It is 3,200 kilometres (2,000 mi) long with a maximum depth of 7,290 metres. Its maximum depth is the deepest point in the Indian Ocean. The trench stretches from the Lesser Sunda Islands past Java, around the southern coast of Sumatra on to the Andaman Islands, and forms the boundary between Indo-Australian Plate and Eurasian plate. The trench is considered to be part of the Pacific Ring of Fire as well as one of a ring of oceanic trenches around the northern edges of the Australian Plate.

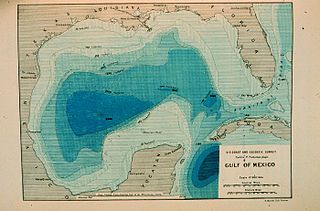
The Sigsbee Deep, is a roughly triangular basin that is the deepest part of the Gulf of Mexico named for Commander Charles Dwight Sigsbee, USN, Assistant U. S. Coast and Geodetic Survey, commanding officer of the USC&GS George S. Blake which discovered the feature during its mapping of the Gulf of Mexico. As described below there is some confusion of names that apply to the basin or a particular point in the basin with both being found in technical and popular literature applying to both basin and the coordinates.

The Rockall Trough is a deep-water bathymetric feature to the northwest of Scotland and Ireland, running roughly from southwest to northeast, flanked on the north by the Rockall Plateau and to the south by the Porcupine Seabight. At the northern end, the channel is bounded by the Wyville-Thomson Ridge, named after Charles Wyville Thomson, professor of zoology at the University of Edinburgh and driving force behind the Challenger Expedition. At the southern end, the trough opens into the Porcupine abyssal plain. The Rockall Basin is a large sedimentary basin that lies beneath the trough. Both are named after Rockall, a rocky islet lying 301.4 km west of St Kilda.
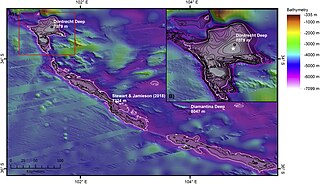
The Dordrecht Deep is located in the Diamantina Trench southwest of Perth, Western Australia. The Diamantina Trench is in the eastern part of the larger Diamantina Fracture Zone, which stretches 1,900 kilometres (1,200 mi) from the Ninety East Ridge to the Naturaliste Plateau, off the lower part of Southwest Australia. It is one of the deepest points in the Indian Ocean at 7,079 m (23,225 ft). It is located about 1,125 kilometres (699 mi) west-southwest of Perth at 35°S 104°E.
The Molloy Deep is a bathymetric feature in the Fram Strait, within the Greenland Sea east of Greenland and about 160 km west of Svalbard. It is the location of the deepest point in the Arctic Ocean. The Molloy Deep, Molloy Hole, Molloy Fracture Zone, and Molloy Ridge were named after Arthur E. Molloy, a U.S. Navy research scientist who worked in the North Atlantic, North Pacific and Arctic Oceans in the 1950s-1970s.
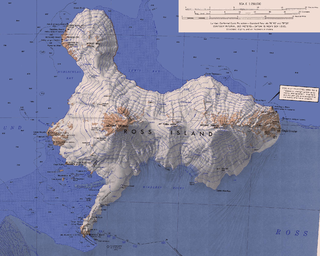
The Composite Gazetteer of Antarctica (CGA) of the Scientific Committee on Antarctic Research (SCAR) is the authoritative international gazetteer containing all Antarctic toponyms published in national gazetteers, plus basic information about those names and the relevant geographical features. The Gazetteer includes also parts of the International Hydrographic Organization (IHO) General Bathymetric Chart of the Oceans (GEBCO) gazetteer for under-sea features situated south of 60° south latitude.

The Wallaby Plateau, which is also known as the Cuvier Plateau, is a large bathymetric high about 450 kilometres (280 mi) west of Carnarvon, Western Australia. The Wallaby Plateau covers approximately 100,000 km2 (39,000 sq mi) and is in water depths of 2,200 meters (7,200 ft) to greater than 5,000 meters (16,000 ft). In the west, the Wallaby Plateau is separated from the Zenith Plateau by a 100–150-kilometre (62–93 mi) wide, north to northeast-trending bathymetric trough. Wallaby Plateau is the name used by the Australian geologists and government for this undersea plateau. This name was first used in a Hartog AGSO bathymetric map and formally recognized in a peer-reviewed paper by Symonds and Cameron in 1977. In contrast, the internationally recognized name for it is Cuvier Plateau. Cuvier is a historical name that is presumably derived from the adjacent Cape Cuvier. Cape Cuvier was named for Georges Cuvier, zoologist and statesman, by a French expedition led by Baudin in 1800–1803. The Wallaby Plateau lies inside the Australian Exclusive Economic Zone.
The Zenith Plateau is a large bathymetric high in the Indian Ocean, located about 450 kilometres (280 mi) west-northwest of the Wallaby Plateau, 1,400 kilometres (870 mi) west-northwest of Carnarvon, Western Australia, and 1,700 kilometres (1,100 mi) north-west of Perth, Western Australia. The summit of the Zenith Plateau lies 1,960 meters (6,430 ft) below sea level and its base is at about 5,000 meters (16,000 ft) below sea level. It is about 300 kilometres (190 mi) long and 200 kilometres (120 mi) wide. In the east, the Zenith Plateau is separated from the Wallaby (Cuvier) Plateau by a 100–150 kilometres (62–93 mi) wide, north to northeast-trending bathymetric trough. The Zenith Plateau lies outside of the Australian Exclusive Economic Zone.
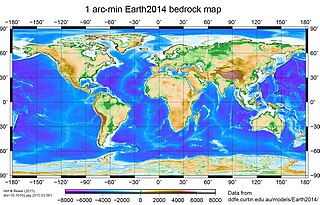
A global relief model, sometimes also denoted as global topography model or composite model, combines digital elevation model (DEM) data over land with digital bathymetry model (DBM) data over water-covered areas to describe Earth's relief. A relief model thus shows how Earth's surface would look like in the absence of water or ice masses.
Bathymetric Attributed Grid (BAG) is a file format designed to store and exchange bathymetric data.
Viaud Ridge is an undersea mountain range in the Indian Ocean located south of India, southwest of Sri Lanka and east of the Maldives. Its morphology remains poorly defined: estimates range from between 15 and 25 kilometers long, peaking at about 1,700 meters above the ocean floor. Discovered in 1970, it was only named in 1993 in honor of the brother of the French writer Pierre Loti, Gustave Viaud, a naval surgeon and the first photographer of Tahiti who died and was immersed in the area in 1865.
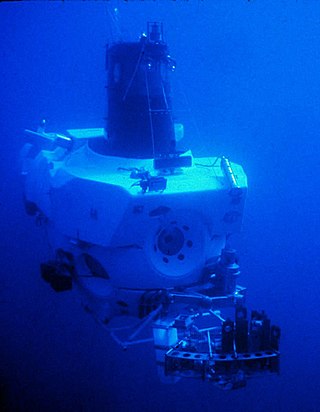
Underwater exploration is the exploration of any underwater environment, either by direct observation by the explorer, or by remote observation and measurement under the direction of the investigators. Systematic, targeted exploration is the most effective method to increase understanding of the ocean and other underwater regions, so they can be effectively managed, conserved, regulated, and their resources discovered, accessed, and used. Less than 10% of the ocean has been mapped in any detail, less has been visually observed, and the total diversity of life and distribution of populations is similarly obscure.

The International Bathymetric Chart of the Southern Ocean (IBCSO) is a regional mapping initiative of the General Bathymetric Chart of the Oceans (GEBCO). IBSCO receives support from the Nippon Foundation – GEBCO Seabed 2030 Project.
