The term glyph is used in typography, architecture, archaeology and informatics. Broadly, the term means any kind of purposeful mark, such as a simple vertical line incised on a building, a single letter in a script, or a carved symbol. The mark need not be a physical one.
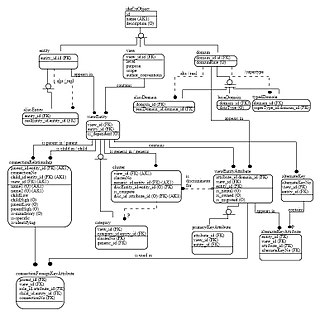
In computer science and information science, an ontology encompasses a representation, formal naming, and definition of the categories, properties, and relations between the concepts, data, and entities that substantiate one, many, or all domains of discourse. More simply, an ontology is a way of showing the properties of a subject area and how they are related, by defining a set of concepts and categories that represent the subject.

Technical drawing, drafting or drawing, is the act and discipline of composing drawings that visually communicate how something functions or is constructed.
A data model is an abstract model that organizes elements of data and standardizes how they relate to one another and to the properties of real-world entities. For instance, a data model may specify that the data element representing a car be composed of a number of other elements which, in turn, represent the color and size of the car and define its owner.

Social network analysis (SNA) is the process of investigating social structures through the use of networks and graph theory. It characterizes networked structures in terms of nodes and the ties, edges, or links that connect them. Examples of social structures commonly visualized through social network analysis include social media networks, memes spread, information circulation, friendship and acquaintance networks, business networks, knowledge networks, difficult working relationships, social networks, collaboration graphs, kinship, disease transmission, and sexual relationships. These networks are often visualized through sociograms in which nodes are represented as points and ties are represented as lines. These visualizations provide a means of qualitatively assessing networks by varying the visual representation of their nodes and edges to reflect attributes of interest.
Solid modeling is a consistent set of principles for mathematical and computer modeling of three-dimensional shapes (solids). Solid modeling is distinguished from related areas of geometric modeling and computer graphics, such as 3D modeling, by its emphasis on physical fidelity. Together, the principles of geometric and solid modeling form the foundation of 3D-computer-aided design and in general support the creation, exchange, visualization, animation, interrogation, and annotation of digital models of physical objects.

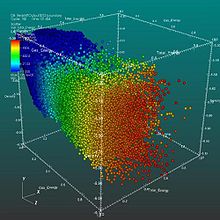
Scientific visualization is an interdisciplinary branch of science concerned with the visualization of scientific phenomena. It is also considered a subset of computer graphics, a branch of computer science. The purpose of scientific visualization is to graphically illustrate scientific data to enable scientists to understand, illustrate, and glean insight from their data. Research into how people read and misread various types of visualizations is helping to determine what types and features of visualizations are most understandable and effective in conveying information.

Visualization or visualisation is any technique for creating images, diagrams, or animations to communicate a message. Visualization through visual imagery has been an effective way to communicate both abstract and concrete ideas since the dawn of humanity. Examples from history include cave paintings, Egyptian hieroglyphs, Greek geometry, and Leonardo da Vinci's revolutionary methods of technical drawing for engineering and scientific purposes.
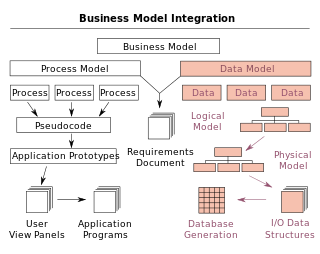
An information model in software engineering is a representation of concepts and the relationships, constraints, rules, and operations to specify data semantics for a chosen domain of discourse. Typically it specifies relations between kinds of things, but may also include relations with individual things. It can provide sharable, stable, and organized structure of information requirements or knowledge for the domain context.
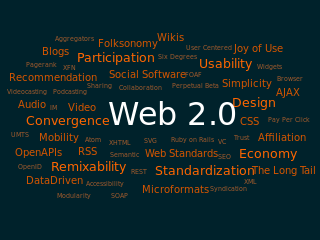
A tag cloud is a visual representation of text data, which is often used to depict keyword metadata on websites, or to visualize free form text. Tags are usually single words, and the importance of each tag is shown with font size or color. When used as website navigation aids, the terms are hyperlinked to items associated with the tag.

Data and information visualization is an interdisciplinary field that deals with the graphic representation of data and information. It is a particularly efficient way of communicating when the data or information is numerous as for example a time series.
The Biomolecular Object Network Databank is a bioinformatics databank containing information on small molecule structures and interactions. The databank integrates a number of existing databases to provide a comprehensive overview of the information currently available for a given molecule.
DOGMA, short for Developing Ontology-Grounded Methods and Applications, is the name of research project in progress at Vrije Universiteit Brussel's STARLab, Semantics Technology and Applications Research Laboratory. It is an internally funded project, concerned with the more general aspects of extracting, storing, representing and browsing information.
Visual analytics is an outgrowth of the fields of information visualization and scientific visualization that focuses on analytical reasoning facilitated by interactive visual interfaces.

2.5D is an effect in visual perception. It is the construction of an apparently three-dimensional environment from 2D retinal projections. While the result is technically 2D, it allows for the illusion of depth. It is easier for the eye to discern the distance between two items than the depth of a single object in the view field. Computers can use 2.5D to make images human faces look lifelike.
Spatial contextual awareness consociates contextual information such as an individual's or sensor's location, activity, the time of day, and proximity to other people or objects and devices. It is also defined as the relationship between and synthesis of information garnered from the spatial environment, a cognitive agent, and a cartographic map. The spatial environment is the physical space in which the orientation or wayfinding task is to be conducted; the cognitive agent is the person or entity charged with completing a task; and the map is the representation of the environment which is used as a tool to complete the task.

A motion chart is a dynamic bubble chart which allows efficient and interactive exploration and visualization of longitudinal multivariate Data. Motion charts provide mechanisms for mapping ordinal, nominal and quantitative variables onto time, 2D coordinate axes, size, colors, glyphs and appearance characteristics, which facilitate the interactive display of multidimensional and temporal data.

Moose is a free and open source platform for software and data analysis built in Pharo.
A bioinformatics workflow management system is a specialized form of workflow management system designed specifically to compose and execute a series of computational or data manipulation steps, or a workflow, that relate to bioinformatics.
Interactive Visual Analysis (IVA) is a set of techniques for combining the computational power of computers with the perceptive and cognitive capabilities of humans, in order to extract knowledge from large and complex datasets. The techniques rely heavily on user interaction and the human visual system, and exist in the intersection between visual analytics and big data. It is a branch of data visualization. IVA is a suitable technique for analyzing high-dimensional data that has a large number of data points, where simple graphing and non-interactive techniques give an insufficient understanding of the information.