Hertford (UK Parliament constituency)

Last updated

Hertford
Former County constituency
for the House of Commons
County Hertfordshire
Major settlements Hertford
18851974 (1974)
SeatsOne
Replaced by Hertford & Stevenage
1298–1885
SeatsTwo (1298-1868), One (1868-1885)
Type of constituency Borough constituency

Hertford was the name of a parliamentary constituency in Hertfordshire, which elected Members of Parliament (MPs) from 1298 until 1974.

Contents

History

The Parliamentary Borough of Hertford was represented by two MPs in the House of Commons of England from 1298 to 1707, then of the House of Commons of Great Britain from 1707 to 1800, and finally in the House of Commons of the Parliament of the United Kingdom from 1801 onwards. Under the Boundaries Act of 1868, its representation was reduced to 1 MP. [1]

The Redistribution of Seats Act 1885 (which followed on from the Third Reform Act) abolished the Parliamentary Borough and it gave its name to one of four Divisions of the abolished three-member Parliamentary County of Hertfordshire, and was formally named as the Eastern or Hertford Division of Hertfordshire.

As well as the Borough of Hertford, the enlarged constituency included the towns of Ware, Bishop's Stortford and Hoddesdon. It remained largely unchanged until 1955, but was radically altered for the 1955 general election. It was abolished in 1974.

Boundaries and boundary changes

1885–1918

1918–1950

Minor changes to boundaries.

1950–1955

Nominal changes only to reflect restructuring of rural districts.

1955–1974

Significant changes with only the Municipal Borough and the part of the Rural District of Hertford retained. The remainder of the constituency formed the basis of the new County Constituency of East Hertfordshire. The Urban District of Welwyn Garden City and the Rural District of Welwyn were transferred from St Albans; the Rural District of Hatfield from Barnet; and the remainder of the Rural District of Hertford from Hitchin.

The constituency was abolished in the redistribution taking effect for the February 1974 general election. The Municipal Borough and Rural District of Hertford were included in the new constituency of Hertford and Stevenage, with remaining areas forming the new constituency of Welwyn and Hatfield.

Members of Parliament

Hertford borough (1298-1885)

1298-1640

ParliamentFirst memberSecond member
1376Constituency franchise lapsed
1624Constituency re-enfranchised by Parliament
1624 William Ashton Thomas Fanshawe
1625 William Ashton Thomas Fanshawe
1626 Sir William Harrington Sir Capell Bedell
1628 Sir Edward Howard ennobled
and replaced by Sir Charles Morrison
Sir Thomas Fanshawe
1629 John Carey, Viscount Rochford Sir Thomas Fanshawe
1629–1640No Parliaments summoned

1640-1868

YearFirst memberFirst partySecond memberSecond party
April 1640 Viscount Cranborne Parliamentarian Sir Thomas Fanshawe Royalist
November 1640
November 1643Fanshawe disabled from sitting - seat vacant
1645 William Leman
December 1648Cranborne not recorded as sitting after Pride's Purge
1653Hertford was unrepresented in the Barebones Parliament
1654 Isaac Pulter Hertford had only one seat in the First and
Second Parliaments of the Protectorate
1656
January 1659 James Cowper
May 1659 Not represented in the restored Rump
April 1660 Arthur Sparke James Cowper
1661 Sir Edward Turnor Thomas Fanshawe
1673 Sir Thomas Byde
1675 Edmund Feilde
1677 Sir John Gore
February 1679 Sir Charles Caesar
September 1679 Sir William Cowper
1685 Sir Francis Boteler
1689 Sir William Cowper
1690 Sir William Leman
1695 William Cowper
January 1701 Charles Caesar Thomas Filmer
February 1701 Richard Goulston
1705 Sir Thomas Clarke
1708 William Monson
1710 Charles Caesar Richard Goulston
1715 [6] Sir Thomas Clarke John Boteler
1722 Edward Harrison Charles Caesar [7]
1723 Sir Thomas Clarke
1727 George Harrison
1734 Nathaniel Brassey
1741 George Harrison
1759 George Cowper
1761 John Calvert Timothy Caswall
1768 William Cowper
1770 Paul Feilde
1780 Thomas, Baron Dimsdale [8] William Baker
1784 John Calvert
1790 Nathaniel, Baron Dimsdale [8]
1802 Hon. Edward Spencer Cowper Whig [9] Nicolson Calvert Whig [9]
1817 James Gascoyne-Cecil Tory [9]
1823 Thomas Byron Tory [10]
1826 Thomas Slingsby Duncombe Whig [9]
1830 Henry Chetwynd-Talbot Tory [9]
1831 John Currie Whig [9]
1832 [11] Henry Chetwynd-Talbot Tory [9] Philip Stanhope Tory [9]
1832writ suspended: both seats vacant until 1835 [11]
1835 Hon. William Cowper Whig [12] [13] [14] [9] Philip Stanhope Conservative [9]
1852 Thomas Chambers Radical [15] [16] [17]
1857 Sir Walter Townshend-Farquhar Conservative
1859 Liberal
1866 Robert Dimsdale Conservative
1868 Representation reduced to one MP

1868-1885

ElectionMemberParty
1868 Robert Dimsdale Conservative
1874 Arthur Balfour Conservative
1885 Constituency abolished; name transferred to county division

Hertford county constituency (1885-1974)

ElectionMemberParty
1885 Abel Smith Conservative
1898 by-election Evelyn Cecil Conservative
1900 Abel Henry Smith Conservative
Jan. 1910 Sir John Rolleston Conservative
1916 by-election Noel Pemberton Billing Independent
1918 Silver Badge Party
1921 by-election (Sir) Murray Sueter Anti-Waste League/Independent Parliamentary Group
1922 Conservative
1945 Sir Derek Walker-Smith Conservative
1955 Robert Lindsay Conservative
Feb. 1974 Constituency abolished - see Hertford and Stevenage

Elections

Elections in the 1830s

General election 1830: Hertford [9] [10]
PartyCandidateVotes%
Whig Thomas Slingsby Duncombe Unopposed
Tory Henry Chetwynd-Talbot Unopposed
Registered electors c.800
Whig hold
Tory hold
General election 1831: Hertford [9] [10]
PartyCandidateVotes%
Whig Thomas Slingsby Duncombe 492 37.7
Whig John Currie (MP) 431 33.0
Tory Henry Chetwynd-Talbot 38329.3
Majority483.7
Turnout 739c.92.4
Registered electors c.800
Whig hold
Whig gain from Tory
General election 1832: Hertford [9] [18]
PartyCandidateVotes%±%
Tory Henry Chetwynd-Talbot 432 32.5 +17.9
Tory Philip Stanhope 381 28.7 +14.1
Radical Thomas Slingsby Duncombe 32924.812.9
Radical John Eden Spalding18614.0N/A
Majority523.9N/A
Turnout 67195.9c.+3.5
Registered electors 700
Tory gain from Whig Swing +12.2
Tory gain from Whig Swing +10.3

The 1832 election was later declared void, but a new writ was not issued during the course of the parliament.

General election 1835: Hertford [9] [18]
PartyCandidateVotes%±%
Conservative Philip Stanhope 359 35.7 +7.0
Whig William Cowper 327 32.5 N/A
Conservative Henry Chetwynd-Talbot 32131.90.6
Turnout 61697.3+1.4
Registered electors 633
Majority323.20.7
Conservative hold Swing N/A
Majority60.6N/A
Whig gain from Conservative Swing N/A
General election 1837: Hertford [9] [18]
PartyCandidateVotes%±%
Whig William Cowper 378 38.5 +6.0
Conservative Philip Stanhope 306 31.2 36.4
Radical John Currie (MP)29730.3N/A
Turnout 58091.95.4
Registered electors 631
Majority727.3+6.7
Whig hold Swing +21.2
Majority90.92.3
Conservative hold Swing 21.2

Cowper was appointed as a commissioner of Greenwich Hospital, requiring a by-election.

By-election, 20 May 1839: Hertford [9] [18]
PartyCandidateVotes%±%
Whig William Cowper 297 51.7 +13.2
Conservative Walter Townsend-Farquhar 27848.3+17.1
Majority193.43.9
Turnout 57592.9+1.0
Registered electors 619
Whig hold Swing 2.0

Elections in the 1840s

General election 1841: Hertford [18] [9] [10]
PartyCandidateVotes%±%
Whig William Cowper Unopposed
Conservative Philip Stanhope Unopposed
Registered electors 607
Whig hold
Conservative hold

Cowper was appointed a Civil Lord of the Admiralty, requiring a by-election.

By-election, 11 July 1846: Hertford [18]
PartyCandidateVotes%±%
Whig William Cowper Unopposed
Whig hold
General election 1847: Hertford [18]
PartyCandidateVotes%±%
Whig William Cowper Unopposed
Conservative Philip Stanhope Unopposed
Registered electors 567
Whig hold
Conservative hold

Elections in the 1850s

General election 1852: Hertford [18]
PartyCandidateVotes%±%
Whig William Cowper 301 32.3 N/A
Radical Thomas Chambers 235 25.2 N/A
Conservative Philip Stanhope 21322.9N/A
Conservative Charles Dimsdale [19] 18219.5N/A
Turnout 466 (est)68.0 (est)N/A
Registered electors 685
Majority667.1N/A
Whig hold Swing N/A
Majority222.3N/A
Radical gain from Conservative

Cowper was appointed Civil Lord of the Admiralty, requiring a by-election.

By-election, 1 January 1853: Hertford [18]
PartyCandidateVotes%±%
Whig William Cowper Unopposed
Whig hold

Cowper was appointed president of the General Board of Health, requiring a by-election.

By-election, 14 August 1855: Hertford [18]
PartyCandidateVotes%±%
Whig William Cowper Unopposed
Whig hold

Cowper was appointed Vice-President of the Committee of the Council on Education, requiring a by-election.

By-election, 9 February 1857: Hertford [18]
PartyCandidateVotes%±%
Whig William Cowper Unopposed
Whig hold
General election 1857: Hertford [18]
PartyCandidateVotes%±%
Whig William Cowper 301 37.2 +4.9
Conservative Walter Townsend-Farquhar 273 33.7 8.7
Radical Thomas Chambers 23529.0+3.8
Turnout 405 (est)65.2 (est)2.8
Registered electors 620
Majority283.53.6
Whig hold Swing +4.6
Majority384.7N/A
Conservative gain from Radical Swing 6.3
General election 1859: Hertford [18]
PartyCandidateVotes%±%
Liberal William Cowper Unopposed
Conservative Walter Townsend-Farquhar Unopposed
Registered electors 530
Liberal hold
Conservative hold

Cowper was appointed Vice-President of the Board of Trade, requiring a by-election.

By-election, 19 August 1859: Hertford [18]
PartyCandidateVotes%±%
Liberal William Cowper 281 57.9 N/A
Conservative Robert Dimsdale 20442.1N/A
Majority7715.8N/A
Turnout 48591.5N/A
Registered electors 530
Liberal hold Swing N/A

Elections in the 1860s

Cowper was appointed First Commissioner of Works and Public Buildings, requiring a by-election.

By-election, 13 February 1860: Hertford [18]
PartyCandidateVotes%±%
Liberal William Cowper Unopposed
Liberal hold
General election 1865: Hertford [18]
PartyCandidateVotes%±%
Liberal William Cowper Unopposed
Conservative Walter Townshend-Farquhar Unopposed
Registered electors 543
Liberal hold
Conservative hold

Townshend-Farquhar's death caused a by-election.

By-election, 30 June 1866: Hertford [18]
PartyCandidateVotes%±%
Conservative Robert Dimsdale Unopposed
Conservative hold

Seat reduced to one member

General election 1868: Hertford [18]
PartyCandidateVotes%±%
Conservative Robert Dimsdale 434 55.7 N/A
Liberal Frederick Waymouth Gibbs [20] 34544.3N/A
Majority8911.4N/A
Turnout 77984.5N/A
Registered electors 922
Conservative hold

Elections in the 1870s

Arthur Balfour was MP for Hertford between 1874 and 1885, and later Prime Minister. Arthur James Balfour00.jpg
Arthur Balfour was MP for Hertford between 1874 and 1885, and later Prime Minister.
General election 1874: Hertford [18]
PartyCandidateVotes%±%
Conservative Arthur Balfour Unopposed
Registered electors 1,041
Conservative hold

Elections in the 1880s

General election 1880: Hertford [18]
PartyCandidateVotes%±%
Conservative Arthur Balfour 564 58.5 N/A
Liberal Edward Ernest Bowen [21] 40041.5New
Majority16417.0N/A
Turnout 96489.2N/A
Registered electors 1,081
Conservative hold Swing N/A

Balfour was appointed President of the Local Government Board, requiring a by-election.

By-election, 30 Jun 1885: Hertford [18]
PartyCandidateVotes%±%
Conservative Arthur Balfour Unopposed
Conservative hold
Smith Abel Smith (1829-1898).jpg
Smith
General election 1885: Hertford [22] [23]
PartyCandidateVotes%±%
Conservative Abel Smith 4,263 58.1 0.4
Liberal Henry Cowper 3,07241.9+0.4
Majority1,19116.20.8
Turnout 7,33583.06.2
Registered electors 8,840
Conservative hold Swing 0.4
General election 1886: Hertford [22] [23]
PartyCandidateVotes%±%
Conservative Abel Smith Unopposed
Conservative hold

Elections in the 1890s

General election 1892: Hertford [22] [23]
PartyCandidateVotes%±%
Conservative Abel Smith 4,276 60.3 N/A
Liberal Edwin Robert Speirs2,81839.7New
Majority1,45820.6N/A
Turnout 7,09475.8N/A
Registered electors 9,355
Conservative hold Swing N/A
General election 1895: Hertford [22] [23]
PartyCandidateVotes%±%
Conservative Abel Smith Unopposed
Conservative hold

Smith's death caused a by-election.

Spencer Charles Spencer, 6th Earl Spencer.jpg
Spencer
1898 Hertford by-election [22]
PartyCandidateVotes%±%
Conservative Evelyn Cecil 4,118 51.7 N/A
Liberal Charles Spencer 3,85048.3New
Majority2683.4N/A
Turnout 7,96877.4N/A
Registered electors 10,301
Conservative hold Swing N/A

Elections in the 1900s

Smith Abel Henry Smith.jpg
Smith
General election 1900: Hertford [22] [23]
PartyCandidateVotes%±%
Conservative Abel Henry Smith Unopposed
Conservative hold
Buxton Charles Roden Buxton.jpg
Buxton
General election 1906: Hertford [22] [23]
PartyCandidateVotes%±%
Conservative Abel Henry Smith 4,836 50.4 N/A
Liberal Charles Buxton 4,75649.6New
Majority800.8N/A
Turnout 9,59286.2N/A
Registered electors 11,124
Conservative hold Swing N/A

Elections in the 1910s

General election January 1910: Hertford [24] [23]
PartyCandidateVotes%±%
Conservative John Rolleston 6,147 58.0 +7.6
Liberal Edmund Broughton Barnard 4,45542.07.6
Majority1,69216.0+15.2
Turnout 10,60289.6+3.4
Registered electors 11,838
Conservative hold Swing +7.6
General election December 1910: Hertford [24] [23]
PartyCandidateVotes%±%
Conservative John Rolleston 5,594 57.0 −1.0
Liberal George Strachan Pawle4,22643.0+1.0
Majority1,36814.0−2.0
Turnout 9,82083.06.6
Registered electors 12,684
Conservative hold Swing −1.0

General Election 1914–15:

Another General Election was required to take place before the end of 1915. The political parties had been making preparations for an election to take place and by July 1914, the following candidates had been selected;

Billing Billing portrait.jpg
Billing
1916 Hertford by-election [24]
PartyCandidateVotes%±%
Independent Noel Pemberton Billing 4,590 56.3 New
Unionist Brodie Henderson 3,55943.713.3
Majority1,03112.6N/A
Turnout 8,14964.218.8
Registered electors 12,684
Independent gain from Unionist Swing N/A
General election 1918: Hertford [25]
PartyCandidateVotes%±%
Independent Noel Pemberton-Billing 9,628 52.1 N/A
National *Edmund Broughton Barnard 7,15838.8−18.2
Labour Cyril Harding1,6799.1New
Majority2,47013.3N/A
Turnout 18,46557.425.6
Registered electors 32,158
Independent hold Swing N/A

* Barnard was also the nominee of the National Farmers' Union

Elections in the 1920s

1921 Hertford by-election [25]
PartyCandidateVotes%±%
Anti-Waste League *Murray Sueter 12,329 68.9 New
Unionist Hildred Carlile 5,55331.1New
Majority6,77637.8N/A
Turnout 17,88255.12.3
Registered electors 32,426
Anti-Waste League gain from Independent Swing N/A

* Sueter was also the nominee of the Independent Parliamentary Group.

General election 1922: Hertford [25]
PartyCandidateVotes%±%
Unionist Murray Sueter 11,406 63.6 N/A
Liberal Thomas Greenwood6,53436.4New
Majority4,87227.2N/A
Turnout 17,94054.13.3
Registered electors 33,184
Unionist gain from Anti-Waste League Swing N/A
General election 1923: Hertford [26]
PartyCandidateVotes%±%
Unionist Murray Sueter 10,660 52.2 11.4
Liberal Thomas Greenwood9,76347.8+11.4
Majority8974.422.8
Turnout 20,42360.6+6.5
Registered electors 33,704
Unionist hold Swing 11.4
General election 1924: Hertford [25]
PartyCandidateVotes%±%
Unionist Murray Sueter 14,582 60.0 +7.8
Liberal Thomas Morris Davies5,82824.023.8
Labour Ernest Selley3,88516.0New
Majority8,75436.0+31.6
Turnout 24,29570.8+10.2
Registered electors 34,315
Unionist hold Swing +15.8
General election 1929: Hertford [25]
PartyCandidateVotes%±%
Unionist Murray Sueter 13,525 39.5 20.5
Independent Noel Pemberton Billing 10,14929.6New
Liberal Thomas Evander Evans6,41918.75.3
Labour Roger S Edwards4,19312.23.8
Majority3,3769.926.1
Turnout 34,28674.7+3.9
Registered electors 45,893
Unionist hold Swing 7.6

Elections in the 1930s

General election 1931: Hertford [25]
PartyCandidateVotes%±%
Conservative Murray Sueter 25,751 78.4 +38.9
Labour Roger S Edwards7,09221.6+9.4
Majority18,65956.8+46.9
Turnout 32,84369.1−5.6
Conservative hold Swing +14.7
General election 1935: Hertford [25]
PartyCandidateVotes%±%
Conservative Murray Sueter 21,193 64.8 −13.6
Labour Roger S Edwards11,49235.2+13.6
Majority9,70129.6−27.2
Turnout 32,68562.5−6.6
Conservative hold Swing −11.7

Elections in the 1940s

General Election 1939–40: Another General Election was required to take place before the end of 1940. The political parties had been making preparations for an election to take place from 1939 and by the end of this year, the following candidates had been selected;

General election 1945: Hertford [25]
PartyCandidateVotes%±%
Conservative Derek Walker-Smith 19,877 43.3 −21.5
Labour Lynton Scutts17,34937.9+2.7
Liberal Thomas Peter Hughes7,58716.6new
Independent Arthur Bernard Swain1,0052.2new
Majority2,5285.4−24.2
Turnout 45,81870.4+7.9
Conservative hold Swing −12.1

Elections in the 1950s

General election 1950: Hertford [28] [29]
PartyCandidateVotes%±%
Conservative Derek Walker-Smith 25,074 45.90 +2.60
Labour Lynton Scutts19,32435.37−2.53
Liberal Thomas Peter Hughes10,23418.73+2.13
Majority5,75010.53+5.13
Turnout 54,63283.18+12.78
Registered electors 65,683
Conservative hold Swing +2.57
General election 1951: Hertford [28] [30] [31]
PartyCandidateVotes%±%
Conservative Derek Walker-Smith 30,519 56.28 +10.38
Labour Co-op Richard Marsh 23,70843.72+8.35
Majority6,81112.56+2.03
Turnout 54,22780.80−2.38
Registered electors 67,110
Conservative hold Swing +1.02
General election 1955: Hertford [28] [32]
PartyCandidateVotes%±%
Conservative Robert Lindsay 25,014 56.79 +0.51
Labour John McKnight19,03043.21−0.51
Majority5,98413.58+1.02
Turnout 44,04482.24+1.44
Registered electors 53,556
Conservative hold Swing +0.51
General election 1959: Hertford [28] [33]
PartyCandidateVotes%±%
Conservative Robert Lindsay 31,418 58.17 +1.38
Labour Gerald D Southgate22,59741.83−1.38
Majority8,82116.34+2.76
Turnout 54,01584.26+2.02
Registered electors 64,106
Conservative hold Swing +1.38

Elections in the 1960s

General election 1964: Hertford [28] [34]
PartyCandidateVotes%±%
Conservative Robert Lindsay 29,134 46.23 −11.94
Labour Thomas A Deacon25,16139.93−1.90
Liberal Anna Harman8,72213.84New
Majority3,9736.30−10.04
Turnout 63,01784.64+0.38
Registered electors 74,450
Conservative hold Swing −5.02
General election 1966: Hertford [28] [35]
PartyCandidateVotes%±%
Conservative Robert Lindsay 32,302 50.62 +3.79
Labour Peter Nurse31,50849.38+9.45
Majority7941.24−5.06
Turnout 63,81083.70−0.94
Registered electors 76,234
Conservative hold Swing −2.83

Elections in the 1970s

General election 1970: Hertford [28] [36]
PartyCandidateVotes%±%
Conservative Robert Lindsay 36,494 52.58 +1.96
Labour Yvonne Sieve26,92438.79−10.59
Liberal John Melling5,9948.64New
Majority9,57013.79+12.55
Turnout 69,41278.08−5.62
Registered electors 88,900
Conservative hold Swing +6.28

Related Research Articles

<span class="mw-page-title-main">East Hertfordshire</span> Non-metropolitan district in England

East Hertfordshire is one of ten local government districts in Hertfordshire, England. Its council is based in Hertford, the county town of Hertfordshire. The largest town in the district is Bishop's Stortford, and the other main towns are Ware, Buntingford and Sawbridgeworth. At the 2011 Census, the population of the district was 137,687. By area it is the largest of the ten local government districts in Hertfordshire. The district borders North Hertfordshire, Stevenage, Welwyn Hatfield and Broxbourne in Hertfordshire, and Epping Forest, Harlow and Uttlesford in Essex.

<span class="mw-page-title-main">Westbury (UK Parliament constituency)</span>

<span class="mw-page-title-main">Great Yarmouth (UK Parliament constituency)</span> Parliamentary constituency in the United Kingdom, 1801-1868 & 1885 onwards

Great Yarmouth is a constituency represented in the House of Commons of the Parliament of the United Kingdom since the 2010 general election by Sir Brandon Lewis, a Conservative.

<span class="mw-page-title-main">St Albans (UK Parliament constituency)</span> Parliamentary constituency in the United Kingdom, 1801-1852 & 1885 onwards

St Albans is a constituency represented in the House of Commons of the UK Parliament since 2019 by Daisy Cooper, a Liberal Democrat.

<span class="mw-page-title-main">Lichfield (UK Parliament constituency)</span> Parliamentary constituency in the United Kingdom, 1997 onwards

Lichfield is a constituency in Staffordshire represented in the House of Commons of the UK Parliament since its 1997 recreation by Michael Fabricant, a Conservative.

<span class="mw-page-title-main">Broxbourne (UK Parliament constituency)</span> Parliamentary constituency in the United Kingdom, 1983 onwards

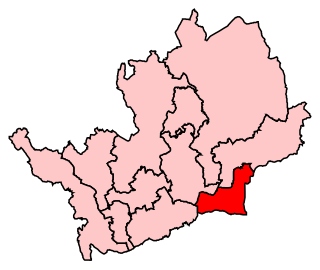
Broxbourne is a constituency in Hertfordshire represented in the House of Commons of the UK Parliament since 2005 by Charles Walker of the Conservative Party.

<span class="mw-page-title-main">Hertford and Stortford (UK Parliament constituency)</span> Parliamentary constituency in the United Kingdom, 1983 onwards

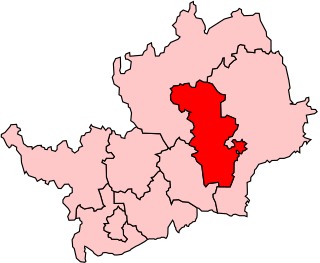
Hertford and Stortford is a constituency currently represented in the House of Commons of the UK Parliament since 2019 by Julie Marson of the Conservative Party.

<span class="mw-page-title-main">Lancaster (UK Parliament constituency)</span> Parliamentary constituency in the United Kingdom, 1885–1997

Lancaster was a constituency of the House of Commons of the Parliament of England then of the Parliament of Great Britain from 1707 to 1800 and of the Parliament of the United Kingdom from 1801 to 1867, centred on the historic city of Lancaster in north-west England. It was represented by two Members of Parliament until the constituency was disenfranchised for corruption in 1867.

Huntingdonshire was a Parliamentary constituency covering the county of Huntingdonshire in England. It was represented by two Members of Parliament in the House of Commons of England until 1707, then in the House of Commons of Great Britain from 1707 to 1800, and then in the House of Commons the Parliament of the United Kingdom from 1801 to 1885.

<span class="mw-page-title-main">Kidderminster (UK Parliament constituency)</span> Parliamentary constituency in the United Kingdom, 1832–1983

Kidderminster was a parliamentary constituency in Worcestershire, represented in the House of Commons of the Parliament of the United Kingdom. It elected one Member of Parliament (MP) by the first past the post voting system.

King's Lynn was a constituency in Norfolk which was represented continuously in the House of Commons of England from 1298 to 1707, in the House of Commons of Great Britain from 1707 to 1800, and in the House of Commons of the United Kingdom from 1801 until it was abolished for the February 1974 general election.

<span class="mw-page-title-main">Walthamstow East (UK Parliament constituency)</span> Parliamentary constituency in the United Kingdom, 1918–1974

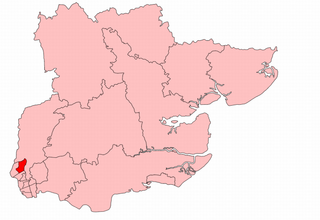
Walthamstow East was a parliamentary constituency in what was then the Municipal Borough of Walthamstow in east London. It returned one Member of Parliament (MP) to the House of Commons of the Parliament of the United Kingdom, elected by the first-past-the-post voting system.

<span class="mw-page-title-main">Hitchin (UK Parliament constituency)</span> Parliamentary constituency in the United Kingdom, 1885–1983

Hitchin was a parliamentary constituency in Hertfordshire which returned one Member of Parliament (MP) to the House of Commons of the Parliament of the United Kingdom from 1885 until it was abolished for the 1983 general election.

<span class="mw-page-title-main">South East Essex (UK Parliament constituency)</span> Parliamentary constituency in the United Kingdom, 1885-1950 & 1955–1983

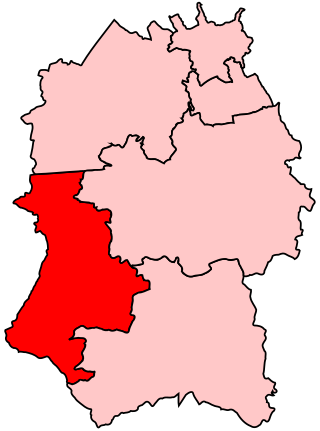
South East Essex was a parliamentary constituency in Essex in the East of England. It returned one Member of Parliament (MP) to the House of Commons of the Parliament of the United Kingdom.

<span class="mw-page-title-main">East Hertfordshire (UK Parliament constituency)</span> Parliamentary constituency in the United Kingdom, 1955–1983

East Hertfordshire was a parliamentary constituency in the county of Hertfordshire from 1955 to 1983. It returned one Member of Parliament (MP) to the House of Commons of the Parliament of the United Kingdom.

<span class="mw-page-title-main">Hertford and Stevenage (UK Parliament constituency)</span> Parliamentary constituency in the United Kingdom, 1974–1983

Hertford and Stevenage was a parliamentary constituency in Hertfordshire, which returned one Member of Parliament (MP) to the House of Commons of the Parliament of the United Kingdom from February 1974 until it was abolished for the 1983 general election.

<span class="mw-page-title-main">2023 East Hertfordshire District Council election</span>

The 2023 East Hertfordshire District Council election took place on 4 May 2023 to elect members of East Hertfordshire District Council in Hertfordshire, England. This was on the same day as other local elections.

References

  1. Great Britain (1868). The Statutes of the United Kingdom of Great Britain and Ireland [1807-1868/69]. unknown library. His Majesty's statute and law printers.
  2. Great Britain, Incorporated Council of Law Reporting for England and Wales. The public general acts. unknown library. Proprietors of the Law Journal Reports, 1884.
  3. Fraser, Hugh (1918). The Representation of the people act, 1918 : with explanatory notes. University of California Libraries. London : Sweet and Maxwell.
  4. "Representation of the People Act, 1948". www.legislation.gov.uk. Retrieved 23 February 2019.
  5. S., Craig, Fred W. (1972). Boundaries of parliamentary constituencies 1885-1972;. Chichester: Political Reference Publications. ISBN   0900178094. OCLC   539011.{{cite book}}: CS1 maint: multiple names: authors list (link)
  6. At the general election of 1715, Caesar and Goulston were initially declared re-elected, but on petition the result was overturned and their opponents, Clarke and Boteler, were seated in their place
  7. On petition, Caesar was adjudged not to have been duly elected and his opponent, Clarke, was declared elected in his place
  8. 1 2 Dimsdale was a baron in the Russian peerage
  9. 1 2 3 4 5 6 7 8 9 10 11 12 13 14 15 16 17 Stooks Smith, Henry. (1973) [1844-1850]. Craig, F. W. S. (ed.). The Parliaments of England (2nd ed.). Chichester: Parliamentary Research Services. pp.  145–147. ISBN   0-900178-13-2.
  10. 1 2 3 4 Fisher, David R. "Hertford". The History of Parliament. Retrieved 14 April 2020.
  11. 1 2 At the election of 1832 Ingestrie and Mahon were declared elected, but on petition was their election was declared void, Hertford's writ was suspended and the seats remained vacant until the next general election
  12. "Hertford" . Hertford Mercury and Reformer. 17 February 1835. p. 3. Retrieved 14 May 2018 via British Newspaper Archive.
  13. Dod, Charles Roger; Dod, Robert Phipps (1847). Dod's Parliamentary Companion, Volume 15. Dod's Parliamentary Companion. pp. 151–152. Retrieved 14 May 2018.
  14. Warwick, William Atkinson (1841). The House of Commons: As Elected to the Fourteenth Parliament of the United Kingdom, Being The Second of Victoria. London: Saunders and Otley. p. 43.
  15. Dod, Charles Roger; Dod, Robert Phipps (1855). The Parliamentary Companion, 1855. London: Whittaker & Co. p. 154. Retrieved 14 May 2018.
  16. "Hertford Election" . Exeter and Plymouth Gazette. 10 July 1852. pp. 4, 7. Retrieved 14 May 2018 via British Newspaper Archive.
  17. "The Borough Election" . Herts Guardian, Agricultural Journal, and General Advertiser. 10 July 1852. p. 2. Retrieved 14 May 2018 via British Newspaper Archive.
  18. 1 2 3 4 5 6 7 8 9 10 11 12 13 14 15 16 17 18 19 20 21 Craig, F. W. S., ed. (1977). British Parliamentary Election Results 1832-1885 (e-book) (1st ed.). London: Macmillan Press. ISBN   978-1-349-02349-3.
  19. "Hertford Borough Election" . Hertford Mercury and Reformer. 10 July 1852. p. 2. Retrieved 14 May 2018 via British Newspaper Archive.
  20. "Hertford Election" . Hertford Mercury and Reformer. 14 November 1868. p. 1. Retrieved 18 February 2018 via British Newspaper Archive.
  21. "Hertford" . The Scotsman . 20 March 1880. p. 12. Retrieved 29 November 2017 via British Newspaper Archive.
  22. 1 2 3 4 5 6 7 The Liberal Year Book, 1907
  23. 1 2 3 4 5 6 7 8 Craig, FWS, ed. (1974). British Parliamentary Election Results: 1885-1918. London: Macmillan Press. ISBN   9781349022984.
  24. 1 2 3 Debrett's House of Commons & Judicial Bench, 1918
  25. 1 2 3 4 5 6 7 8 British Parliamentary Election Results 1918-1949, F W S Craig
  26. British Parliamentary Election Results 1918-1949, FWS Craig
  27. Report of the Annual Conference of the Labour Party, 1939
  28. 1 2 3 4 5 6 7 British Parliamentary Election Results 1950-1973, F W S Craig
  29. Kimber, Richard. "UK General Election results February 1950". Political Science Resources. Retrieved 11 April 2016.
  30. Kimber, Richard. "UK General Election results 1951". Political Science Resources. Retrieved 11 April 2016.
  31. The Times' Guide to the House of Commons. 1951.
  32. Kimber, Richard. "UK General Election results 1955". Political Science Resources. Retrieved 11 April 2016.
  33. Kimber, Richard. "UK General Election results 1959". Political Science Resources. Retrieved 11 April 2016.
  34. Kimber, Richard. "UK General Election results 1964". Political Science Resources. Archived from the original on 4 March 2016. Retrieved 11 April 2016.
  35. Kimber, Richard. "UK General Election results 1966". Political Science Resources. Retrieved 11 April 2016.
  36. Kimber, Richard. "UK General Election results 1970". Political Science Resources. Retrieved 11 April 2016.