Related Research Articles
The New York Stock Exchange is an American stock exchange in the Financial District of Lower Manhattan in New York City. It is the largest stock exchange in the world by market capitalization.

A stock market, equity market, or share market is the aggregation of buyers and sellers of stocks, which represent ownership claims on businesses; these may include securities listed on a public stock exchange, as well as stock that is only traded privately, such as shares of private companies which are sold to investors through equity crowdfunding platforms. Investment is usually made with an investment strategy in mind.

A stock market crash is a sudden dramatic decline of stock prices across a major cross-section of a stock market, resulting in a significant loss of paper wealth. Crashes are driven by panic selling and underlying economic factors. They often follow speculation and economic bubbles.
A market trend is a perceived tendency of financial markets to move in a particular direction over time. Analysts classify these trends as secular for long time-frames, primary for medium time-frames, and secondary for short time-frames. Traders attempt to identify market trends using technical analysis, a framework which characterizes market trends as predictable price tendencies within the market when price reaches support and resistance levels, varying over time.
Bloomberg Wall Street Week (WSW), is an investment news and information TV program airing Friday nights on the Bloomberg Television. The original weekly show hosted by Louis Rukeyser aired each Friday evening on PBS in the United States from November 20, 1970, to 2005. The program features a host and guest experts participating in discussions related to the financial markets.
In finance, technical analysis is an analysis methodology for analysing and forecasting the direction of prices through the study of past market data, primarily price and volume. As a type of active management, it stands in contradiction to much of modern portfolio theory. The efficacy of technical analysis is disputed by the efficient-market hypothesis, which states that stock market prices are essentially unpredictable, and research on whether technical analysis offers any benefit has produced mixed results.
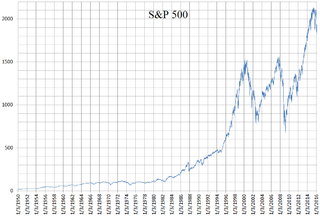
The Standard and Poor's 500, or simply the S&P 500, is a stock market index tracking the stock performance of 500 of the largest companies listed on stock exchanges in the United States. It is one of the most commonly followed equity indices. As of December 31, 2020, more than $5.4 trillion was invested in assets tied to the performance of the index.

Black Monday was the global, severe and largely unexpected stock market crash on Monday, October 19, 1987. All of the twenty-three major world markets experienced a sharp decline in October 1987. When measured in United States dollars, eight markets declined by 20 to 29 percent, three by 30 to 39 percent, and three by more than 40 percent. The least affected was Austria while the most affected was Hong Kong with a drop of 45.8 percent. Out of twenty-three major industrial countries, nineteen had a decline greater than 20 percent. Worldwide losses were estimated at US$1.71 trillion. The severity of the crash sparked fears of extended economic instability or even a reprise of the Great Depression.
An exchange-traded fund (ETF) is a type of investment fund and exchange-traded product, i.e. they are traded on stock exchanges. ETFs are similar in many ways to mutual funds, except that ETFs are bought and sold from other owners throughout the day on stock exchanges, whereas mutual funds are bought and sold from the issuer based on their price at day's end.
The relative strength index (RSI) is a technical indicator used in the analysis of financial markets. It is intended to chart the current and historical strength or weakness of a stock or market based on the closing prices of a recent trading period. The indicator should not be confused with relative strength.
Algorithmic trading is a method of executing orders using automated pre-programmed trading instructions accounting for variables such as time, price, and volume. This type of trading attempts to leverage the speed and computational resources of computers relative to human traders. In the twenty-first century, algorithmic trading has been gaining traction with both retail and institutional traders. It is widely used by investment banks, pension funds, mutual funds, and hedge funds that may need to spread out the execution of a larger order or perform trades too fast for human traders to react to. A study in 2019 showed that around 92% of trading in the Forex market was performed by trading algorithms rather than humans.
A trading curb is a financial regulatory instrument that is in place to prevent stock market crashes from occurring, and is implemented by the relevant stock exchange organization. Since their inception, circuit breakers have been modified to prevent both speculative gains and dramatic losses within a small time frame. When triggered, circuit breakers either stop trading for a small amount of time or close trading early in order to allow accurate information to flow among market makers and for institutional traders to assess their positions and make rational decisions.
The Negative Volume Index and Positive Volume Index indicators are indicators to identify primary market trends and reversals.
The McClellan oscillator is a market breadth indicator used in technical analysis by financial analysts of the New York Stock Exchange to evaluate the balance between the advancing and declining stocks. The McClellan oscillator is based on the Advance-Decline Data and it could be applied to stock market exchanges, indexes, portfolio of stocks or any basket of stocks.
See Business Cycle.
The average directional movement index (ADX) was developed in 1978 by J. Welles Wilder as an indicator of trend strength in a series of prices of a financial instrument. ADX has become a widely used indicator for technical analysts, and is provided as a standard in collections of indicators offered by various trading platforms.
The Vortex Indicator is a technical indicator invented by Etienne Botes and Douglas Siepman to identify the start of a new trend or the continuation of an existing trend within financial markets. It was published in the January 2010 edition of Technical Analysis of Stocks & Commodities.

The May 6, 2010, flash crash, also known as the crash of 2:45 or simply the flash crash, was a United States trillion-dollar flash crash which started at 2:32 p.m. EDT and lasted for approximately 36 minutes.
Chaikin Analytics is a platform for stock trading ideas. It was founded in 2011 by Marc Chaikin. The centerpiece of Chaikin Analytics is the Chaikin Power Gauge stock rating. In 2016, it was named one of "Two Top Websites for Quantitative Analysis" by Barron's (newspaper).
Jason Goepfert is an American researcher and columnist focused on the development of behavioral finance. Prior to founding Sundial Capital Research, he was the manager of back office operations for Deephaven Capital Management, a Minnesota-based hedge fund, and Wells Fargo's online brokerage unit.
References
- ↑ Russolillo, Steven (August 23, 2010). "Yes Folks, Hindenburg Omen Tripped Again". The Wall Street Journal.
- ↑ Fosback, Norman (1979). "20". Stock Market Logic . ISBN 0-917604-48-2.
- ↑ Morris, Gregory (2005). The Complete Guide to Market Breadth Indicators: How to Analyze and Evaluate Market Direction and Strength, p. 219. McGraw-Hill. ISBN 0-07-144443-2.
- ↑ Investopedia Hindenburg Omen entry