Related Research Articles
The discounted cash flow (DCF) analysis, in financial analysis, is a method used to value a security, project, company, or asset, that incorporates the time value of money. Discounted cash flow analysis is widely used in investment finance, real estate development, corporate financial management, and patent valuation. Used in industry as early as the 1700s or 1800s, it was widely discussed in financial economics in the 1960s, and U.S. courts began employing the concept in the 1980s and 1990s.
Monte Carlo methods, or Monte Carlo experiments, are a broad class of computational algorithms that rely on repeated random sampling to obtain numerical results. The underlying concept is to use randomness to solve problems that might be deterministic in principle. The name comes from the Monte Carlo Casino in Monaco, where the primary developer of the method, mathematician Stanisław Ulam, was inspired by his uncle's gambling habits.
Financial economics is the branch of economics characterized by a "concentration on monetary activities", in which "money of one type or another is likely to appear on both sides of a trade". Its concern is thus the interrelation of financial variables, such as share prices, interest rates and exchange rates, as opposed to those concerning the real economy. It has two main areas of focus: asset pricing and corporate finance; the first being the perspective of providers of capital, i.e. investors, and the second of users of capital. It thus provides the theoretical underpinning for much of finance.

Value at risk (VaR) is a measure of the risk of loss of investment/capital. It estimates how much a set of investments might lose, given normal market conditions, in a set time period such as a day. VaR is typically used by firms and regulators in the financial industry to gauge the amount of assets needed to cover possible losses.
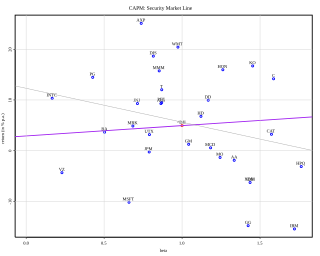
In finance, the capital asset pricing model (CAPM) is a model used to determine a theoretically appropriate required rate of return of an asset, to make decisions about adding assets to a well-diversified portfolio.
In finance, the binomial options pricing model (BOPM) provides a generalizable numerical method for the valuation of options. Essentially, the model uses a "discrete-time" model of the varying price over time of the underlying financial instrument, addressing cases where the closed-form Black–Scholes formula is wanting.
Market risk is the risk of losses in positions arising from movements in market variables like prices and volatility. There is no unique classification as each classification may refer to different aspects of market risk. Nevertheless, the most commonly used types of market risk are:
Importance sampling is a Monte Carlo method for evaluating properties of a particular distribution, while only having samples generated from a different distribution than the distribution of interest. Its introduction in statistics is generally attributed to a paper by Teun Kloek and Herman K. van Dijk in 1978, but its precursors can be found in statistical physics as early as 1949. Importance sampling is also related to umbrella sampling in computational physics. Depending on the application, the term may refer to the process of sampling from this alternative distribution, the process of inference, or both.
In finance, the beta is a statistic that measures the expected increase or decrease of an individual stock price in proportion to movements of the stock market as a whole. Beta can be used to indicate the contribution of an individual asset to the market risk of a portfolio when it is added in small quantity. It refers to an asset's non-diversifiable risk, systematic risk, or market risk. Beta is not a measure of idiosyncratic risk.
Monte Carlo methods are used in corporate finance and mathematical finance to value and analyze (complex) instruments, portfolios and investments by simulating the various sources of uncertainty affecting their value, and then determining the distribution of their value over the range of resultant outcomes. This is usually done by help of stochastic asset models. The advantage of Monte Carlo methods over other techniques increases as the dimensions of the problem increase.
In mathematical finance, a Monte Carlo option model uses Monte Carlo methods to calculate the value of an option with multiple sources of uncertainty or with complicated features. The first application to option pricing was by Phelim Boyle in 1977. In 1996, M. Broadie and P. Glasserman showed how to price Asian options by Monte Carlo. An important development was the introduction in 1996 by Carriere of Monte Carlo methods for options with early exercise features.
In statistics, resampling is the creation of new samples based on one observed sample. Resampling methods are:
- Permutation tests
- Bootstrapping
- Cross validation
- Jackknife
Monte Carlo localization (MCL), also known as particle filter localization, is an algorithm for robots to localize using a particle filter. Given a map of the environment, the algorithm estimates the position and orientation of a robot as it moves and senses the environment. The algorithm uses a particle filter to represent the distribution of likely states, with each particle representing a possible state, i.e., a hypothesis of where the robot is. The algorithm typically starts with a uniform random distribution of particles over the configuration space, meaning the robot has no information about where it is and assumes it is equally likely to be at any point in space. Whenever the robot moves, it shifts the particles to predict its new state after the movement. Whenever the robot senses something, the particles are resampled based on recursive Bayesian estimation, i.e., how well the actual sensed data correlate with the predicted state. Ultimately, the particles should converge towards the actual position of the robot.
The following outline is provided as an overview of and topical guide to finance:
The RiskMetrics variance model was first established in 1989, when Sir Dennis Weatherstone, the new chairman of J.P. Morgan, asked for a daily report measuring and explaining the risks of his firm. Nearly four years later in 1992, J.P. Morgan launched the RiskMetrics methodology to the marketplace, making the substantive research and analysis that satisfied Sir Dennis Weatherstone's request freely available to all market participants.
Asset/liability modeling is the process used to manage the business and financial objectives of a financial institution or an individual through an assessment of the portfolio assets and liabilities in an integrated manner. The process is characterized by an ongoing review, modification and revision of asset and liability management strategies so that sensitivity to interest rate changes are confined within acceptable tolerance levels.

Portfolio optimization is the process of selecting an optimal portfolio, out of a set of considered portfolios, according to some objective. The objective typically maximizes factors such as expected return, and minimizes costs like financial risk, resulting in a multi-objective optimization problem. Factors being considered may range from tangible to intangible.
Quantitative analysis is the use of mathematical and statistical methods in finance and investment management. Those working in the field are quantitative analysts (quants). Quants tend to specialize in specific areas which may include derivative structuring or pricing, risk management, investment management and other related finance occupations. The occupation is similar to those in industrial mathematics in other industries. The process usually consists of searching vast databases for patterns, such as correlations among liquid assets or price-movement patterns.
Mathematical finance, also known as quantitative finance and financial mathematics, is a field of applied mathematics, concerned with mathematical modeling in the financial field.
Returns-based style analysis (RBSA) is a statistical technique used in finance to deconstruct the returns of investment strategies using a variety of explanatory variables. The model results in a strategy's exposures to asset classes or other factors, interpreted as a measure of a fund or portfolio manager's investment style. While the model is most frequently used to show an equity mutual fund’s style with reference to common style axes, recent applications have extended the model’s utility to model more complex strategies, such as those employed by hedge funds.
References
- ↑ Giovanni Barone-Adesi and Kostas Giannopoulos (1996), A simplified approach to the conditional estimation of Values-at-Risk
- ↑ Giovanni Barone-Adesi, Kostas Giannopoulos & Les Vosper (1999), VaR without correlations for portfolios of derivative securities
- ↑ Boudoukh, J.; Richardson, M.; Whitelaw, R. (1998). "The Best of Both Worlds" (PDF). Risk. 11: 64–67.