Isoelastic utility

Last updated
Isoelastic utility for different values of
e
.
{\displaystyle \eta .}
When
e
>
1
{\displaystyle \eta >1}
the curve approaches the horizontal axis asymptotically from below with no lower bound. Isoelastic.svg
Isoelastic utility for different values of When the curve approaches the horizontal axis asymptotically from below with no lower bound.

In economics, the isoelastic function for utility, also known as the isoelastic utility function, or power utility function, is used to express utility in terms of consumption or some other economic variable that a decision-maker is concerned with. The isoelastic utility function is a special case of hyperbolic absolute risk aversion and at the same time is the only class of utility functions with constant relative risk aversion, which is why it is also called the CRRA utility function. In statistics, the same function is called the Box-Cox transformation.

Contents

It is

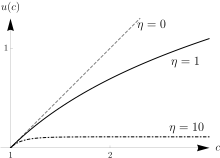
where is consumption, the associated utility, and is a constant that is positive for risk averse agents. [1] Since additive constant terms in objective functions do not affect optimal decisions, the –1 is sometimes omitted in the numerator (although it should be kept if one wishes to preserve mathematical consistency with the limiting case of ; see Special cases below). Since the family contains both power functions and the logarithmic function, it is sometimes called power-log utility. [2]

When the context involves risk, the utility function is viewed as a von Neumann–Morgenstern utility function, and the parameter is the degree of relative risk aversion.

The isoelastic utility function is a special case of the hyperbolic absolute risk aversion (HARA) utility functions, and is used in analyses that either include or do not include underlying risk.

Empirical value

There is substantial debate in the economics and finance literature with respect to the true value of . While extremely high values of (of up to 50 in some models) [3] are needed to explain the behavior of asset prices, most experiments document behavior that is more consistent with values of only slightly greater than 1. For example, Groom and Maddison (2019) estimated the value of to be 1.5 in the United Kingdom, [4] while Evans (2005) estimated its value to be around 1.4 in 20 OECD countries. [5]

Risk aversion features

This utility function has the feature of constant relative risk aversion. Mathematically this means that is a constant, specifically . In theoretical models this often has the implication that decision-making is unaffected by scale. For instance, in the standard model of one risk-free asset and one risky asset, under constant relative risk aversion the fraction of wealth optimally placed in the risky asset is independent of the level of initial wealth. [6] [7]

Special cases

which justifies the convention of using the limiting value u(c) = ln c when .

See also

Related Research Articles

In economics, utility is a measure of the satisfaction that a certain person has from a certain state of the world. Over time, the term has been used in two different meanings.

<span class="mw-page-title-main">Risk aversion</span> Economics theory

In economics and finance, risk aversion is the tendency of people to prefer outcomes with low uncertainty to those outcomes with high uncertainty, even if the average outcome of the latter is equal to or higher in monetary value than the more certain outcome.

In welfare economics and social choice theory, a social welfare function—also called a socialordering, ranking, utility, or choicefunction—is a function that ranks a set of social states by their desirability. A social welfare function takes two possible outcomes, then combines every person's preferences to determine which outcome is considered better by society as a whole. Inputs to the function can include any variables that affect the well-being of a society.

<span class="mw-page-title-main">Risk premium</span> Measure of excess

A risk premium is a measure of excess return that is required by an individual to compensate being subjected to an increased level of risk. It is used widely in finance and economics, the general definition being the expected risky return less the risk-free return, as demonstrated by the formula below.

The expected utility hypothesis is a foundational assumption in mathematical economics concerning decision making under uncertainty. It postulates that rational agents maximize utility, meaning the subjective desirability of their actions. Rational choice theory, a cornerstone of microeconomics, builds this postulate to model aggregate social behaviour.

The equity premium puzzle refers to the inability of an important class of economic models to explain the average equity risk premium (ERP) provided by a diversified portfolio of equities over that of government bonds, which has been observed for more than 100 years. There is a significant disparity between returns produced by stocks compared to returns produced by government treasury bills. The equity premium puzzle addresses the difficulty in understanding and explaining this disparity. This disparity is calculated using the equity risk premium:

Constant elasticity of substitution (CES), in economics, is a property of some production functions and utility functions. Several economists have featured in the topic and have contributed in the final finding of the constant. They include Tom McKenzie, John Hicks and Joan Robinson. The vital economic element of the measure is that it provided the producer a clear picture of how to move between different modes or types of production.

The Ramsey–Cass–Koopmans model, or Ramsey growth model, is a neoclassical model of economic growth based primarily on the work of Frank P. Ramsey, with significant extensions by David Cass and Tjalling Koopmans. The Ramsey–Cass–Koopmans model differs from the Solow–Swan model in that the choice of consumption is explicitly microfounded at a point in time and so endogenizes the savings rate. As a result, unlike in the Solow–Swan model, the saving rate may not be constant along the transition to the long run steady state. Another implication of the model is that the outcome is Pareto optimal or Pareto efficient.

Elasticity of substitution is the ratio of percentage change in capital-labour ratio with the percentage change in Marginal Rate of Technical Substitution. In a competitive market, it measures the percentage change in the two inputs used in response to a percentage change in their prices. It gives a measure of the curvature of an isoquant, and thus, the substitutability between inputs, i.e. how easy it is to substitute one input for the other.

<span class="mw-page-title-main">Cumulative prospect theory</span>

Cumulative prospect theory (CPT) is a model for descriptive decisions under risk and uncertainty which was introduced by Amos Tversky and Daniel Kahneman in 1992. It is a further development and variant of prospect theory. The difference between this version and the original version of prospect theory is that weighting is applied to the cumulative probability distribution function, as in rank-dependent expected utility theory but not applied to the probabilities of individual outcomes. In 2002, Daniel Kahneman received the Bank of Sweden Prize in Economic Sciences in Memory of Alfred Nobel for his contributions to behavioral economics, in particular the development of Cumulative Prospect Theory (CPT).

In economics, Epstein–Zin preferences refers to a specification of recursive utility.

<span class="mw-page-title-main">Exponential utility</span>

In economics and finance, exponential utility is a specific form of the utility function, used in some contexts because of its convenience when risk is present, in which case expected utility is maximized. Formally, exponential utility is given by:

<span class="mw-page-title-main">Proper velocity</span> Ratio in relativity

In relativity, proper velocityw of an object relative to an observer is the ratio between observer-measured displacement vector and proper time τ elapsed on the clocks of the traveling object:

In economics, elasticity of intertemporal substitution is a measure of responsiveness of the growth rate of consumption to the real interest rate. If the real interest rate rises, current consumption may decrease due to increased return on savings; but current consumption may also increase as the household decides to consume more immediately, as it is feeling richer. The net effect on current consumption is the elasticity of intertemporal substitution.

In macroeconomics, the cost of business cycles is the decrease in social welfare, if any, caused by business cycle fluctuations.

In consumer theory, a consumer's preferences are called homothetic if they can be represented by a utility function which is homogeneous of degree 1. For example, in an economy with two goods , homothetic preferences can be represented by a utility function that has the following property: for every :

In finance, economics, and decision theory, hyperbolic absolute risk aversion (HARA) refers to a type of risk aversion that is particularly convenient to model mathematically and to obtain empirical predictions from. It refers specifically to a property of von Neumann–Morgenstern utility functions, which are typically functions of final wealth, and which describe a decision-maker's degree of satisfaction with the outcome for wealth. The final outcome for wealth is affected both by random variables and by decisions. Decision-makers are assumed to make their decisions so as to maximize the expected value of the utility function.

In mathematical economics, an isoelastic function, sometimes constant elasticity function, is a function that exhibits a constant elasticity, i.e. has a constant elasticity coefficient. The elasticity is the ratio of the percentage change in the dependent variable to the percentage causative change in the independent variable, in the limit as the changes approach zero in magnitude.

A borrowing limit is the amount of money that individuals could borrow from other individuals, firms, banks or governments. There are many types of borrowing limits, and a natural borrowing limit is one specific type of borrowing limit among those. When individuals are said to face the natural borrowing limit, it implies they are allowed to borrow up to the sum of all their future incomes. A natural debt limit and a natural borrowing constraint are other ways to refer to the natural borrowing limit.

Intertemporal portfolio choice is the process of allocating one's investable wealth to various assets, especially financial assets, repeatedly over time, in such a way as to optimize some criterion. The set of asset proportions at any time defines a portfolio. Since the returns on almost all assets are not fully predictable, the criterion has to take financial risk into account. Typically the criterion is the expected value of some concave function of the value of the portfolio after a certain number of time periods—that is, the expected utility of final wealth. Alternatively, it may be a function of the various levels of goods and services consumption that are attained by withdrawing some funds from the portfolio after each time period.

References

  1. Ljungqvist, Lars; Sargent, Thomas J. (2000). Recursive Macroeconomic Theory. London: MIT Press. p. 451. ISBN   978-0262194518.
  2. Kale, Jivendra K. (2009). "Growth maximisation and downside protection using power-log utility functions for optimising portfolios with derivatives" . International Journal of Computer Applications in Technology. 34 (4): 309. doi:10.1504/IJCAT.2009.024085. ISSN   0952-8091.
  3. Mehra, Rajnish; Prescott, Edward (1985). "The Equity Premium Puzzle". Journal of Monetary Economics. 15: 145–161.
  4. Groom, Ben; Maddison, David (2019). "New Estimates of the Elasticity of Marginal Utility for the UK" (PDF). Environmental and Resource Economics. 72 (4): 1155–1182. doi: 10.1007/s10640-018-0242-z . S2CID   254474366.
  5. Evans, David (2005). "The Elasticity of Marginal Utility of Consumption: Estimates for 20 OECD Countries" . Fiscal Studies. 26 (2): 197–224. doi:10.1111/j.1475-5890.2005.00010.x. JSTOR   24440019 . Retrieved 2021-01-01.
  6. Arrow, K. J. (1965). "The theory of risk aversion". Aspects of the Theory of Risk Bearing. Helsinki: Yrjo Jahnssonin Saatio. Reprinted in: Essays in the Theory of Risk Bearing. Chicago: Markham. 1971. pp. 90–109. ISBN   978-0841020016.
  7. Pratt, J. W. (1964). "Risk aversion in the small and in the large". Econometrica . 32 (1–2): 122–136. doi:10.2307/1913738. JSTOR   1913738.