Quality function deployment (QFD) is a method developed in Japan beginning in 1966 to help transform the voice of the customer into engineering characteristics for a product. Yoji Akao, the original developer, described QFD as a "method to transform qualitative user demands into quantitative parameters, to deploy the functions forming quality, and to deploy methods for achieving the design quality into subsystems and component parts, and ultimately to specific elements of the manufacturing process." The author combined his work in quality assurance and quality control points with function deployment used in value engineering.

Job satisfaction, employee satisfaction or work satisfaction is a measure of workers' contentment with their job, whether they like the job or individual aspects or facets of jobs, such as nature of work or supervision. Job satisfaction can be measured in cognitive (evaluative), affective, and behavioral components. Researchers have also noted that job satisfaction measures vary in the extent to which they measure feelings about the job. or cognitions about the job.
Design for Six Sigma (DFSS) is a collection of best-practices for the development of new products and processes. It is sometimes deployed as an engineering design process or business process management method. DFSS originated at General Electric to build on the success they had with traditional Six Sigma; but instead of process improvement, DFSS was made to target new product development. It is used in many industries, like finance, marketing, basic engineering, process industries, waste management, and electronics. It is based on the use of statistical tools like linear regression and enables empirical research similar to that performed in other fields, such as social science. While the tools and order used in Six Sigma require a process to be in place and functioning, DFSS has the objective of determining the needs of customers and the business, and driving those needs into the product solution so created. It is used for product or process design in contrast with process improvement. Measurement is the most important part of most Six Sigma or DFSS tools, but whereas in Six Sigma measurements are made from an existing process, DFSS focuses on gaining a deep insight into customer needs and using these to inform every design decision and trade-off.
The loyalty business model is a business model used in strategic management in which a company's resources are employed so as to increase the loyalty of customers and other stakeholders in the expectation that corporate objectives will be met or surpassed. A typical example of this type of model is where quality of product or service leads to customer satisfaction, which leads to customer loyalty, which leads to profitability.
Kansei engineering aims at the development or improvement of products and services by translating the customer's psychological feelings and needs into the domain of product design. It was founded by Mitsuo Nagamachi, professor emeritus of Hiroshima University. Kansei engineering parametrically links the customer's emotional responses to the properties and characteristics of a product or service. In consequence, products can be designed to bring forward the intended feeling.
Quality management ensures that an organization, product or service consistently functions well. It has four main components: quality planning, quality assurance, quality control, and quality improvement. Quality management is focused both on product and service quality and the means to achieve it. Quality management, therefore, uses quality assurance and control of processes as well as products to achieve more consistent quality. Quality control is also part of quality management. What a customer wants and is willing to pay for it, determines quality. It is a written or unwritten commitment to a known or unknown consumer in the market. Quality can be defined as how well the product performs its intended function.
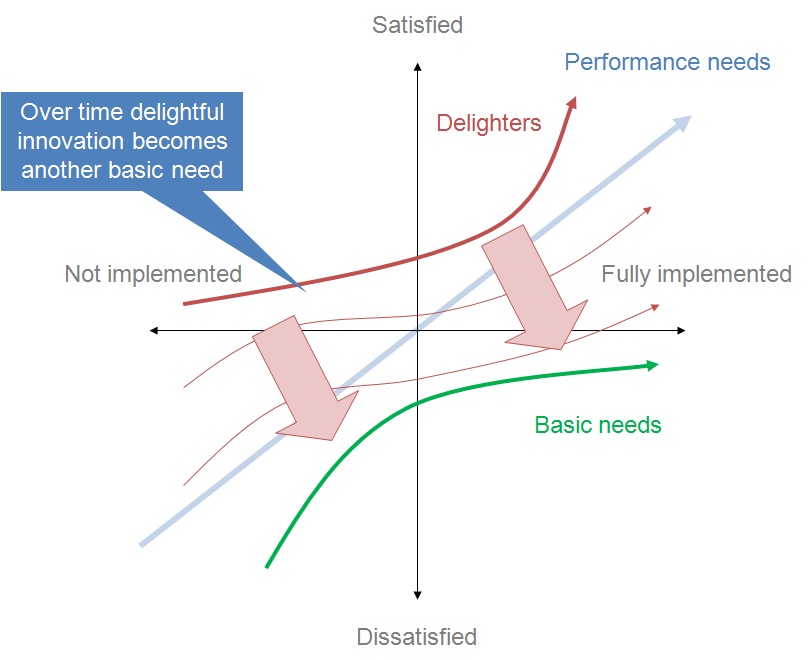
Noriaki Kano is a Japanese educator, lecturer, writer, and consultant in the field of quality management. He is the developer of a customer satisfaction model whose simple ranking scheme distinguishes between essential and differentiating attributes related to concepts of customer quality. He is a professor emeritus of the Tokyo University of Science. He was Visiting Professor at the University of Rome III during the academic year 2010-2011.
SERVQUAL is a multi-dimensional research instrument designed to capture consumer expectations and perceptions of a service along five dimensions which are said to represent service quality. SERVQUAL is built on the expectancy–disconfirmation paradigm, which, in simple terms, means that service quality is understood as the extent to which consumers' pre-consumption expectations of quality are confirmed or disconfirmed by their actual perceptions of the service experience. The SERVQUAL questionnaire was first published in 1985 by a team of academic researchers in the United States, A. Parasuraman, Valarie Zeithaml and Leonard L. Berry, to measure quality in the service sector.
Customer satisfaction is a term frequently used in marketing to evaluate customer experience. It is a measure of how products and services supplied by a company meet or surpass customer expectation. Customer satisfaction is defined as "the number of customers, or percentage of total customers, whose reported experience with a firm, its products, or its services (ratings) exceeds specified satisfaction goals." Enhancing customer satisfaction and fostering customer loyalty are pivotal for businesses, given the significant importance of improving the balance between customer attitudes before and after the consumption process.
Computer user satisfaction is the attitude of a user to the computer system they employ in the context of their work environments. Doll and Torkzadeh's (1988) definition of user satisfaction is, the opinion of the user about a specific computer application, which they use. In a broader sense, the definition of user satisfaction can be extended to user satisfaction with any computer-based electronic appliance. However, scholars distinguish between user satisfaction and usability as part of Human-Computer Interaction. Successful organisations have systems in place which they believe help maximise profits and minimise overheads. It is therefore desirable that all their systems succeed and remain successful; and this includes their computer-based systems. According to key scholars such as DeLone and McLean (2002), user satisfaction is a key measure of computer system success, if not synonymous with it. However, the development of techniques for defining and measuring user satisfaction have been ad hoc and open to question. The term Computer User Satisfaction is abbreviated to user satisfaction in this article.
In marketing and quality management, the voice of the customer (VOC) summarizes customers' expectations, preferences and aversions.
The following outline is provided as an overview of and topical guide to marketing:
In business, engineering, and manufacturing, quality – or high quality – has a pragmatic interpretation as the non-inferiority or superiority of something ; it is also defined as being suitable for the intended purpose while satisfying customer expectations. Quality is a perceptual, conditional, and somewhat subjective attribute and may be understood differently by different people. Consumers may focus on the specification quality of a product/service, or how it compares to competitors in the marketplace. Producers might measure the conformance quality, or degree to which the product/service was produced correctly. Support personnel may measure quality in the degree that a product is reliable, maintainable, or sustainable. In such ways, the subjectivity of quality is rendered objective via operational definitions and measured with metrics such as proxy measures.
Customer experience, sometimes abbreviated to CX, is the totality of cognitive, affective, sensory, and behavioral customer responses during all stages of the consumption process including pre-purchase, consumption, and post-purchase stages.
The service recovery paradox (SRP) is a situation in which a customer thinks more highly of a company after the company has corrected a problem with their service, compared to how they would regard the company if non-faulty service had been provided. The main reason behind this thinking is that successful recovery of a faulty service increases the assurance and confidence from the customer.
Service quality (SQ), in its contemporary conceptualisation, is a comparison of perceived expectations (E) of a service with perceived performance (P), giving rise to the equation SQ = P − E. This conceptualistion of service quality has its origins in the expectancy-disconfirmation paradigm.
In United States healthcare, service excellence is the ability of the provider to consistently meet and manage patient expectations. Clinical excellence must be the priority for any health care system. However, the best healthcare systems combine professional (clinical) service excellence with outstanding personal service. Although health care in the United States is touted as the “world’s largest service industry,” the quality of the service is infrequently discussed in medical literature. Thus, many questions regarding service excellence in healthcare largely remain unanswered.
Patient satisfaction is a measure of the extent to which a patient is content with the health care which they received from their health care provider.
Operations management for services has the functional responsibility for producing the services of an organization and providing them directly to its customers. It specifically deals with decisions required by operations managers for simultaneous production and consumption of an intangible product. These decisions concern the process, people, information and the system that produces and delivers the service. It differs from operations management in general, since the processes of service organizations differ from those of manufacturing organizations.
SIMALTO – SImultaneous Multi-Attribute Trade Off – is a survey based statistical technique used in market research that helps determine how people prioritise and value alternative product and/or service options of the attributes that make up individual products or services.