Landfill gas emission reduction in Brazil

Last updated

Brazil has established a strong public policy using Clean Development Mechanism Projects to reduce methane emissions from landfills. An important component of these projects is the sale of avoided emissions by the private market to generate revenue.

Contents

Introduction

Faced with serious pollution challenges, Brazil established public policy that would create incentives for the foreign and national private market to invest financial, technological, and human resources in the country. The premise is that experienced companies would bring their technology to Brazil, in an effort to reduce methane gas emissions. The specific technology and projects discussed in this article refer to landfill gas projects. Although this technology was new to Brazil in the early 2000s when companies first began implementing them, these methods were not new to Europe or North America. Additionally, Brazil is just one of many countries participating in similar projects around the world.

Background

Brazil signed the Kyoto Protocol on April 29, 1998, and ratified it on August 23, 2002. [1] [2] To date, Brazil has 347 clean development mechanism (CDM) projects, which account for 7.3% of the total projects worldwide. [3] Estimated projections by the United Nations Environment Programme (UNEP) show that by 2012, Brazil will have 102 million certified emission reductions (CER), a $1,225 million value. Unlike its fellow BRIC countries, in Brazil the largest component of potential CER projects is landfill gas projects, with a 31.3% share. [3] According to the national survey on basic sanitation (PNSB) conducted in 2008, all of the 5,564 municipalities have access to basic sanitation. [4] According to the Environmental Sanitation Technology Company (CETESB) study, the 6,000 waste sites in Brazil receive 60,000 tonnes of waste per day. Seventy-six percent (76%) of this waste goes to dumps with no management, gas collection, or water treatment. This same study showed that 83.18% of Brazil's methane gas emissions come from uncontrolled waste sites. [5]

Landfill gas projects

Private companies have submitted CDM projects to the United Nations Framework Convention on Climate Change (UNFCCC) to use landfill gas (LFG) discharges from waste management sites to earn carbon credits or CER. There are over 100 LFG CDM projects in Brazil. [3] The diagram below illustrates the process. [6]

Carbon Credit Flow Chart.png

First, once the waste management company has developed the landfill with the new technology, (1a) it calculates how much methane (CH4) would have been emitted into the air without its intervention. (1b) Then it converts the CH4 into carbon equivalents (C02e). (2a) Next, the company projects how much methane it expects to emit into the air, with the new technology. Again, (2b) it converts the CH4 into C02e. (3) Next, the company determines the avoided emissions or CER but subtracting the emission projections with the technology from the baseline emissions without the technology. (4) Once credited, the company sells the CER through a broker to companies that will produce emissions greater than their allotted capacity.

SASA

The SASA [7] landfill is located in Tremembé in São Paulo State of Brazil. Onyx SASA is a subsidiary of Veolia Environnement and is an officially registered project with UNFCCC, as of November 24, 2005. SenterNovem, an agency of the Dutch Ministry of Economic Affairs in the Netherlands, is a partner in the project. The following flow chart depicts the process used by the landfill:

Landfill Gas Clean Development Mechanism Monitoring System.png


(1) Methane (CH4) or carbon equivalents (CO2e) are captured by the vertical wells. (2) Next, a horizontal drain that is connected to the vertical wells extracts the CO2e. (3) Then, a high density collection pipe captures the CO2e and transfers it to the evaporator. (4) Any CO2e that did not evaporate, is transferred to an enclosed flare. (5) The remaining emissions are then vented into the air.

At the filing of the report, Onyx SASA anticipated the landfill would accrue 700,625 tons CO2e from 2003 through 2012 in CER. As of 2011, Onyx SASA has filed monitoring reports for the periods of 2003 through 2007. The following chart outlines the actual CER realized to date:

YearBaseline CO2e
Emissions
CO2e Emissions with
CDM Technology
Projected CERActual CER
200357,09320,43336,66121,954
200471,35026,08345,26730,656
200585,14737,38347,76440,988
200698,02436,61758,40746,030
2007109,71938,56671,15342,320
2008120,36249,93270,430TBD
2009129,88939,55190,338TBD
2010138,23348,15890,075TBD
2011145,39457,94787,447TBD
2012149,73046,647103,083TBD
Total1,104,943404,318700,625181,948 (2003–2007)


Additionally, the project design report states Onyx SASA expects to revegetate and reforest the land; upon fulfillment, 150,000 trees will be planted around the landfill.

Paulínia

Diorama of ESTRE's Paulinia Landfill, a Clean Development Mechanism Project. Paulinia Landfill Gas Model.jpg
Diorama of ESTRE's Paulínia Landfill, a Clean Development Mechanism Project.

Empresa de Saneamento e Tratamento de Resíduos (ESTRE) [8] is a private waste management Brazilian-based company, founded in 1999. ESTRE operates seven sites in Brazil, Uruguay, and Argentina. It offers waste management services, including recycling and landfills, to private companies and the government. [9] The Paulínia Landfill Gas Project (EPLGP) is located in Campinas in São Paulo State of Brazil. The project was registered on March 3, 2006, with UNFCCC.


The goal of the EPLGP is to reduce greenhouse emissions. The following schematic illustrates the process of capturing and recycling the gas emissions:

Active Gas Recovery Landfill.png


As illustrated above, (1) wells installed in the landfill collect the methane (CH4). (2) Next, high density pipes connected to the wells transfer the CH4 to the blower. (3) Any remaining CH4 is then sent to the flare. (4) Last, the CH4 is flared into the air.

The following table outlines the forecasted and actual yearly outputs of CER according to the monitoring reports filed with UNFCCC:

TimeframeProjected CERActual CER
9/14/2006 - 1/31/200767,17956,376
2/1/2007 - 7/31/200796,26881,862
8/1/2007 - 2/29/2008116,745112,938
3/1/2008 - 8/31/200891,873104,918
2/1/2009 - 6/30/200996,549112,950
7/1/2009 - 2/25/2010157,089177,545
2/26/2010 - 7/31/201070,832187,909^
8/1/2010 - 10/31/201063,505118,860^
11/1/2010 - 1/31/201161,077119,056^
2/1/2011 - 12/31/2011204,397TBD
2012198,019TBD
Total1,487,9081,188,640 (9/14/2006 - 1/31/2011)


^The notable increase in actual CER versus the projected CER is due to the increase in waste received by the landfill, from 2.5 tons per day as reported in the CDM application to 5 tons per day.

Legislation: National Policy on Climate Change

After Brazil's Congress passed the climate change legislation, on December 29, 2009, President Luiz Inácio Lula da Silva signed the National Policy on Climate Change (PNMC). [10] The law requires Brazil to reduce greenhouse gas emissions by 38.9% by 2020. [10] [11] On December 9, 2010, President Lula signed a decree which details the provisions of PNMC. [12] At its foundation, PNMC focuses on prevention, citizen participation, and sustainable development. [13] [14]

Law N° 12.187 of 2009

There are 13 articles in the legislation: [10]

Article 1 establishes the laws and principals governing PNMC.
Article 2 establishes definitions and key terms related to climate change including, adverse effects of climate change, emissions, greenhouse gases, and mitigation.
Article 3 states:
  1. Everyone has a duty to reduce the human impact on climate change
  2. Steps will be taken to anticipate, prevent, and minimize the causes of climate change as determined by the scientific community
  3. Measures will be taken to consider and distribute the burden among various socio-economic populations and communities
  4. Sustainable development is a prerequisite for mitigating climate change and the needs of each population and territory should be dually considered
  5. Actions taken at the national level to mitigate climate change must consider actions taken at the municipal, state, and private sectors
  6. Vetoed
Article 4 outlines the goals:
  1. Reconcile socio-economic development and climate protection
  2. Reduce greenhouse emissions
  3. Vetoed
  4. Strengthen methods for removal of anthropogenic green house emissions
  5. Use measures to promote adaption by all three spheres of the Brazilian Federation with participation and collaboration from economic and social sectors, in particular those most affected by climate change
  6. Preserve, conserve, and restore environmental resources, in particular natural biomes considered a National Heritage
  7. Consolidate and expand legally protected areas and encourage reforestation and revegetation of degraded areas
  8. Stimulate development of the Brazilian Market for Emissions Reduction (MBRE)
Article 5 establishes the guidelines of PNMC:
  1. Follow-through on commitments made through the Kyoto Protocol and other climate change measures
  2. Assess measurable benefits, quantifiable and verifiable, of mitigation actions
  3. Adapt measures to reduce adverse effects
  4. Integrate strategies at the local, regional, and national levels
  5. Encourage participation of the federal, state, county, and municipal levels, as well as the productive sector, academia and civil society organizations, and implement policies, plans, programs, and actions
  6. Promote and develop scientific research
  7. Utilize financial and economic instruments to promote mitigation actions
  8. Identify and articulate the instruments used to protect climate change
  9. Promote activities that effectively reduce gas emissions
  10. Promote international cooperation
  11. Improve systematic observation
  12. Promote dissemination of information, education, and training
  13. Stimulate and support practices and activities with low emissions and sustainable consumption
Article 6 outlines the instruments, committees, plans, funding, policy, research, monitoring, indicators, and assessments PNMC will utilize toward climate change.
Article 7 outlines institutional instruments PNMC will utilize:
  1. Interministerial Committee on Climate Change
  2. Interministerial Commission on Global Climate Change
  3. Brazilian Forum on Climate Change
  4. The Brazilian Network for Research on Global Climate Change - Climate Network
  5. Commission for Coordination of Activities of Meteorology, Climatology and Hydrology
Article 8 addresses the official financial institutions line of credit to support climate change efforts.
Article 9 notes that MBRE will be monitored by the Securities Commission.
Article 10 was vetoed.
Article 11 states that public policy and government programs should be compatible with PNMC.
Article 12 states the country's adoption of greenhouse emission gas reductions of 36.1% to 38.9%.
Article 13 states that the law will become official on its publication date of December 31, 2009.

Presidential decree N° 7.390 of 2010

The decree specifies how Brazil quantifies greenhouse emissions, how it will achieve the reduction, and a legal requirement for estimating annual emissions. The policy will use Brazil's 2005 emission rate as the business as usual base line for comparison of future emissions. The Policy: [12]

Specifically, the decree lists the following Action Plans: [12]

  1. Prevention and Control of Deforestation in the Amazon
  2. Prevention and Control of Deforestation and Forest Fires in the Cerrado
  3. Ten Year Plan for Expansion of Energy
  4. Consolidation of an Economy of Low-Carbon in Agriculture
  5. Reducing Emissions from Steel

Per the decree, the Sectoral Plans will include: [12]

  1. Emission reduction target in 2020 and incremental goals with a maximum interval of three years
  2. Actions to be implemented
  3. Definition of indicators for monitoring and evaluating effectiveness
  4. Proposed regulatory instruments and incentives for implementation
  5. Competitive alignment with industry studies' estimated costs and impacts

Per the decree, the following sectors are included in the estimations: [12]

  1. Change of Land Use: 1,404 million tons of CO2e (e=equivalent)
  2. Energy: 868 million tons of CO2e
  3. Agriculture: 730 million tons of CO2e
  4. Industrial Processes and Waste: 234 million tons of CO2e

The National Climate Change Fund "supports mitigation and adaptation projects and will rely principally on a to-be-determined portion of future oil and gas revenues." [12]

See also

Related Research Articles

<span class="mw-page-title-main">Global warming potential</span> Potential heat absorbed by a greenhouse gas

Global warming potential (GWP) is a measure of how much infrared thermal radiation a greenhouse gas added to the atmosphere would absorb over a given time frame, as a multiple of the radiation that would be absorbed by the same mass of added carbon dioxide. GWP is 1 for CO2. For other gases it depends on how strongly the gas absorbs infrared thermal radiation, how quickly the gas leaves the atmosphere, and the time frame being considered. The carbon dioxide equivalent is calculated from GWP. For any gas, it is the mass of CO2 that would warm the earth as much as the mass of that gas. Thus it provides a common scale for measuring the climate effects of different gases. It is calculated as GWP times mass of the other gas.

<span class="mw-page-title-main">Kyoto Protocol</span> 1997 international treaty to reduce greenhouse gas emissions

The Kyoto Protocol (Japanese: 京都議定書, Hepburn: Kyōto Giteisho) was an international treaty which extended the 1992 United Nations Framework Convention on Climate Change (UNFCCC) that commits state parties to reduce greenhouse gas emissions, based on the scientific consensus that global warming is occurring and that human-made CO2 emissions are driving it. The Kyoto Protocol was adopted in Kyoto, Japan, on 11 December 1997 and entered into force on 16 February 2005. There were 192 parties (Canada withdrew from the protocol, effective December 2012) to the Protocol in 2020.

<span class="mw-page-title-main">Emission intensity</span> Emission rate of a pollutant

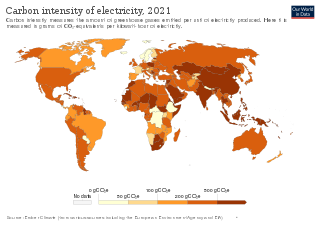
An emission intensity is the emission rate of a given pollutant relative to the intensity of a specific activity, or an industrial production process; for example grams of carbon dioxide released per megajoule of energy produced, or the ratio of greenhouse gas emissions produced to gross domestic product (GDP). Emission intensities are used to derive estimates of air pollutant or greenhouse gas emissions based on the amount of fuel combusted, the number of animals in animal husbandry, on industrial production levels, distances traveled or similar activity data. Emission intensities may also be used to compare the environmental impact of different fuels or activities. In some case the related terms emission factor and carbon intensity are used interchangeably. The jargon used can be different, for different fields/industrial sectors; normally the term "carbon" excludes other pollutants, such as particulate emissions. One commonly used figure is carbon intensity per kilowatt-hour (CIPK), which is used to compare emissions from different sources of electrical power.

<span class="mw-page-title-main">Landfill gas</span> Gaseous fossil fuel

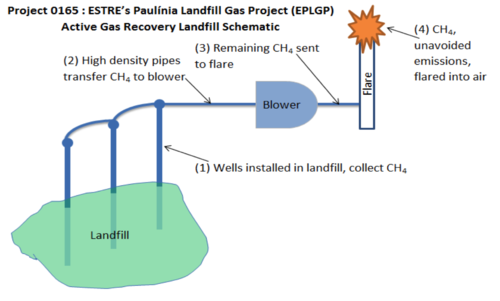
Landfill gas is a mix of different gases created by the action of microorganisms within a landfill as they decompose organic waste, including for example, food waste and paper waste. Landfill gas is approximately forty to sixty percent methane, with the remainder being mostly carbon dioxide. Trace amounts of other volatile organic compounds (VOCs) comprise the remainder (<1%). These trace gases include a large array of species, mainly simple hydrocarbons.

<span class="mw-page-title-main">Climate change mitigation</span> Actions to reduce net greenhouse gas emissions to limit climate change

Climate change mitigation is action to limit climate change. This action either reduces emissions of greenhouse gases or removes those gases from the atmosphere. The recent rise in global temperature is mostly due to emissions from burning fossil fuels such as coal, oil, and natural gas. There are various ways that mitigation can reduce emissions. These are transitioning to sustainable energy sources, conserving energy, and increasing efficiency. It is possible to remove carbon dioxide from the atmosphere. This can be done by enlarging forests, restoring wetlands and using other natural and technical processes. The name for these processes is carbon sequestration. Governments and companies have pledged to reduce emissions to prevent dangerous climate change. These pledges are in line with international negotiations to limit warming.

The Clean Development Mechanism (CDM) is a United Nations-run carbon offset scheme allowing countries to fund greenhouse gas emissions-reducing projects in other countries and claim the saved emissions as part of their own efforts to meet international emissions targets. It is one of the three Flexible Mechanisms defined in the Kyoto Protocol. The CDM, defined in Article 12 of the Protocol, was intended to meet two objectives: (1) to assist non-Annex I countries achieve sustainable development and reduce their carbon footprints; and (2) to assist Annex I countries in achieving compliance with their emissions reduction commitments.

<span class="mw-page-title-main">Carbon footprint</span> Concept to quantify greenhouse gas emissions from activities or products

The carbon footprint (or greenhouse gas footprint) serves as an indicator to compare the total amount of greenhouse gases emitted from an activity, product, company or country. Carbon footprints are usually reported in tons of emissions (CO2-equivalent) per unit of comparison; such as per year, person, kg protein, km travelled and alike. For a product, its carbon footprint includes the emissions for the entire life cycle from the production along the supply chain to its final consumption and disposal. Similarly for an organization, its carbon footprint includes the direct as well as the indirect emissions caused by the organization (called Scope 1, 2 and 3 in the Greenhouse Gas Protocol that is used for carbon accounting of organizations). Several methodologies and online tools exist to calculate the carbon footprint, depending on whether the focus is on a country, organization, product or individual person. For example, the carbon footprint of a product could help consumers decide which product to buy if they want to be climate aware. In the context of climate change mitigation activities, the carbon footprint can help distinguish those economic activities with a high footprint from those with a low footprint. In other words, the carbon footprint concept allows everyone to make comparisons between the climate-relevant impacts of individuals, products, companies, countries. In doing so, it helps to devise strategies and priorities for reducing the carbon footprint.

<span class="mw-page-title-main">Carbon offsets and credits</span> Carbon dioxide reduction scheme

A carbon offset is a reduction or removal of emissions of carbon dioxide or other greenhouse gases made in order to compensate for emissions made elsewhere. A carbon credit or offset credit is a transferrable financial instrument (i.e. a derivative of an underlying commodity) certified by governments or independent certification bodies to represent an emission reduction that can then be bought or sold. Both offsets and credits are measured in tonnes of carbon dioxide-equivalent (CO2e). One carbon offset or credit represents the reduction or removal of one tonne of carbon dioxide or its equivalent in other greenhouse gases.

Flexible mechanisms, also sometimes known as Flexibility Mechanisms or Kyoto Mechanisms, refers to emissions trading, the Clean Development Mechanism and Joint Implementation. These are mechanisms defined under the Kyoto Protocol intended to lower the overall costs of achieving its emissions targets. These mechanisms enable Parties to achieve emission reductions or to remove carbon from the atmosphere cost-effectively in other countries. While the cost of limiting emissions varies considerably from region to region, the benefit for the atmosphere is in principle the same, wherever the action is taken.

An emission inventory is an accounting of the amount of pollutants discharged into the atmosphere. An emission inventory usually contains the total emissions for one or more specific greenhouse gases or air pollutants, originating from all source categories in a certain geographical area and within a specified time span, usually a specific year.

<span class="mw-page-title-main">Greenhouse gas emissions</span> Sources and amounts of greenhouse gases emitted to the atmosphere from human activities

Greenhouse gas (GHG) emissions from human activities intensify the greenhouse effect. This contributes to climate change. Carbon dioxide, from burning fossil fuels such as coal, oil, and natural gas, is one of the most important factors in causing climate change. The largest emitters are China followed by the United States. The United States has higher emissions per capita. The main producers fueling the emissions globally are large oil and gas companies. Emissions from human activities have increased atmospheric carbon dioxide by about 50% over pre-industrial levels. The growing levels of emissions have varied, but have been consistent among all greenhouse gases. Emissions in the 2010s averaged 56 billion tons a year, higher than any decade before. Total cumulative emissions from 1870 to 2017 were 425±20 GtC from fossil fuels and industry, and 180±60 GtC from land use change. Land-use change, such as deforestation, caused about 31% of cumulative emissions over 1870–2017, coal 32%, oil 25%, and gas 10%.

<span class="mw-page-title-main">Greenhouse gas emissions by the United States</span> Climate changing gases from the North American country

The United States produced 5.2 billion metric tons of carbon dioxide equivalent greenhouse gas (GHG) emissions in 2020, the second largest in the world after greenhouse gas emissions by China and among the countries with the highest greenhouse gas emissions per person. In 2019 China is estimated to have emitted 27% of world GHG, followed by the United States with 11%, then India with 6.6%. In total the United States has emitted a quarter of world GHG, more than any other country. Annual emissions are over 15 tons per person and, amongst the top eight emitters, is the highest country by greenhouse gas emissions per person. However, the IEA estimates that the richest decile in the US emits over 55 tonnes of CO2 per capita each year. Because coal-fired power stations are gradually shutting down, in the 2010s emissions from electricity generation fell to second place behind transportation which is now the largest single source. In 2020, 27% of the GHG emissions of the United States were from transportation, 25% from electricity, 24% from industry, 13% from commercial and residential buildings and 11% from agriculture. In 2021, the electric power sector was the second largest source of U.S. greenhouse gas emissions, accounting for 25% of the U.S. total. These greenhouse gas emissions are contributing to climate change in the United States, as well as worldwide.

Eco Securities is a company specialized in carbon markets and greenhouse gas (GHG) mitigation projects worldwide. Eco Securities specializes in sourcing, developing and financing projects on renewable energy, energy efficiency, forestry and waste management with a positive environmental impact.

The Intergovernmental Panel on Climate Change (IPCC) with the United Nations Framework Convention on Climate Change (UNFCCC) use tens of acronyms and initialisms in documents relating to climate change policy.

Pedro Moura Costa is an entrepreneur involved in environmental finance with a focus on the international efforts for greenhouse gas (GHG) emission reductions. Of particular relevance, he was the founder and President of EcoSecurities Group Plc., one of the leading project developers for the international carbon markets, and has written widely about the policy and science of climate change mitigation, including contributions to the Intergovernmental Panel on Climate Change (IPCC) reports.

<span class="mw-page-title-main">Climate and Clean Air Coalition to Reduce Short-Lived Climate Pollutants</span>

The Climate and Clean Air Coalition to Reduce Short-Lived Climate Pollutants (CCAC) was launched by the United Nations Environment Programme (UNEP) and six countries—Bangladesh, Canada, Ghana, Mexico, Sweden, and the United States—on 16 February 2012. The CCAC aims to catalyze rapid reductions in short-lived climate pollutants to protect human health, agriculture and the environment. To date, more than $90 million has been pledged to the Climate and Clean Air Coalition from Canada, Denmark, the European Commission, Germany, Japan, the Netherlands, Norway, Sweden, and the United States. The program is managed out of the United Nations Environmental Programme through a Secretariat in Paris, France.

Increasing methane emissions are a major contributor to the rising concentration of greenhouse gases in Earth's atmosphere, and are responsible for up to one-third of near-term global heating. During 2019, about 60% of methane released globally was from human activities, while natural sources contributed about 40%. Reducing methane emissions by capturing and utilizing the gas can produce simultaneous environmental and economic benefits.

<span class="mw-page-title-main">Greenhouse gas emissions by Russia</span> Greenhouse gas emissions originating from Russia and efforts to reduce them

Greenhouse gas emissionsbyRussia are mostly from fossil gas, oil and coal. Russia emits 2 or 3 billion tonnes CO2eq of greenhouse gases each year; about 4% of world emissions. Annual carbon dioxide emissions alone are about 12 tons per person, more than double the world average. Cutting greenhouse gas emissions, and therefore air pollution in Russia, would have health benefits greater than the cost. The country is the world's biggest methane emitter, and 4 billion dollars worth of methane was estimated to leak in 2019/20.

References

  1. "Kyoto Protocol Status of Ratification (pdf)" (PDF). Retrieved March 5, 2011.
  2. "Status of Ratification". UNFCCC's Kyoto Protocol Background. Retrieved March 5, 2011.
  3. 1 2 3 Raghavan, P. (December 9, 2009). "China, India and Brazil ahead in carbon credits". The Financial Express. Retrieved March 5, 2011.
  4. "Pesquisa Nacional de Saneamento Basico (PNSB)" (PDF) (in Portuguese). Instituto Brasileiro de Geografia e Estatistica (IBGE). 2010. Archived from the original (PDF) on April 13, 2015. Retrieved March 6, 2011.
  5. "Methane Emissions From Waste Treatment and Disposal" (PDF). First Brazilian Inventory of Anthropogenic Greenhouse Gas Emissions Background Report. Environmental Sanitation Technology Company (CETESB), Ministry of Science and Technology, Brazil. 2002. Retrieved March 28, 2011.
  6. "Landfill Gas (LFG) Study" (PDF). Global Environment Centre Foundation. c. 2000. Retrieved March 6, 2011.
  7. "Project 0027 : Onyx Landfill Gas Recovery Project – Trémembé, Brazil". ONYX / UNFCCC. October 2004. Retrieved March 7, 2011.
  8. "Project 0165 : ESTRE's Paulínia Landfill Gas Project (EPLGP)". Empresa de Saneamento e Tratamento de Resíduos (ESTRE). July 1, 2004. Retrieved March 24, 2011.
  9. "Estre Company Website" . Retrieved March 31, 2011.
  10. 1 2 3 "National Climate Change Policy" (PDF) (in Portuguese). Diário Oficial da União. December 29, 2009. Retrieved March 22, 2011.
  11. Gonçalves, Alexandre (December 31, 2009). "Lula sanciona lei que cria política de mudanças climáticas" (in Portuguese). Grupo Estado. Retrieved March 5, 2011.
  12. 1 2 3 4 5 6 Luiz Inácio Lula da Silva; Guido Mantega, Wagner Gonçalves Rossi, Miguel Jorge, Márcio Pereira Zimmermann, Sergio Machado Rezende, Izabella Mônica Vieira Teixeira (December 9, 2010). "Presidential Decree N 7.390" (Web) (in Portuguese). Brazil Federal Senate, Secretariat of Information. Retrieved March 22, 2011.{{cite web}}: CS1 maint: multiple names: authors list (link)
  13. Ministério do Meio Ambiente (December 15, 2010). "New decree details Brazil's National Policy on Climate Change". Amigos da Terra - Amazônia Brasileira. Retrieved March 5, 2011.
  14. Alexandre Leite Ribeiro do Valle and Carolina Pett G. Gonçalves (Summer 2010). "Brazilian Laws and Climate Changes". ABA International Law News. Retrieved March 5, 2011.