
Fayette County is a county located in the U.S. state of Alabama. As of the 2020 census, the population was 16,321. Its county seat is Fayette. Its name is in honor of the Marquis de Lafayette, who aided General George Washington in the American Revolutionary War.
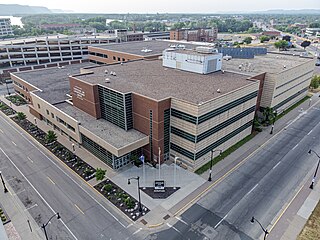
La Crosse County is a county located in the U.S. state of Wisconsin. At the 2020 census, the population was 120,784. Its county seat is La Crosse. La Crosse County is included in the La Crosse-Onalaska, WI-MN Metropolitan Statistical Area with a population of 139,627 and is the most populous county on Wisconsin's western border.

Garfield County is a county located in the U.S. state of Washington. As of the 2020 census, the population was 2,286, making it the least populous county in Washington; with about 3.2 inhabitants per square mile (1.2/km2), it is also the least densely populated county in Washington. The county seat and only city is Pomeroy.

Nueces County is located in the U.S. state of Texas. As of the 2020 census, the population was 353,178, making it the 16th-most populous county in the state. The county seat is Corpus Christi. The county was formed in 1846 from portions of San Patricio County and organized the following year. It is named for the Nueces River, which marks the county's northwestern boundary with San Patricio County before emptying into its mouth at Nueces Bay north of the port of Corpus Christi. Nueces County is part of the Corpus Christi metropolitan statistical area.

Lee County is a county located in the U.S. state of Texas. As of the 2020 census, its population was 17,478. Its county seat is Giddings. The county was founded in 1874 and is named for Confederate General Robert E. Lee. The county has many Confederate memorials and monuments to the Confederate States of America.

King County is a county located in the U.S. state of Texas. The population was 265 at the 2020 census, making it the second-least populated county in Texas and the third-least populated county in the United States. King County has no incorporated communities. Its county seat is the census-designated place (CDP) of Guthrie. The county was created in 1876 and organized in 1891. It is named for William Philip King, who died at the Battle of the Alamo.

Rio Arriba County is a county in the U.S. state of New Mexico. As of the 2020 census, the population was 40,363. Its county seat is Tierra Amarilla. Its northern border is the Colorado state line.

McKinley County is a county in the northwestern section of the U.S. state of New Mexico. As of the 2020 United States Census, its population was 72,902. Its county seat is Gallup. The county was created in 1901 and named for President William McKinley.

Los Alamos County is a county in the U.S. state of New Mexico. As of the 2020 census, the population was 19,419. The smallest county by area in the state, Los Alamos County was formerly administered exclusively by the U.S. federal government during the Manhattan Project, but it now has equal status to New Mexico's other counties. The county has two census-designated places: Los Alamos and White Rock.

Lea County is a county located in the U.S. state of New Mexico. As of the 2020 census, its population was 74,455.

Chaves County is a county in New Mexico, United States. As of the 2020 census, the population was 65,157. Its county seat is Roswell. Chaves County was named for Colonel Jose Francisco Chaves, a military leader there during the Civil War and later in Navajo campaigns. The county was created by the New Mexico Territorial Legislature on February 25, 1889, out of land from Lincoln County.
Bernalillo County is the most populous county in the U.S. state of New Mexico. As of the 2020 census, the population was 676,444. The county seat, Albuquerque, is the most populous city in New Mexico.

Carver County is a county in the U.S. state of Minnesota. The county is mostly farmland and wilderness with many unincorporated townships. As of the 2020 census, the population was 106,922. Its county seat is Chaska. Carver County is named for explorer Jonathan Carver, who in 1766–67, traveled from Boston to the Minnesota River and wintered among the Sioux near the site of New Ulm. Carver County is part of the Minneapolis-St. Paul-Bloomington, MN-WI Metropolitan Statistical Area.

Marshall County is a county located in the U.S. state of Illinois. According to the 2020 census, it had a population of 11,742. Its county seat is Lacon.

Madison County is a county located in the U.S. state of Idaho. As of the 2020 census, the population was 52,913. The county seat and largest city is Rexburg.

Garfield County is a county located in the U.S. state of Colorado. As of the 2020 census, the population was 61,685. The county seat is Glenwood Springs. The county is named in honor of United States President James A. Garfield. Garfield County is included in the Glenwood Springs, CO Micropolitan Statistical Area, which is also included in the Edwards-Glenwood Springs, CO Combined Statistical Area.
