This aims to be a complete list of the articles on real estate.

Real estate economics is the application of economic techniques to real estate markets. It aims to describe and predict economic patterns of supply and demand. The closely related field of housing economics is narrower in scope, concentrating on residential real estate markets, while the research on real estate trends focuses on the business and structural changes affecting the industry. Both draw on partial equilibrium analysis, urban economics, spatial economics, basic and extensive research, surveys, and finance.

The affordability of housing in the UK reflects the ability to rent or buy property. There are various ways to determine or estimate housing affordability. One commonly used metric is the median housing affordability ratio; this compares the median price paid for residential property to the median gross annual earnings for full-time workers. According to official government statistics, housing affordability worsened between 2020 and 2021, and since 1997 housing affordability has worsened overall, especially in London. The most affordable local authorities in 2021 were in the North West, Wales, Yorkshire and The Humber, West Midlands and North East.
Wendell Cox is an American urban policy analyst and proponent of the use of the private car over rail projects. He is the principal and sole owner of Wendell Cox Consultancy/Demographia, based in the St. Louis metropolitan region and editor of three web sites, Demographia, The Public Purpose and Urban Tours by Rental Car. Cox is a fellow of numerous conservative think tanks and a frequent op-ed commenter in conservative US and UK newspapers.

The 2000s United States housing bubble or house price boom or 2000shousing cycle was a sharp run up and subsequent collapse of house asset prices affecting over half of the U.S. states. In many regions a real estate bubble, it was the impetus for the subprime mortgage crisis. Housing prices peaked in early 2006, started to decline in 2006 and 2007, and reached new lows in 2011. On December 30, 2008, the Case–Shiller home price index reported the largest price drop in its history. The credit crisis resulting from the bursting of the housing bubble is an important cause of the Great Recession in the United States.
A housing bubble is one of several types of asset price bubbles which periodically occur in the market. The basic concept of a housing bubble is the same as for other asset bubbles, consisting of two main phases. First there is a period where house prices increase dramatically, driven more and more by speculation. In the second phase, house prices fall dramatically. Housing bubbles tend to be among the asset bubbles with the largest effect on the real economy because they are credit-fueled,,and a large number of households participate and not just investors, and because the wealth effect from housing tends to be larger than for other types of financial assets.
A real-estate bubble or property bubble is a type of economic bubble that occurs periodically in local or global real estate markets, and it typically follows a land boom or reduce interest rates. A land boom is a rapid increase in the market price of real property such as housing until they reach unsustainable levels and then declines. This period, during the run-up to the crash, is also known as froth. The questions of whether real estate bubbles can be identified and prevented, and whether they have broader macroeconomic significance, are answered differently by schools of economic thought, as detailed below.

Affordable housing is housing which is deemed affordable to those with a household income at or below the median, as rated by the national government or a local government by a recognized housing affordability index. Most of the literature on affordable housing refers to mortgages and a number of forms that exist along a continuum – from emergency homeless shelters, to transitional housing, to non-market rental, to formal and informal rental, indigenous housing, and ending with affordable home ownership. Demand for affordable housing is generally associated with a decrease in housing affordability, such as rent increases, in addition to increased homelessness.
United States housing prices experienced a major market correction after the housing bubble that peaked in early 2006. Prices of real estate then adjusted downwards in late 2006, causing a loss of market liquidity and subprime defaults.

Observers and analysts have attributed the reasons for the 2001–2006 housing bubble and its 2007–10 collapse in the United States to "everyone from home buyers to Wall Street, mortgage brokers to Alan Greenspan". Other factors that are named include "Mortgage underwriters, investment banks, rating agencies, and investors", "low mortgage interest rates, low short-term interest rates, relaxed standards for mortgage loans, and irrational exuberance" Politicians in both the Democratic and Republican political parties have been cited for "pushing to keep derivatives unregulated" and "with rare exceptions" giving Fannie Mae and Freddie Mac "unwavering support".
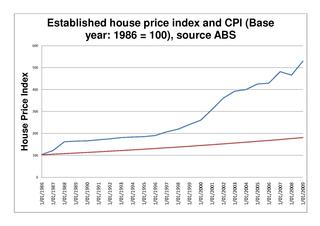
The Australian property bubble is the economic theory that the Australian property market has become or is becoming significantly overpriced and due for a significant downturn. Since the early 2010s, various commentators, including one Treasury official, have claimed the Australian property market is in a significant bubble.
A housing affordability index (HAI) is an index that measures housing affordability, usually the degree to which the median person or family in a particular country or region can afford housing/housing-related costs.

The 2005 Chinese property bubble was a real estate bubble in residential and commercial real estate in China. The New York Times reported that the bubble started to deflate in 2011, while observing increased complaints that members of the middle class were unable to afford homes in large cities. The deflation of the property bubble is seen as one of the primary causes for China's declining economic growth in 2013.
Real estate in China is developed and managed by public, private, and state-owned red chip enterprises.

Affordable housing in Canada refers to living spaces that are deemed financially accessible to households with a median household income. Housing affordability is generally measured based on a shelter-cost-to-income ratio (STIR) of 30% by the Canada Mortgage and Housing Corporation (CMHC), the national housing agency of Canada. It encompasses a continuum ranging from market-based options like affordable rental housing and affordable home ownership, to non-market alternatives such as government-subsidized housing. Canada ranks among the lowest of the most developed countries for housing affordability.
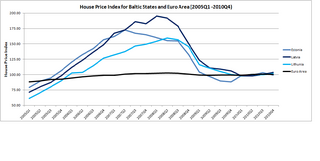
The Baltic states' housing bubble was an economic bubble involving major cities in Estonia, Latvia and Lithuania. The three Baltic countries had enjoyed a relatively strong economic growth between 2000 and 2006, and the real estate sectors had performed well since 2000. In fact, in between 2005Q1 and 2007Q1, the official house price index for Estonia, Latvia and Lithuania recorded a sharp jump of 104.6%, 134.3% and 106.7%. By comparison, the official house price index for Euro Area increased by 11.8% for a similar time period.
The property bubble in New Zealand is a major national economic and social issue. Since the early 1990s, house prices in New Zealand have risen considerably faster than incomes, putting increasing pressure on public housing providers as fewer households have access to housing on the private market. The property bubble has produced significant impacts on inequality in New Zealand, which now has one of the highest homelessness rate in the OECD and a record-high waiting list for public housing. Government policies have attempted to address the crisis since 2013, but have produced limited impacts to reduce prices or increase the supply of affordable housing. However, prices started falling in 2022 in response to tightening of mortgage availability and supply increasing. Some areas saw drops as high as around 9% - albeit from very high prices.

Affordable housing is housing that is deemed affordable to those with a median household income as rated by the national government or a local government by a recognized housing affordability index. A general rule is no more than 30% of gross monthly income should be spent on housing, to be considered affordable as the challenges of promoting affordable housing varies by location.

The Canadian property bubble refers to a significant rise in Canadian real estate prices from 2002 to present. The Dallas Federal Reserve rated Canadian real estate as "exuberant" beginning in 2003. From 2003 to 2018, Canada saw an increase in home and property prices of up to 337% in some cities. In 2016, the OECD warned that Canada's financial stability was at risk due to elevated housing prices, investment and household debt. By 2018, home-owning costs were above 1990 levels when Canada saw its last housing bubble burst. Bloomberg Economics ranked Canada as the second largest housing bubble across the OECD in 2019 and 2021. Toronto scored the highest in the world in Swiss bank UBS' real estate bubble index in 2022, with Vancouver also scoring among the 10 riskiest cities in the world.
The 16th Annual Demographia International Housing Affordability Survey: 2020 analyzed affordability in 7 Anglophone countries and Hong Kong. Among this sample, the housing markets with the least affordable real estate prices are Hong Kong, Vancouver, and Sydney. The top three housing markets with the most affordable real estate prices based on major housing markets are Rochester, New York, Cleveland, Ohio, and Oklahoma City, Oklahoma. This survey was performed by Demographia, a global analysis firm.

