Microbarom

Last updated

In acoustics, microbaroms, also known as the "voice of the sea", [1] [2] are a class of atmospheric infrasonic waves generated in marine storms [3] [4] by a non-linear interaction of ocean surface waves with the atmosphere. [5] [6] They typically have narrow-band, nearly sinusoidal waveforms with amplitudes up to a few microbars, [7] [8] and wave periods near 5 seconds (0.2 hertz). [9] [10] Due to low atmospheric absorption at these low frequencies, microbaroms can propagate thousands of kilometers in the atmosphere, and can be readily detected by widely separated instruments on the Earth's surface. [5] [11]

Contents

History

The reason for the discovery of this phenomenon was an accident: the aerologists working at the marine Hydrometeorology stations and watercraft drew attention to the strange pain that a person experiences when approaching the surface of a standard meteorological probe (a balloon filled with hydrogen). During one of the expeditions, this effect was demonstrated to the Soviet academician V. V. Shuleikin by the chief meteorologist V. A. Berezkin. This phenomenon drew genuine interest among scientists; in order to study it, special equipment was designed to record powerful but low-frequency vibrations that are not audible to human ears.

As a result of several series of experiments, the physical essence of this phenomenon was clarified and in 1935 when V.V. Shuleikin published his first work entirely devoted to the infrasonic nature of the “voice of the sea”. Microbaroms were first described in United States in 1939 by American seismologists Hugo Benioff and Beno Gutenberg at the California Institute of Technology at Pasadena, based on observations from an electromagnetic microbarograph, [11] consisting of a wooden box with a low-frequency loudspeaker mounted on top. [12] They noted their similarity to microseisms observed on seismographs, [9] and correctly hypothesized that these signals were the result of low pressure systems in the Northeast Pacific Ocean. [11] In 1945, Swiss geoscientist L. Saxer showed the first relationship of microbaroms with wave height in ocean storms and microbarom amplitudes. [9] Following up on the theory of microseisms by M. S. Longuet-Higgins, Eric S. Posmentier proposed that the oscillations of the center of gravity of the air above the Ocean surface on which the standing waves appear were the source of microbaroms, explaining the doubling of the ocean wave frequency in the observed microbarom frequency. [13] Microbaroms are now understood to be generated by the same mechanism that makes secondary microseisms. The first quantitatively correct theory of microbarom generation is due to L. M. Brekhovskikh who showed that it is the source of microseisms in the ocean that couples to the atmosphere. This explains that most of the acoustic energy propagates near the horizontal direction at the sea level. [14]

Theory

Isolated traveling ocean surface gravity waves radiate only evanescent acoustic waves, [7] and don't generate microbaroms. [15]

The interaction of two trains of surface waves of different frequencies and directions generates wave groups. For waves propagating almost in the same direction, this gives the usual sets of waves that travel at the group speed, which is slower than phase speed of water waves. For typical ocean waves with a period around 10 seconds, this group speed is close to 10 m/s.

In the case of opposite propagation direction the groups travel at a much larger speed, which is now 2π(f1 + f2)/(k1k2) with k1 and k2 the wave numbers of the interacting water waves. For wave trains with a very small difference in frequency (and thus wave numbers), this pattern of wave groups may have the same horizontal velocity as acoustic waves, more than 300 m/s, and will excite microbaroms.

Wave groups generated by waves with opposing directions. The blue curve is the sum of the red and black. In the animation, watch the crests with the red and black dots. These crests move with the phase speed of linear water waves, but the groups propagate much faster. (Animation) Wave group minus small.gif
Wave groups generated by waves with opposing directions. The blue curve is the sum of the red and black. In the animation, watch the crests with the red and black dots. These crests move with the phase speed of linear water waves, but the groups propagate much faster. (Animation)

As far as seismic and acoustic waves are concerned, the motion of ocean waves in deep water is, to the leading order, equivalent to a pressure applied at the sea surface. [16] This pressure is nearly equal to the water density times the wave orbital velocity squared. Because of this square, it is not the amplitude of the individual wave trains that matter (red and black lines in the figures) but the amplitude of the sum, the wave groups (blue line in figures). The ocean motion generated by this "equivalent pressure" is then transmitted to the atmosphere.

If the wave groups travel faster than the sound speed, microbaroms are generated, with propagation directions closer to the vertical for the faster wave groups.

Pressure field in the ocean and atmosphere associated to groups made by opposing wave trains. Left: short wave groups giving oblique propagation in the atmosphere. Right: long wave groups giving nearly vertical propagation in the atmosphere. Wave group and microbarom.png
Pressure field in the ocean and atmosphere associated to groups made by opposing wave trains. Left: short wave groups giving oblique propagation in the atmosphere. Right: long wave groups giving nearly vertical propagation in the atmosphere.

Real ocean waves are composed of an infinite number of wave trains of all directions and frequencies, giving a broad range of acoustic waves. In practice, the transmission from the ocean to the atmosphere is strongest for angles around 0.5 degrees from the horizontal. For near-vertical propagation, the water depth may play an amplifying role as it does for microseisms.

Acoustic power per solid angle radiated as microbarom by ocean waves. Left: log scale as a function of the elevation angle (zero is vertical). Right: linear scale in polar coordinates. Microbarom radiation pattern.png
Acoustic power per solid angle radiated as microbarom by ocean waves. Left: log scale as a function of the elevation angle (zero is vertical). Right: linear scale in polar coordinates.

The water depth is only important for those acoustic waves that have a propagation direction within 12° of the vertical at the sea surface [17]

There is always some energy propagating in the opposite direction. However, their energy may be extremely low. Significant microbarom generation only occurs when there is significant energy at the same frequency and in opposing directions. This is strongest when waves from different storms interact or in the lee of a storm [18] [19] which produce the required standing wave conditions, [15] also known as the clapotis. [20] When the ocean storm is a tropical cyclone, the microbaroms are not produced near the eye wall where wind speeds are greatest, but originate from the trailing edge of the storm where the storm generated waves interact with the ambient ocean swells. [21]

Microbaroms may also be produced by standing waves created between two storms, [18] or when an ocean swell is reflected at the shore. Waves with approximately 10-second periods are abundant in the open oceans, and correspond to the observed 0.2 Hz infrasonic spectral peak of microbaroms, because microbaroms exhibit frequencies twice that of the individual ocean waves. [18] Studies have shown that the coupling produces propagating atmospheric waves only when non-linear terms are considered. [9]

Microbaroms are a form of persistent low-level atmospheric infrasound, [22] generally between 0.1 and 0.5 Hz, that may be detected as coherent energy bursts or as a continuous oscillation. [11] When the plane wave arrivals from a microbarom source are analyzed from a phased array of closely spaced microbarographs, the source azimuth is found to point toward the low-pressure center of the originating storm. [23] When the waves are received at multiple distant sites from the same source, triangulation can confirm the source is near the center of an ocean storm. [4]

Microbaroms that propagate up to the lower thermosphere may be carried in an atmospheric waveguide, [24] refracted back toward the surface from below 120 km and above 150 km altitudes, [18] [25] or dissipated at altitudes between 110 and 140 km. [26] They may also be trapped near the surface in the lower troposphere by planetary boundary layer effects and surface winds, or they may be ducted in the stratosphere by upper-level winds and returned to the surface through refraction, diffraction or scattering. [27] These tropospheric and stratospheric ducts are only generated along the dominant wind directions, [25] may vary by time of day and season, [27] and will not return the sound rays to the ground when the upper winds are light. [18]

The angle of incidence of the microbarom ray determines which of these propagation modes it experiences. Rays directed vertically toward the zenith are dissipated in the thermosphere, and are a significant source of heating in that layer of the upper atmosphere. [26] At mid latitudes in typical summer conditions, rays between approximately 30 and 60 degrees from the vertical are reflected from altitudes above 125 km where the return signals are strongly attenuated first. [28] Rays launched at shallower angles may be reflected from the upper stratosphere at approximately 45 km above the surface in mid-latitudes, [28] or from 60 to 70 km in low latitudes. [18]

Microbaroms and upper atmosphere

Atmospheric scientists have used these effects for inverse remote sensing of the upper atmosphere using microbaroms. [24] [29] [30] [31] Measuring the trace velocity of the reflected microbarom signal at the surface gives the propagation velocity at the reflection height, as long as the assumption that the speed of sound only varies along the vertical, and not over the horizontal, is valid. [28] If the temperature at the reflection height can be estimated with sufficient precision, the speed of sound can be determined and subtracted from the trace velocity, giving the upper-level wind speed. [28] One advantage of this method is the ability to measure continuously – other methods that can only take instantaneous measurements may have their results distorted by short-term effects. [8]

Additional atmospheric information can be deduced from microbarom amplitude if the source intensity is known. Microbaroms are produced by upward directed energy transmitted from the ocean surface through the atmosphere. The downward directed energy is transmitted through the ocean to the sea floor, where it is coupled to the Earth's crust and transmitted as microseisms with the same frequency spectrum. [8] However, unlike microbaroms, where the near vertical rays are not returned to the surface, only the near vertical rays in the ocean are coupled to the sea floor. [27] By monitoring the amplitude of received microseisms from the same source using seismographs, information on the source amplitude can be derived. Because the solid earth provides a fixed reference frame, [32] the transit time of the microseisms from the source is constant, and this provides a control for the variable transit time of the microbaroms through the moving atmosphere. [8]

Microbaroms and Nuclear Explosions

Microbaroms are a significant noise source that can potentially interfere with the detection of infrasound from nuclear explosions. Accurate detection of explosions is a goal of the International Monitoring System organized under the Comprehensive Nuclear-Test-Ban Treaty (which has not entered into force). [33] It is a particular problem for detecting low-yield tests in the one-kiloton range because the frequency spectra overlap. [11]


See also

Further reading

Related Research Articles

<span class="mw-page-title-main">Ionosphere</span> Ionized part of Earths upper atmosphere

The ionosphere is the ionized part of the upper atmosphere of Earth, from about 48 km (30 mi) to 965 km (600 mi) above sea level, a region that includes the thermosphere and parts of the mesosphere and exosphere. The ionosphere is ionized by solar radiation. It plays an important role in atmospheric electricity and forms the inner edge of the magnetosphere. It has practical importance because, among other functions, it influences radio propagation to distant places on Earth. It also affects GPS signals that travel through this layer.

<span class="mw-page-title-main">Mesosphere</span> Layer of the atmosphere directly above the stratosphere and below the thermosphere

The mesosphere is the third layer of the atmosphere, directly above the stratosphere and directly below the thermosphere. In the mesosphere, temperature decreases as altitude increases. This characteristic is used to define limits: it begins at the top of the stratosphere, and ends at the mesopause, which is the coldest part of Earth's atmosphere, with temperatures below −143 °C. The exact upper and lower boundaries of the mesosphere vary with latitude and with season, but the lower boundary is usually located at altitudes from 47 to 51 km above sea level, and the upper boundary is usually from 85 to 100 km.

<span class="mw-page-title-main">Thermosphere</span> Layer of the Earths atmosphere above the mesosphere and below the exosphere

The thermosphere is the layer in the Earth's atmosphere directly above the mesosphere and below the exosphere. Within this layer of the atmosphere, ultraviolet radiation causes photoionization/photodissociation of molecules, creating ions; the thermosphere thus constitutes the larger part of the ionosphere. Taking its name from the Greek θερμός meaning heat, the thermosphere begins at about 80 km (50 mi) above sea level. At these high altitudes, the residual atmospheric gases sort into strata according to molecular mass. Thermospheric temperatures increase with altitude due to absorption of highly energetic solar radiation. Temperatures are highly dependent on solar activity, and can rise to 2,000 °C (3,630 °F) or more. Radiation causes the atmospheric particles in this layer to become electrically charged, enabling radio waves to be refracted and thus be received beyond the horizon. In the exosphere, beginning at about 600 km (375 mi) above sea level, the atmosphere turns into space, although, by the judging criteria set for the definition of the Kármán line (100 km), most of the thermosphere is part of space. The border between the thermosphere and exosphere is known as the thermopause.

The quasi-biennial oscillation (QBO) is a quasiperiodic oscillation of the equatorial zonal wind between easterlies and westerlies in the tropical stratosphere with a mean period of 28 to 29 months. The alternating wind regimes develop at the top of the lower stratosphere and propagate downwards at about 1 km (0.6 mi) per month until they are dissipated at the tropopause. Downward motion of the easterlies is usually more irregular than that of the westerlies. The amplitude of the easterly phase is about twice as strong as that of the westerly phase. At the top of the vertical QBO domain, easterlies dominate, while at the bottom, westerlies are more likely to be found. At the 30 mb level, with regards to monthly mean zonal winds, the strongest recorded easterly was 29.55 m/s in November 2005, while the strongest recorded westerly was only 15.62 m/s in June 1995.

<span class="mw-page-title-main">Infrasound</span> Vibrations with frequencies lower than 20 hertz

Infrasound, sometimes referred to as low frequency sound, describes sound waves with a frequency below the lower limit of human audibility. Hearing becomes gradually less sensitive as frequency decreases, so for humans to perceive infrasound, the sound pressure must be sufficiently high. The ear is the primary organ for sensing low sound, but at higher intensities it is possible to feel infrasound vibrations in various parts of the body.

<span class="mw-page-title-main">Microwave radiometer</span> Tool measuring EM radiation at 0.3–300-GHz frequency

A microwave radiometer (MWR) is a radiometer that measures energy emitted at one millimeter-to-metre wavelengths (frequencies of 0.3–300 GHz) known as microwaves. Microwave radiometers are very sensitive receivers designed to measure thermally-emitted electromagnetic radiation. They are usually equipped with multiple receiving channels to derive the characteristic emission spectrum of planetary atmospheres, surfaces or extraterrestrial objects. Microwave radiometers are utilized in a variety of environmental and engineering applications, including remote sensing, weather forecasting, climate monitoring, radio astronomy and radio propagation studies.

<span class="mw-page-title-main">Rossby wave</span> Inertial wave occurring in rotating fluids

Rossby waves, also known as planetary waves, are a type of inertial wave naturally occurring in rotating fluids. They were first identified by Sweden-born American meteorologist Carl-Gustaf Arvid Rossby in the Earth's atmosphere in 1939. They are observed in the atmospheres and oceans of Earth and other planets, owing to the rotation of Earth or of the planet involved. Atmospheric Rossby waves on Earth are giant meanders in high-altitude winds that have a major influence on weather. These waves are associated with pressure systems and the jet stream. Oceanic Rossby waves move along the thermocline: the boundary between the warm upper layer and the cold deeper part of the ocean.

<span class="mw-page-title-main">Atmospheric physics</span> The application of physics to the study of the atmosphere

Within the atmospheric sciences, atmospheric physics is the application of physics to the study of the atmosphere. Atmospheric physicists attempt to model Earth's atmosphere and the atmospheres of the other planets using fluid flow equations, radiation budget, and energy transfer processes in the atmosphere. In order to model weather systems, atmospheric physicists employ elements of scattering theory, wave propagation models, cloud physics, statistical mechanics and spatial statistics which are highly mathematical and related to physics. It has close links to meteorology and climatology and also covers the design and construction of instruments for studying the atmosphere and the interpretation of the data they provide, including remote sensing instruments. At the dawn of the space age and the introduction of sounding rockets, aeronomy became a subdiscipline concerning the upper layers of the atmosphere, where dissociation and ionization are important.

<span class="mw-page-title-main">Pacific decadal oscillation</span> Recurring pattern of climate variability

The Pacific decadal oscillation (PDO) is a robust, recurring pattern of ocean-atmosphere climate variability centered over the mid-latitude Pacific basin. The PDO is detected as warm or cool surface waters in the Pacific Ocean, north of 20°N. Over the past century, the amplitude of this climate pattern has varied irregularly at interannual-to-interdecadal time scales. There is evidence of reversals in the prevailing polarity of the oscillation occurring around 1925, 1947, and 1977; the last two reversals corresponded with dramatic shifts in salmon production regimes in the North Pacific Ocean. This climate pattern also affects coastal sea and continental surface air temperatures from Alaska to California.

<span class="mw-page-title-main">Polar motion</span> Motion of Earths rotational axis relative to its crust

Polar motion of the Earth is the motion of the Earth's rotational axis relative to its crust. This is measured with respect to a reference frame in which the solid Earth is fixed. This variation is a few meters on the surface of the Earth.

<span class="mw-page-title-main">Swell (ocean)</span> Series of waves generated by distant weather systems

A swell, also sometimes referred to as ground swell, in the context of an ocean, sea or lake, is a series of mechanical waves that propagate along the interface between water and air under the predominating influence of gravity, and thus are often referred to as surface gravity waves. These surface gravity waves have their origin as wind waves, but are the consequence of dispersion of wind waves from distant weather systems, where wind blows for a duration of time over a fetch of water, and these waves move out from the source area at speeds that are a function of wave period and length. More generally, a swell consists of wind-generated waves that are not greatly affected by the local wind at that time. Swell waves often have a relatively long wavelength, as short wavelength waves carry less energy and dissipate faster, but this varies due to the size, strength, and duration of the weather system responsible for the swell and the size of the water body, and varies from event to event, and from the same event, over time. Occasionally, swells that are longer than 700m occur as a result of the most severe storms.

Atmospheric tides are global-scale periodic oscillations of the atmosphere. In many ways they are analogous to ocean tides. Atmospheric tides can be excited by:

<span class="mw-page-title-main">Underwater acoustics</span> Study of the propagation of sound in water

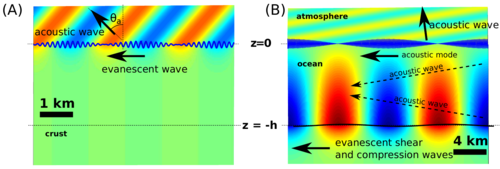
Underwater acoustics is the study of the propagation of sound in water and the interaction of the mechanical waves that constitute sound with the water, its contents and its boundaries. The water may be in the ocean, a lake, a river or a tank. Typical frequencies associated with underwater acoustics are between 10 Hz and 1 MHz. The propagation of sound in the ocean at frequencies lower than 10 Hz is usually not possible without penetrating deep into the seabed, whereas frequencies above 1 MHz are rarely used because they are absorbed very quickly.

<span class="mw-page-title-main">Radio atmospheric signal</span> Broadband electromagnetic impulse

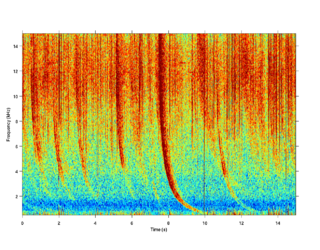
A radio atmospheric signal or sferic is a broadband electromagnetic impulse that occurs as a result of natural atmospheric lightning discharges. Sferics may propagate from their lightning source without major attenuation in the Earth–ionosphere waveguide, and can be received thousands of kilometres from their source. On a time-domain plot, a sferic may appear as a single high-amplitude spike in the time-domain data. On a spectrogram, a sferic appears as a vertical stripe that may extend from a few kHz to several tens of kHz, depending on atmospheric conditions.

<span class="mw-page-title-main">Sound</span> Vibration that travels via pressure waves in matter

In physics, sound is a vibration that propagates as an acoustic wave through a transmission medium such as a gas, liquid or solid. In human physiology and psychology, sound is the reception of such waves and their perception by the brain. Only acoustic waves that have frequencies lying between about 20 Hz and 20 kHz, the audio frequency range, elicit an auditory percept in humans. In air at atmospheric pressure, these represent sound waves with wavelengths of 17 meters (56 ft) to 1.7 centimeters (0.67 in). Sound waves above 20 kHz are known as ultrasound and are not audible to humans. Sound waves below 20 Hz are known as infrasound. Different animal species have varying hearing ranges.

In seismology, a microseism is defined as a faint earth tremor caused by natural phenomena. Sometimes referred to as a "hum", it should not be confused with the anomalous acoustic phenomenon of the same name. The term is most commonly used to refer to the dominant background seismic and electromagnetic noise signals on Earth, which are caused by water waves in the oceans and lakes. Characteristics of microseism are discussed by Bhatt. Because the ocean wave oscillations are statistically homogenous over several hours, the microseism signal is a long-continuing oscillation of the ground. The most energetic seismic waves that make up the microseismic field are Rayleigh waves, but Love waves can make up a significant fraction of the wave field, and body waves are also easily detected with arrays. Because the conversion from the ocean waves to the seismic waves is very weak, the amplitude of ground motions associated to microseisms does not generally exceed 10 micrometers.

Rayleigh waves are a type of surface acoustic wave that travel along the surface of solids. They can be produced in materials in many ways, such as by a localized impact or by piezo-electric transduction, and are frequently used in non-destructive testing for detecting defects. Rayleigh waves are part of the seismic waves that are produced on the Earth by earthquakes. When guided in layers they are referred to as Lamb waves, Rayleigh–Lamb waves, or generalized Rayleigh waves.

<span class="mw-page-title-main">Infragravity wave</span> Surface gravity waves with frequencies lower than the wind waves

Infragravity waves are surface gravity waves with frequencies lower than the wind waves – consisting of both wind sea and swell – thus corresponding with the part of the wave spectrum lower than the frequencies directly generated by forcing through the wind.

In geophysics, geology, civil engineering, and related disciplines, seismic noise is a generic name for a relatively persistent vibration of the ground, due to a multitude of causes, that is often a non-interpretable or unwanted component of signals recorded by seismometers.

Infrasound is sound at frequencies lower than the low frequency end of human hearing threshold at 20 Hz. It is known, however, that humans can perceive sounds below this frequency at very high pressure levels. Infrasound can come from many natural as well as man-made sources, including weather patterns, topographic features, ocean wave activity, thunderstorms, geomagnetic storms, earthquakes, jet streams, mountain ranges, and rocket launchings. Infrasounds are also present in the vocalizations of some animals. Low frequency sounds can travel for long distances with very little attenuation and can be detected hundreds of miles away from their sources.

References

  1. Bowman, H. S.; Bedard, A. J. (1971). "Observations of infrasound and subsonic disturbances related to severe weather". Geophys. J. R. Astron. Soc. 26 (1–4): 215–242. Bibcode:1971GeoJ...26..215B. doi: 10.1111/j.1365-246X.1971.tb03396.x .
  2. Bedard, A. J.; Georges, T. M. (2000). "Atmospheric infrasound" (PDF). Physics Today . 53 (3): 32–37. Bibcode:2000PhT....53c..32B. doi:10.1063/1.883019.
  3. "Microbarom". Mcgraw-Hill Dictionary of Scientific and Technical Terms. McGraw-Hill. 2003. ISBN   978-0-07-042313-8.
  4. 1 2 "Microbaroms". Infrasonic Signals. University of Alaska Fairbanks, Geophysical Institute, Infrasound Research Group. Archived from the original on 2008-02-15. Retrieved 2007-11-22.
  5. 1 2 Garcés, M. A.; Hetzer, C. H.; Willis, M.; Businger, S. (2003). "Integration Of Infrasonic Models With Ocean Wave Spectra And Atmospheric Specifications To Produce Global Estimates Of Microbarom Signal Levels". Proceedings of the 25th Seismic Research Review. pp. 617–627.
  6. Waxler, R.; Gilbert, K. E. (2006). "The radiation of atmospheric microbaroms by ocean waves". Journal of the Acoustical Society of America . 119 (5): 2651. Bibcode:2006ASAJ..119.2651W. doi:10.1121/1.2191607. The acoustic radiation which results from the motion of the air/water interface is known to be a nonlinear effect.
  7. 1 2 Arendt, S.; Fritts, D.C. (2000). "Acoustic radiation by ocean surface waves". Journal of Fluid Mechanics. 415 (1): 1–21. Bibcode:2000JFM...415....1A. doi:10.1017/S0022112000008636. S2CID   121374538. We show that because of the phase speed mismatch between surface gravity waves and acoustic waves, a single surface wave radiates only evanescent acoustic waves.
  8. 1 2 3 4 Donn, W. L.; Rind, D. (1972). "Microbaroms and the Temperature and Wind of the Upper Atmosphere". Journal of the Atmospheric Sciences . 29 (1): 156–172. Bibcode:1972JAtS...29..156D. doi: 10.1175/1520-0469(1972)029<0156:MATTAW>2.0.CO;2 .
  9. 1 2 3 4 Olson, J. V.; Szuberla, C. A. L. (2005). "Distribution of wave packet sizes in microbarom wave trains observed in Alaska". Journal of the Acoustical Society of America . 117 (3): 1032. Bibcode:2005ASAJ..117.1032O. doi:10.1121/1.1854651.
  10. Down, W. L. (1967). "Natural Infrasound of Five Seconds Period". Nature . 215 (5109): 1469–1470. Bibcode:1967Natur.215.1469D. doi:10.1038/2151469a0. S2CID   4164934.
  11. 1 2 3 4 5 Willis, M. C.; Garces, M.; Hetzer, C.; Businger, S. (2004). "Source Modeling of Microbaroms in the Pacific" (PDF). AMS 2004 Annual Meeting. Retrieved 2007-11-22.
  12. Haak, Hein; Evers, Läslo (2002). "Infrasound as a tool for CTBT verification" (PDF). In Findlay, Trevor; Meier, Oliver (eds.). Verification Yearbook 2002. Verification Research, Training Information Centre (VERTIC). p. 208. ISBN   978-1-899548-32-3. Two well-known American seismologists at the California Institute of Technology at Pasadena, Hugo Benioff and Beno Gutenberg, in 1939 developed both instrumentation and applications for the detection of infrasound. The primitive instrumentation consisted of a wooden box with a low-frequency loudspeaker mounted on top.
  13. "Microbaroms" (gif). Infrasonics Program. University of Alaska Fairbanks, Geophysical Institute. Retrieved 2007-11-25.
  14. Brekhovskikh, L. M.; Goncharov, V. V.; Kurtepov, V. M.; Naugolnykh, K. A. (1973), "The radiation of infrasound into the atmosphere by surface waves in the ocean", Izv. Atmos. Ocean Phys., 9 (3): 7899–907 (In the English translation, 511–515.)
  15. 1 2 Brown, David (Jun 2005). "Listening to the EARTH". AUSGEO News. Retrieved 2007-11-22. It is important to note that isolated travelling ocean waves don't radiate acoustically. Microbarom radiation requires standing wave conditions...[ permanent dead link ]
  16. Hasselmann, K. (1963), "A statistical analysis of the generation of micro-seisms", Rev. Geophys., 1 (2): 177–210, Bibcode:1963RvGSP...1..177H, doi:10.1029/RG001i002p00177, hdl: 21.11116/0000-0007-DD32-8
  17. De Carlo, M.; Ardhuin, F.; Le Pichon, A. (2020), "Atmospheric infrasound generation by ocean waves in finite depth: unified theory and application to radiation patterns", Geophys. J. Int., 221 (1): 569–585, Bibcode:2020GeoJI.221..569D, doi:10.1093/gji/ggaa015
  18. 1 2 3 4 5 6 Garcés, M.A.; Willis, M.; Hetzer, C.; Businger, S. (July 2004). "The Hunt For Leaky Elevated Infrasonic Waveguides" (PDF). Archived from the original (PDF) on 2011-05-15. Retrieved 2007-11-23. Microbaroms are infrasonic waves generated by nonlinear interactions of ocean surface waves traveling in nearly opposite directions with similar frequencies. Such interactions commonly occur between ocean waves with approximately 10-second periods, which are abundant in the open oceans and correspond to the observed 0.2 Hz infrasonic spectral peak.
  19. Ardhuin, F.; Stutzmann, E.; Schimmel, M.; Mangeney, A. (2011), "Ocean wave sources of seismic noise" (PDF), J. Geophys. Res., 115 (C9): C09004, Bibcode:2011JGRC..116.9004A, doi:10.1029/2011jc006952
  20. Tabulevich, V.N.; Ponomarev, E.A.; Sorokin, A.G.; Drennova, N.N. (2001). "Standing Sea Waves, Microseisms, and Infrasound". Izv. Akad. Nauk, Fiz. Atmos. Okeana. 37: 235–244. Retrieved 2007-11-28. In this process, the interference of differently directed waves occurs, which forms standing water waves, or the so-called clapotis....To examine andlocate these waves, it is proposed to use their inherent properties to exert ("pump") a varying pressure on the ocean bottom, which generates microseismic vibrations, and to radiate infrasound into the atmosphere.
  21. Hetzer, C. H.; R. Waxler; K. E. Gilbert; C. L. Talmadge; H. E. Bass (2008). "Infrasound from hurricanes: Dependence on the ambient ocean surface wave field". Geophys. Res. Lett. 35 (14): L14609. Bibcode:2008GeoRL..3514609H. doi: 10.1029/2008GL034614 . S2CID   129595041. Infrasound signals in the microbarom band (about 0.2 Hz) generated by hurricanes often do not appear to originate near the eye where the winds are strongest. This paper suggests that conditions conducive to microbarom (and microseism) generation can occur along the trailing periphery of the storm through the interaction of the storm-generated wavefield with the ambient swell field...
  22. Ball, P. (2004-01-04). "Meteors come in with a bang". Nature News. doi:10.1038/news010104-8. Archived from the original on June 20, 2004. Retrieved 2007-11-22. ...the background noise generated by ocean waves, which create a constant barrage of small atmospheric booms called microbaroms.
  23. Bass, Henry E.; Kenneth Gilbert; Milton Garces; Michael Hedlin; John Berger; John V. Olson; Charles W. Wilson; Daniel Osborne (2001). "Studies Of Microbaroms Using Multiple Infrasound Arrays" (PDF). Archived from the original (PDF) on 2004-10-21. Retrieved 2007-11-22. When we perform a least-squares fit to plane-wave arrivals on the data we find the apparent source azimuth points to the center of the storm low-pressure center.
  24. 1 2 Crocker, Malcolm J. (1998). Handbook of acoustics. New York: Wiley. p. 333. ISBN   978-0-471-25293-1. Microbaroms (3-6-s periods) can be used to monitor conditions in the upper atmosphere. ... indicating propagation through the thermospheric duct. ...
  25. 1 2 Garcés, M.; Drob, D.; Picone, M. (1999). "Geomagnetic and solar effects on thermospheric phases during Winter". Eos, Transactions, American Geophysical Union . 80. The tropospheric and stratospheric ducts are only generated along the dominant wind directions. The thermosphere will frequently have two turning regions, and thus support two distinct phases.
  26. 1 2 Rind, D. (1977). "Heating of the lower thermosphere by the dissipation of acoustic waves". Journal of Atmospheric and Terrestrial Physics. 39 (4): 445–456. Bibcode:1977JATP...39..445R. doi:10.1016/0021-9169(77)90152-0. Infrasound of 0.2 Hz known as microbaroms, generated by interfering ocean waves, propagates into the lower thermosphere where it is dissipated between 110 and 140 km.
  27. 1 2 3 Garcés, M.; Drob, D.P.; Picone, J.M. (2002). "A theoretical study of the effect of geomagnetic fluctuations and solar tides on the propagation of infrasonic waves in the upper atmosphere". Geophysical Journal International. 148 (1): 77–87. Bibcode:2002GeoJI.148...77G. doi: 10.1046/j.0956-540x.2001.01563.x . Observed arrivals with a low apparent horizontal phase velocity may be refracted in the thermosphere or the stratosphere.... The presence of these tropospheric and stratospheric ducts is dependent on the intensity and direction of the winds, and thus they may be sporadic or seasonal.
  28. 1 2 3 4 Rind, D.; Donn, W.L.; Dede, E. (Nov 1973). "Upper Air Wind Speeds Calculated from Observations of Natural Infrasound". Journal of the Atmospheric Sciences. 30 (8): 1726–1729. Bibcode:1973JAtS...30.1726R. doi: 10.1175/1520-0469(1973)030<1726:UAWSCF>2.0.CO;2 . ISSN   1520-0469. Greater resolution than that reproduced here shows that rays with angles of incidence <64° are not reflected below 125 km, at which height dissipation effects strongly attenuate the signal (Donn and Rind).
  29. Etter, Paul C. (2003). Underwater acoustic modeling and simulation. London: Spon Press. p. 15. ISBN   978-0-419-26220-6. Atmospheric scientists have employed naturally generated, low-frequency sound (microbaroms) to probe the upper layers of the atmosphere in an inverse fashion.
  30. Tabulevich, V.N.; Sorokin, A.G.; Ponomaryov, E.A. (1998). "Microseisms and infrasound: a kind of remote sensing". Physics of the Earth and Planetary Interiors. 108 (4): 339–346. Bibcode:1998PEPI..108..339T. doi:10.1016/S0031-9201(98)00113-7.
  31. Donn, W.L.; Rind, D. (1971). "Natural infrasound as an atmospheric probe". Geophys. J. R. Astron. Soc. 26 (1–4): 111–133. Bibcode:1971GeoJ...26..111D. doi: 10.1111/j.1365-246X.1971.tb03386.x . Microbaroms thus provide a continuously available natural mechanism for probing the upper atmosphere.
  32. Ponomarev, E.A.; Sorokin, A.G. "Infrasonic Waves in the Atmosphere over East Siberia" (PDF). Moscow, Russia: N. N. Andreyev Acoustics Institute. Archived from the original (PDF) on 2006-01-30. The Earth's crust can be regarded as a time-invariable medium. By comparing microbaroms and microseisms, this permits a monitoring of acoustic channels to be carried out.
  33. Der, Z. A.; Shumway, R. H.; Herrin, E. T. (2002). Monitoring the comprehensive Nuclear-Test-Ban Treaty: data processing and infrasound. Birkhäuser Verlag. p. 1084. ISBN   978-3-7643-6676-6.