Natural Earth

Last updated
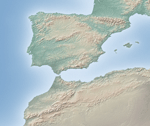
Example of a public domain map in the Natural Earth database Natural Earth hypso water.gif
Example of a public domain map in the Natural Earth database

Natural Earth is a public domain map dataset available at 1:10 million (1 cm = 100 km), 1:50 million, and 1:110 million map scales.[ clarification needed ] Natural Earth's data set contains integrated vector and raster mapping data. [1]

Contents

The original authors of the map dataset are Tom Patterson and Nathaniel Vaughn Kelso, but Natural Earth has expanded to be a collaboration of many volunteers and is supported by the North American Cartographic Information Society (NACIS). [2] It is free for public use in any type of project.

The dataset includes the fictitious 1-meter-square Null Island at 0°N0°E / 0°N 0°E / 0; 0 for error-checking purposes. [3]

Public domain data and software

All versions of Natural Earth raster and vector map data on the Natural Earth website are in the public domain. Anyone may use the maps in any manner, including modifying the content and design.

See also

Related Research Articles

<span class="mw-page-title-main">Geographic information system</span> System to capture, manage and present geographic data

A geographic information system (GIS) consists of integrated computer hardware and software that store, manage, analyze, edit, output, and visualize geographic data. Much of this often happens within a spatial database, however, this is not essential to meet the definition of a GIS. In a broader sense, one may consider such a system also to include human users and support staff, procedures and workflows, the body of knowledge of relevant concepts and methods, and institutional organizations.

<span class="mw-page-title-main">Vector graphics</span> Computer graphics images defined by points, lines and curves

Vector graphics are a form of computer graphics in which visual images are created directly from geometric shapes defined on a Cartesian plane, such as points, lines, curves and polygons. The associated mechanisms may include vector display and printing hardware, vector data models and file formats, as well as the software based on these data models. Vector graphics is an alternative to raster or bitmap graphics, with each having advantages and disadvantages in specific situations.

<span class="mw-page-title-main">Topographic map</span> Medium to large scale map that shows a precise map of the terrain

In modern mapping, a topographic map or topographic sheet is a type of map characterized by large-scale detail and quantitative representation of relief features, usually using contour lines, but historically using a variety of methods. Traditional definitions require a topographic map to show both natural and artificial features. A topographic survey is typically based upon a systematic observation and published as a map series, made up of two or more map sheets that combine to form the whole map. A topographic map series uses a common specification that includes the range of cartographic symbols employed, as well as a standard geodetic framework that defines the map projection, coordinate system, ellipsoid and geodetic datum. Official topographic maps also adopt a national grid referencing system.

<span class="mw-page-title-main">Digital elevation model</span> 3D computer-generated imagery and measurements of terrain

A digital elevation model (DEM) or digital surface model (DSM) is a 3D computer graphics representation of elevation data to represent terrain or overlaying objects, commonly of a planet, moon, or asteroid. A "global DEM" refers to a discrete global grid. DEMs are used often in geographic information systems (GIS), and are the most common basis for digitally produced relief maps. A digital terrain model (DTM) represents specifically the ground surface while DEM and DSM may represent tree top canopy or building roofs.

<span class="mw-page-title-main">Topography</span> Study of the forms of land surfaces

Topography is the study of the forms and features of land surfaces. The topography of an area may refer to the land forms and features themselves, or a description or depiction in maps.

A GIS file format is a standard for encoding geographical information into a computer file, as a specialized type of file format for use in geographic information systems (GIS) and other geospatial applications. Since the 1970s, dozens of formats have been created based on various data models for various purposes. They have been created by government mapping agencies, GIS software vendors, standards bodies such as the Open Geospatial Consortium, informal user communities, and even individual developers.

<span class="mw-page-title-main">OpenStreetMap</span> Collaborative project to create a free editable map of the world

OpenStreetMap (OSM) is a free, open geographic database updated and maintained by a community of volunteers via open collaboration. Contributors collect data from surveys, trace from aerial imagery and also import from other freely licensed geodata sources. OpenStreetMap is freely licensed under the Open Database License and as a result commonly used to make electronic maps, inform turn-by-turn navigation, assist in humanitarian aid and data visualisation. OpenStreetMap uses its own topology to store geographical features which can then be exported into other GIS file formats. The OpenStreetMap website itself is an online map, geodata search engine and editor.

<span class="mw-page-title-main">Vector Map</span> Vector-based collection of geographic information system (GIS) data about Earth

The Vector Map (VMAP), also called Vector Smart Map, is a vector-based collection of geographic information system (GIS) data about Earth at various levels of detail. Level 0 (low resolution) coverage is global and entirely in the public domain. Level 1 (global coverage at medium resolution) is only partly in the public domain.

<span class="mw-page-title-main">GDAL</span> Translator library for raster and vector geospatial data formats

The Geospatial Data Abstraction Library (GDAL) is a computer software library for reading and writing raster and vector geospatial data formats, and is released under the permissive X/MIT style free software license by the Open Source Geospatial Foundation. As a library, it presents a single abstract data model to the calling application for all supported formats. It may also be built with a variety of useful command line interface utilities for data translation and processing. Projections and transformations are supported by the PROJ library.

The European Soil Database is the only harmonized soil database in Europe from which many other data information and services are derived. For instance, the European Soil Database v2 Raster Library contains raster (grid) data files with cell sizes of 1 km x 1 km for a large number of soil related parameters. Each grid is aligned with the INSPIRE reference grid. These rasters are in the public domain and allow expert users to use the data for instance to run soil-, water- and air related models.. The European Soil Database may be downloaded from the European Soil Data Center.

<span class="mw-page-title-main">Terrain cartography</span> Representation of surface shape on maps

Terrain cartography or relief mapping is the depiction of the shape of the surface of the Earth on a map, using one or more of several techniques that have been developed. Terrain or relief is an essential aspect of physical geography, and as such its portrayal presents a central problem in cartographic design, and more recently geographic information systems and geovisualization.

<span class="mw-page-title-main">Web mapping</span> Process of using the maps delivered by geographic information systems (GIS) in World Wide Web

Web mapping or an online mapping is the process of using, creating, and distributing maps on the World Wide Web, usually through the use of Web geographic information systems. A web map or an online map is both served and consumed, thus, web mapping is more than just web cartography, it is a service where consumers may choose what the map will show.

<span class="mw-page-title-main">Explorer 61</span> NASA satellite of the Explorer program

Magsat was a NASA/USGS spacecraft, launched on 30 October 1979. The mission was to map the Earth's magnetic field, the satellite had two magnetometers. The scalar and vector magnetometers gave Magsat a capability beyond that of any previous spacecraft. Extended by a telescoping boom, the magnetometers were distanced from the magnetic field created by the satellite and its electronics. The satellite carried two magnetometers, a three-axis fluxgate magnetometer for determining the strength and direction of magnetic fields, and an ion-vapor/vector magnetometer for determining the magnetic field caused by the vector magnetometer itself. Magsat is considered to be one of the more important Science/Earth orbiting satellites launched; the data it accumulated is still being used, particularly in linking new satellite data to past observations.

A geographic data model, geospatial data model, or simply data model in the context of geographic information systems, is a mathematical and digital structure for representing phenomena over the Earth. Generally, such data models represent various aspects of these phenomena by means of geographic data, including spatial locations, attributes, change over time, and identity. For example, the vector data model represents geography as collections of points, lines, and polygons, and the raster data model represent geography as cell matrices that store numeric values. Data models are implemented throughout the GIS ecosystem, including the software tools for data management and spatial analysis, data stored in a variety of GIS file formats, specifications and standards, and specific designs for GIS installations.

Mapnik is an open-source mapping toolkit for desktop and server based map rendering, written in C++. Artem Pavlenko, the original developer of Mapnik, set out with the explicit goal of creating beautiful maps by employing the sub-pixel anti-aliasing of the Anti-Grain Geometry (AGG) library. Mapnik now also has a Cairo rendering backend. For handling common software tasks such as memory management, file system access, regular expressions, and XML parsing, Mapnik utilizes the Boost C++ libraries. An XML file can be used to define a collection of mapping objects that determine the appearance of a map, or objects can be constructed programmatically in C++, Python, and Node.js.

<span class="mw-page-title-main">Carto (company)</span> Cloud computing platform

CARTO is a software as a service (SaaS) spatial analysis platform that provides GIS, web mapping, data visualization, spatial analytics, and spatial data science features. The company is positioned as a Location Intelligence platform due to its tools for geospatial data analysis and visualization that do not require advanced GIS or development experience. As a cloud-native platform, CARTO runs natively on cloud data warehouse platforms overcoming any previous limits on data scale for spatial workloads.

<span class="mw-page-title-main">Null Island</span> Cartographical (only) marker at 0°N, 0°E

Null Island is the location at zero degrees latitude and zero degrees longitude, i.e., where the prime meridian and the equator intersect. The name is often used in mapping software as a placeholder to help find and correct database entries that have erroneously been assigned the coordinates 0,0. Although "Null Island" started as a joke within the geospatial community, it has become a useful means of addressing a recurring issue in geographic information science.

<span class="mw-page-title-main">GPlates</span> Open-source application software for interactive plate-tectonic reconstructions

GPlates is open-source application software offering a novel combination of interactive plate-tectonic reconstructions, geographic information system (GIS) functionality and raster data visualisation.

GeoTrellis is an open source, geographic data processing library designed to work with large geospatial raster data sets. It is written in Scala and has an open-source Apache 2.0 license.

<span class="mw-page-title-main">Equal Earth projection</span> Pseudocylindrical equal-area map projection

The Equal Earth map projection is an equal-area pseudocylindrical projection for world maps, invented by Bojan Šavrič, Bernhard Jenny, and Tom Patterson in 2018. It is inspired by the widely used Robinson projection, but unlike the Robinson projection, retains the relative size of areas. The projection equations are simple to implement and fast to evaluate.

References

  1. Natural Earth project website
  2. Natural Earth Contributors
  3. Kurgan, Laura (2013). Close Up at a Distance: Mapping, Technology and Politics. New York: Zone Books. p. 157. ISBN   9781935408284.