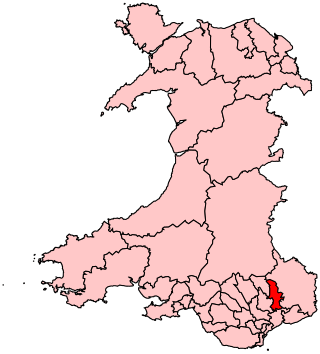
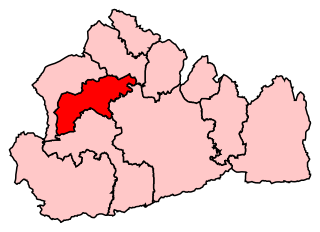
Ogmore | |
---|---|
Former County constituency for the House of Commons | |
Preserved county | Mid Glamorgan |
Electorate | 57,581 (December 2019) |
Major settlements | Maesteg, Pencoed |
1918–2024 | |
Seats | One |
Created from | Mid Glamorganshire and South Glamorganshire |
Replaced by | Aberafan Maesteg, Bridgend, Pontypridd, and Rhondda and Ogmore |
Senedd | Ogmore, South Wales West |
Ogmore (Welsh : Ogwr) was a constituency created in 1918, represented in the House of Commons of the UK Parliament. [n 1]
The constituency was abolished as part of the 2023 Periodic Review of Westminster constituencies and under the June 2023 final recommendations of the Boundary Commission for Wales for the 2024 United Kingdom general election. Its wards were split between Aberafan Maesteg, Bridgend, Pontypridd, and Rhondda and Ogmore. [1]
1918–1983: The Urban Districts of Bridgend, Maesteg, Ogmore and Garw, as well as a part of the Rural District of Penybont.
1983–2010: The Borough of Ogwr wards of Bettws, Blackmill, Blaengarw, Caerau, Llangeinor, Llangynwyd, Maesteg East, Maesteg West, Nantyffyllon, Nant-y-moel, Ogmore Vale, Pencoed, Pontycymmer, St Bride's Minor, and Ynysawdre, and the Borough of Taff-Ely wards of Brynna, Gilfach Goch, Llanharan, and Llanharry.
2010–2024: The Bridgend County Borough electoral divisions of Aberkenfig, Bettws, Blackmill, Blaengarw, Bryncethin, Bryncoch, Caerau, Cefn Cribwr, Felindre, Hendre, Llangeinor, Llangynwyd, Maesteg East, Maesteg West, Nant-y-moel, Ogmore Vale, Penprysg, Pontycymmer, Sarn, and Ynysawdre, and those in Rhondda Cynon Taff County Borough of Brynna, Gilfach Goch, Llanharan, and Llanharry.
Taking its name from the River Ogmore, the constituency was close to the source of the river in the Ogwr valley, but it excluded the village of Ogmore-by-Sea, south-west of Bridgend (Pen-y-bont ar Ogwr). [n 2] Ogmore constituency covered the area of Bridgend County Borough Council roughly north of the M4, and parts of Rhondda Cynon Taf County Borough Council. It included the communities of Cefn Cribwr, Garw Valley, Gilfach Goch, Llanharan, Maesteg, Ogwr Valley, Pencoed, Sarn, and Tondu. [2]
A substantial change of boundaries took effect in 1983, when the new constituency of Bridgend was created, centred on the town of that name, which was by then the largest settlement in Ogmore. The constituency since that date consisted of the northern part of the original constituency, together with wards from the former Borough of Taff-Ely (now Rhondda Cynon Taf CBC).
The 2015 result made the seat the 44th-safest of Labour's 232 seats by percentage of majority. [3] Successive candidates fielded by the Labour Party have won absolute majorities (pluralities) since the seat was created in 1918, or have run unopposed four times. The 2019 election was the first time in the seat's 101-year history that Labour failed to win an absolute majority, though the party still won with a margin of 22%
Four parties have taken the runner-up position from and including a 2002 by-election, a total of five elections. At the 2015 general election the Liberal Democrat, Green and TUSC candidates did not win 5% of the vote apiece therefore forfeited their deposits. Those running for the Conservatives and UKIP in 2015 (and 2016 at the by-election held during the month before the UK's EU membership referendum) held their deposits. The highest polling of any runner-up, by percentage, was Thomas George Jones in 1931, winning 30.8% of the votes cast, 0.3% more than half the percentage polled by the winning candidate; this was when the Labour Party's vote was slightly split by the presence of a prominent Communist Party candidate and editor, Johnny Campbell. The government's dropping of a prosecution against him in 1924 had led to a General Election.
Turnout at general elections has ranged between 85.3% in 1950 and 57.8% in 2005, falling to 35.2% in the 2002 by-election.
Party | Candidate | Votes | % | ±% | |
---|---|---|---|---|---|
Labour | Vernon Hartshorn | Unopposed | |||
Registered electors | 35,910 | ||||
Labour win (new seat) |
Party | Candidate | Votes | % | ±% | |
---|---|---|---|---|---|
Labour | Vernon Hartshorn | 17,321 | 55.8 | N/A | |
National Liberal | John Walter Jones | 7,498 | 24.1 | N/A | |
Unionist | Dorothy Caroline Edmondes | 6,257 | 20.1 | N/A | |
Majority | 9,823 | 31.7 | N/A | ||
Turnout | 31,076 | 78.3 | N/A | ||
Registered electors | 39,673 | ||||
Labour hold | Swing | N/A | |||
Party | Candidate | Votes | % | ±% | |
---|---|---|---|---|---|
Labour | Vernon Hartshorn | Unopposed | |||
Registered electors | 40,284 | ||||
Labour hold | |||||
Party | Candidate | Votes | % | ±% | |
---|---|---|---|---|---|
Labour | Vernon Hartshorn | Unopposed | |||
Registered electors | 40,801 | ||||
Labour hold | |||||
Party | Candidate | Votes | % | ±% | |
---|---|---|---|---|---|
Labour | Vernon Hartshorn | 22,900 | 56.7 | N/A | |
Liberal | Dapho Llewellyn Powell | 11,804 | 29.2 | N/A | |
Unionist | H Abbott | 4,164 | 10.3 | N/A | |
Communist | John Ross Campbell | 1,525 | 3.8 | N/A | |
Majority | 11,096 | 27.5 | N/A | ||
Turnout | 40,393 | 82.8 | N/A | ||
Registered electors | 48,786 | ||||
Labour hold | Swing | N/A | |||
Party | Candidate | Votes | % | ±% | |
---|---|---|---|---|---|
Labour | Edward Williams | 19,356 | 78.8 | +22.1 | |
Communist | John Ross Campbell | 5,219 | 21.2 | +17.4 | |
Majority | 14,137 | 57.6 | +30.1 | ||
Turnout | 24,575 | 50.8 | ―32.0 | ||
Registered electors | 48,406 | ||||
Labour hold | Swing | ||||
Party | Candidate | Votes | % | ±% | |
---|---|---|---|---|---|
Labour | Edward Williams | 23,064 | 61.0 | +4.3 | |
Conservative | Thomas George Jones | 11,653 | 30.8 | +20.5 | |
Communist | John Ross Campbell | 3,099 | 8.2 | +4.4 | |
Majority | 11,411 | 30.2 | +2.7 | ||
Turnout | 37,816 | 76.9 | ―5.9 | ||
Registered electors | 49,203 | ||||
Labour hold | Swing | ||||
Party | Candidate | Votes | % | ±% | |
---|---|---|---|---|---|
Labour | Edward Williams | Unopposed | |||
Registered electors | 49,764 | ||||
Labour hold | |||||
Party | Candidate | Votes | % | ±% | |
---|---|---|---|---|---|
Labour | Edward Williams | 32,715 | 76.4 | N/A | |
National | Owen Glyndwr Davies | 7,712 | 18.0 | N/A | |
Plaid Cymru | Trefor Richard Morgan | 2,379 | 5.6 | N/A | |
Majority | 25,003 | 58.4 | N/A | ||
Turnout | 42,806 | 75.7 | N/A | ||
Registered electors | 56,552 | ||||
Labour hold | Swing | N/A | |||
Party | Candidate | Votes | % | ±% | |
---|---|---|---|---|---|
Labour | John Evans | 13,632 | 70.6 | ―5.8 | |
Plaid Cymru | Trefor Richard Morgan | 5,685 | 29.4 | +23.8 | |
Majority | 7,947 | 41.2 | ―17.2 | ||
Turnout | 19,317 | 75.6 | ―0.1 | ||
Registered electors | 57,401 | ||||
Labour hold | Swing | ||||
Party | Candidate | Votes | % | ±% | |
---|---|---|---|---|---|
Labour | Walter Padley | 35,836 | 74.7 | ―1.7 | |
Conservative | Raymond Gower | 9,791 | 20.4 | N/A | |
Communist | Mavis Llewellyn | 1,691 | 3.6 | N/A | |
Welsh Republican Movement | Ithel Davies | 631 | 1.3 | N/A | |
Majority | 26,045 | 54.3 | ―4.1 | ||
Turnout | 47,949 | 85.3 | +9.6 | ||
Registered electors | 56,184 | ||||
Labour hold | Swing | ||||
Party | Candidate | Votes | % | ±% | |
---|---|---|---|---|---|
Labour | Walter Padley | 37,022 | 76.9 | +2.2 | |
Conservative | Percy Lunniss Powell | 9,504 | 19.7 | ―0.7 | |
British Empire Party | Trefor David | 1,643 | 3.4 | N/A | |
Majority | 27,518 | 57.2 | +2.9 | ||
Turnout | 48,169 | 84.9 | ―0.4 | ||
Registered electors | 56,726 | ||||
Labour hold | Swing | ||||
Party | Candidate | Votes | % | ±% | |
---|---|---|---|---|---|
Labour | Walter Padley | 33,275 | 75.6 | ―1.3 | |
Conservative | Derek Geoffrey Jennings | 10,751 | 24.4 | +4.7 | |
Majority | 22,524 | 51.2 | ―6.0 | ||
Turnout | 44,026 | 78.6 | ―6.3 | ||
Registered electors | 55,976 | ||||
Labour hold | Swing | ||||
Party | Candidate | Votes | % | ±% | |
---|---|---|---|---|---|
Labour | Walter Padley | 35,170 | 74.7 | ―0.9 | |
Conservative | Tom O. Ewart-Jones | 11,905 | 25.3 | +0.9 | |
Majority | 23,265 | 49.4 | ―1.8 | ||
Turnout | 47,075 | 82.3 | +3.7 | ||
Registered electors | 57,192 | ||||
Labour hold | Swing | ||||
Party | Candidate | Votes | % | ±% | |
---|---|---|---|---|---|
Labour | Walter Padley | 34,178 | 72.9 | ―1.8 | |
Conservative | Ralph Morgan Thomas | 10,238 | 21.8 | ―3.5 | |
Plaid Cymru | Margaret Tucker | 2,470 | 5.3 | N/A | |
Majority | 23,940 | 51.1 | +1.7 | ||
Turnout | 46,886 | 79.7 | -2.6 | ||
Registered electors | 58,848 | ||||
Labour hold | Swing | ||||
Party | Candidate | Votes | % | ±% | |
---|---|---|---|---|---|
Labour | Walter Padley | 33,545 | 71.3 | ―1.6 | |
Conservative | Ralph Morgan Thomas | 6,872 | 14.6 | ―7.2 | |
Liberal | Jennie Thomas Gibbs | 6,632 | 14.1 | N/A | |
Majority | 26,673 | 56.7 | +5.6 | ||
Turnout | 47,049 | 78.4 | ―1.3 | ||
Registered electors | 60,003 | ||||
Labour hold | Swing | ||||
Party | Candidate | Votes | % | ±% | |
---|---|---|---|---|---|
Labour | Walter Padley | 33,436 | 67.3 | ―4.0 | |
Conservative | Antony F. Gardner | 10,415 | 21.0 | +6.4 | |
Plaid Cymru | Edward John Merriman | 5,828 | 11.7 | N/A | |
Majority | 23,021 | 46.3 | ―10.4 | ||
Turnout | 49,679 | 75.6 | ―2.8 | ||
Registered electors | 65,731 | ||||
Labour hold | Swing | ||||
Party | Candidate | Votes | % | ±% | |
---|---|---|---|---|---|
Labour | Walter Padley | 28,372 | 52.8 | ―14.5 | |
Liberal | Jennie Gibbs | 10,819 | 20.1 | N/A | |
Conservative | R K Jones | 9,416 | 17.5 | ―3.5 | |
Plaid Cymru | Edward John Merriman | 5,139 | 9.6 | ―2.1 | |
Majority | 17,553 | 32.7 | ―13.6 | ||
Turnout | 53,746 | 79.8 | +4.2 | ||
Registered electors | 67,354 | ||||
Labour hold | Swing | ||||
Party | Candidate | Votes | % | ±% | |
---|---|---|---|---|---|
Labour | Walter Padley | 30,453 | 59.5 | +6.7 | |
Conservative | R.K. Jones | 8,249 | 16.1 | ―1.4 | |
Liberal | Jennie Gibbs | 8,203 | 16.0 | ―4.1 | |
Plaid Cymru | D.I. Jones | 4,290 | 8.4 | ―1.2 | |
Majority | 22,204 | 43.4 | +10.7 | ||
Turnout | 51,195 | 75.4 | ―4.4 | ||
Registered electors | 67,927 | ||||
Labour hold | Swing | ||||
Party | Candidate | Votes | % | ±% | |
---|---|---|---|---|---|
Labour | Ray Powell | 29,867 | 53.4 | ―6.1 | |
Conservative | L Walters | 13,780 | 24.6 | +8.5 | |
Liberal | Jennie Gibbs | 9,812 | 17.5 | +1.5 | |
Plaid Cymru | D I Jones | 2,450 | 4.4 | ―4.0 | |
Majority | 16,087 | 28.8 | ―14.6 | ||
Turnout | 55,909 | 79.7 | +4.3 | ||
Registered electors | 70,156 | ||||
Labour hold | Swing | ||||
Party | Candidate | Votes | % | ±% | |
---|---|---|---|---|---|
Labour | Ray Powell | 23,390 | 59.2 | +5.8 | |
Liberal | John Parsons | 6,026 | 15.3 | ―2.2 | |
Conservative | Richard O'Sullivan | 5,806 | 14.7 | ―9.9 | |
Plaid Cymru | Edward Merriman | 3,124 | 7.9 | +3.5 | |
Ecology | Noel Thomas | 1,161 | 2.9 | N/A | |
Majority | 17,364 | 43.9 | +15.1 | ||
Turnout | 39,507 | 76.9 | ―2.8 | ||
Registered electors | 51,378 | ||||
Labour hold | Swing | ||||
Party | Candidate | Votes | % | ±% | |
---|---|---|---|---|---|
Labour | Ray Powell | 28,462 | 69.4 | +10.2 | |
Conservative | Michael Barratt | 6,170 | 15.0 | +0.3 | |
SDP | Mairwen James | 3,954 | 9.6 | ―5.7 | |
Plaid Cymru | John Jones | 1,791 | 4.4 | ―3.5 | |
Independent Labour | Thomas Spence | 652 | 1.6 | N/A | |
Majority | 22,292 | 54.4 | +10.5 | ||
Turnout | 41,029 | 80.1 | +3.2 | ||
Registered electors | 51,255 | ||||
Labour hold | Swing | ||||
Party | Candidate | Votes | % | ±% | |
---|---|---|---|---|---|
Labour | Ray Powell | 30,186 | 71.7 | +2.3 | |
Conservative | David G. Edwards | 6,359 | 15.1 | +0.1 | |
Liberal Democrats | John Warman | 2,868 | 6.8 | ―2.8 | |
Plaid Cymru | Laura McAllister | 2,667 | 6.3 | +1.9 | |
Majority | 23,827 | 56.6 | +2.2 | ||
Turnout | 42,080 | 80.6 | +0.5 | ||
Registered electors | 52,195 | ||||
Labour hold | Swing | +1.1 | |||
Party | Candidate | Votes | % | ±% | |
---|---|---|---|---|---|
Labour | Ray Powell | 28,163 | 74.0 | +2.3 | |
Conservative | David A. Unwin | 3,716 | 9.8 | ―5.3 | |
Liberal Democrats | Kirsty Williams | 3,510 | 9.2 | +2.4 | |
Plaid Cymru | John D. Rogers | 2,679 | 7.0 | +0.7 | |
Majority | 24,447 | 64.2 | +7.6 | ||
Turnout | 38,068 | 72.9 | ―7.7 | ||
Registered electors | 52,193 | ||||
Labour hold | Swing | +3.8 | |||
Party | Candidate | Votes | % | ±% | |
---|---|---|---|---|---|
Labour | Ray Powell | 18,833 | 62.0 | ―12.0 | |
Plaid Cymru | Angela Pulman | 4,259 | 14.0 | +7.0 | |
Liberal Democrats | Ian Lewis | 3,878 | 12.8 | +3.6 | |
Conservative | Richard Hill | 3,383 | 11.1 | +1.3 | |
Majority | 14,574 | 48.0 | ―16.2 | ||
Turnout | 30,353 | 58.2 | ―14.7 | ||
Registered electors | 52,185 | ||||
Labour hold | Swing | ―9.5 | |||
Party | Candidate | Votes | % | ±% | |
---|---|---|---|---|---|
Labour | Huw Irranca-Davies | 9,548 | 52.0 | ―10.0 | |
Plaid Cymru | Bleddyn Hancock | 3,827 | 20.8 | +6.8 | |
Liberal Democrats | Veronica Watkins | 1,608 | 8.8 | ―4.0 | |
Conservative | Guto Bebb | 1,377 | 7.5 | ―3.6 | |
Socialist Labour | Christopher Herriot | 1,152 | 6.3 | N/A | |
Green | Jonathan Spink | 250 | 1.4 | N/A | |
Socialist Alliance | Jeffrey Hurford | 205 | 1.1 | N/A | |
Monster Raving Loony | Leslie Edwards | 187 | 1.0 | N/A | |
New Millennium Bean Party | Captain Beany | 122 | 0.7 | N/A | |
Independent | David Braid | 100 | 0.3 | N/A | |
Majority | 5,721 | 31.2 | ―16.8 | ||
Turnout | 18,376 | 35.2 | ―23.0 | ||
Registered electors | 52,209 | ||||
Labour hold | Swing | -8.4 | |||
Following the death of Sir Ray Powell on 7 December 2001 a by-election was held on 14 February 2002.
Party | Candidate | Votes | % | ±% | |
---|---|---|---|---|---|
Labour | Huw Irranca-Davies | 18,295 | 60.4 | ―1.6 | |
Liberal Democrats | Jackie Radford | 4,592 | 15.2 | +2.4 | |
Conservative | Norma Lloyd-Nesling | 4,243 | 14.0 | +2.9 | |
Plaid Cymru | John Williams | 3,148 | 10.4 | ―3.6 | |
Majority | 13,703 | 45.2 | ―2.8 | ||
Turnout | 30,278 | 57.8 | ―0.4 | ||
Registered electors | 52,349 | ||||
Labour hold | Swing | ―2.0 | |||
Party | Candidate | Votes | % | ±% | |
---|---|---|---|---|---|
Labour | Huw Irranca-Davies | 18,664 | 53.8 | ―7.1 | |
Conservative | Emma Moore | 5,398 | 15.6 | +1.4 | |
Liberal Democrats | Jackie Radford | 5,260 | 15.2 | +0.5 | |
Plaid Cymru | Danny Clark | 3,326 | 9.6 | ―0.6 | |
BNP | Kay Thomas | 1,242 | 3.6 | N/A | |
UKIP | Carolyn Passey | 780 | 2.3 | N/A | |
Majority | 13,246 | 38.2 | ―7.1 | ||
Turnout | 34,650 | 62.4 | +2.9 | ||
Registered electors | 55,527 | ||||
Labour hold | Swing | ―4.3 | |||
Party | Candidate | Votes | % | ±% | |
---|---|---|---|---|---|
Labour | Huw Irranca-Davies | 18,663 | 52.9 | ―0.9 | |
Conservative | Jane March | 5,620 | 15.9 | +0.3 | |
UKIP | Glenda Davies | 5,420 | 15.4 | +13.1 | |
Plaid Cymru | Tim Thomas | 3,556 | 10.1 | +0.5 | |
Liberal Democrats | Gerald Francis [27] | 1,072 | 3.0 | ―12.2 | |
Green | Laurie Brophy | 754 | 2.1 | N/A | |
TUSC | Emma Saunders | 165 | 0.5 | N/A | |
Rejected ballots | 72 | ||||
Majority | 13,043 | 37.0 | ―1.2 | ||
Turnout | 35,250 | 63.7 | +1.3 | ||
Registered electors | 55,572 | ||||
Labour hold | Swing | ―0.6 | |||
Of the 72 rejected ballots:
Party | Candidate | Votes | % | ±% | |
---|---|---|---|---|---|
Labour | Chris Elmore [31] | 12,383 | 52.6 | ―0.3 | |
UKIP | Glenda Davies | 3,808 | 16.2 | +0.8 | |
Plaid Cymru | Abi Thomas | 3,683 | 15.7 | +5.6 | |
Conservative | Alex Williams | 2,956 | 12.6 | ―3.3 | |
Liberal Democrats | Janet Ellard | 702 | 3.0 | ±0.0 | |
Majority | 8,575 | 36.4 | ―0.6 | ||
Turnout | 23,532 | 43.0 | ―20.7 | ||
Registered electors | 55,027 | ||||
Labour hold | Swing | ―0.8 | |||
Party | Candidate | Votes | % | ±% | |
---|---|---|---|---|---|
Labour | Chris Elmore | 23,225 | 62.4 | +9.5 | |
Conservative | Jamie Wallis | 9,354 | 25.1 | +9.2 | |
Plaid Cymru | Huw Marshall | 2,796 | 7.5 | ―2.6 | |
UKIP | Glenda Davies | 1,235 | 3.3 | ―12.1 | |
Liberal Democrats | Gerald Francis | 594 | 1.6 | ―1.4 | |
Rejected ballots | 55 | ||||
Majority | 13,871 | 37.3 | +0.3 | ||
Turnout | 37,204 | 65.1 | +1.4 | ||
Registered electors | 57,125 | ||||
Labour hold | Swing | +0.2 | |||
Of the 55 rejected ballots:
Party | Candidate | Votes | % | ±% | |
---|---|---|---|---|---|
Labour | Chris Elmore | 17,602 | 49.7 | ―12.7 | |
Conservative | Sadie Vidal | 9,797 | 27.7 | +2.6 | |
Brexit Party | Christine Roach | 2,991 | 8.5 | N/A | |
Plaid Cymru | Luke Fletcher | 2,919 | 8.3 | +0.8 | |
Liberal Democrats | Anita Davies | 1,460 | 4.1 | +2.5 | |
Green | Tom Muller | 621 | 1.8 | N/A | |
Rejected ballots | 96 | ||||
Majority | 7,805 | 22.0 | ―15.3 | ||
Turnout | 35,390 | 61.5 | ―3.6 | ||
Registered electors | 57,581 | ||||
Labour hold | Swing | –7.6 | |||
Of the 96 rejected ballots:
Aberavon is a constituency represented in the House of Commons of the Parliament of the United Kingdom since 2015 by Stephen Kinnock of the Welsh Labour Party. It includes the town of Aberavon, although the largest town in the constituency is Port Talbot.
The Member of Parliament for Ogmore in Bridgend County Borough, Sir Raymond Powell, of the Labour Party died on 7 December 2001.
Cardiff North is a constituency represented in the House of Commons of the UK Parliament since 2017 by Anna McMorrin of the Labour Party.
Bridgend is a constituency represented in the House of Commons of the UK Parliament since 2019 by Jamie Wallis, a Conservative.
Caerphilly is a constituency centred on the town of Caerphilly in South Wales, represented in the House of Commons of the UK Parliament since 2001 by Wayne David of the Labour Party.
Cardiff West is a constituency represented in the House of Commons of the UK Parliament since 2001 by Kevin Brennan of the Labour Party.
Cynon Valley is a constituency in Wales represented in the House of Commons of the UK Parliament since 2019 by Beth Winter of the Labour Party.
Llanelli is a constituency of the House of Commons of the Parliament of the United Kingdom. From 1918 to 1970 the official spelling of the constituency name was Llanelly. It elects one Member of Parliament (MP) by the first past the post system of election. Since 2005, it is currently represented by Nia Griffith of the Labour Party.
Newport West was one of two parliamentary constituencies for the city of Newport, South Wales, in the House of Commons of the Parliament of the United Kingdom. It elected one Member of Parliament (MP) using the first-past-the-post voting system. Paul Flynn, of the Labour Party, was the MP from the 1987 general election until his death on 17 February 2019. Consequently, a by-election was held in the constituency on Thursday 4 April 2019 and Ruth Jones of the Labour Party was elected.
Pontypridd is a constituency represented in the House of Commons of the UK Parliament since 2019 by Alex Davies-Jones of the Labour Party.
Rhondda is a constituency in Wales represented in the House of Commons of the UK Parliament since 2001 by Chris Bryant of the Labour Party.
Swansea East is a borough constituency represented in the House of Commons of the Parliament of the United Kingdom by Carolyn Harris of the Labour Party.
Torfaen is a constituency in Wales represented in the House of Commons of the UK Parliament since 2015 by Nick Thomas-Symonds, a member of the Labour Party who also serves as the Shadow Secretary of State for International Trade. It was established for the 1983 general election.
Vale of Glamorgan is a constituency represented in the House of Commons of the UK Parliament since 2010 by Alun Cairns, a Conservative.
Wrexham is a parliamentary constituency centred on the city of Wrexham in the preserved county of Clwyd, Wales in the United Kingdom. It was created in 1918, and is represented in the House of Commons of the UK Parliament from December 2019 by Sarah Atherton of the Conservative Party.
Woking is a constituency represented in the House of Commons of the UK Parliament since 2010 by Jonathan Lord, a Conservative. Since it was first created for the 1950 general election, it has only ever returned Conservative Party candidates.
Ogmore is a constituency of the Senedd. It elects one Member of the Senedd by the first past the post method of election. It is one of seven constituencies in the South Wales West electoral region, which also elects four additional members, to produce a degree of proportional representation for the region as a whole.
Bridgend County Borough Council is the governing body for Bridgend County Borough, one of the principal areas of Wales.
Gilfach Goch is a community, electoral ward and small former coal mining village mostly in the Borough of Rhondda Cynon Taf, south Wales, near the larger community of Tonyrefail. Some areas in the North Western part of the village lie within Bridgend County Borough. It is situated in the Cwm Ogwr Fach between the Cwm Ogwr Fawr to the west and the Cwm Rhondda to the east.
On 5 May 2016, a by-election was held in the UK Parliamentary constituency of Ogmore. It was triggered by the resignation of the incumbent Huw Irranca-Davies following his decision to contest the coterminous Ogmore constituency in the 2016 Welsh Assembly election.