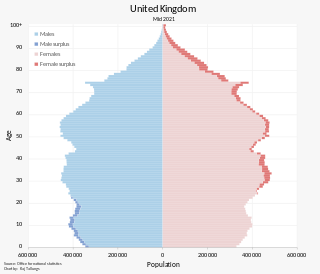
The population of the United Kingdom was estimated at over 67.0 million in 2020. It is the 21st most populated country in the world and has a population density of 270 people per square kilometre, with England having significantly greater density than Wales, Scotland, and Northern Ireland. Almost a third of the population lives in south east England, which is predominantly urban and suburban, with about 9 million in the capital city, London, whose population density is just over 5,200 per square kilometre.

Demographics of Wales include the numbers in population, place of birth, age, ethnicity, religion, and number of marriages in Wales.

The demography of England has since 1801 been measured by the decennial national census, and is marked by centuries of population growth and urbanization. Due to the lack of authoritative contemporary sources, estimates of the population of England for dates prior to the first census in 1801 vary considerably. The population of England at the 2021 census was 56,489,800.

Hinduism is the third largest religious group in the United Kingdom, after Christianity and Islam; the religion is followed by around 1.7% of the total population of the nation. Hindus had a presence in the United Kingdom since the early 19th century, as at the time India was part of the British Empire. Many Indians in the British Indian Army settled in the United Kingdom of Great Britain and Northern Ireland. According to 2021 United Kingdom census, 1,032,775 residents (1.7%) identified themselves as Hindus.

The demography of London is analysed by the Office for National Statistics and data is produced for each of the Greater London wards, the City of London and the 32 London boroughs, the Inner London and Outer London statistical sub-regions, each of the Parliamentary constituencies in London, and for all of Greater London as a whole. Additionally, data is produced for the Greater London Urban Area. Statistical information is produced about the size and geographical breakdown of the population, the number of people entering and leaving country and the number of people in each demographic subgroup. The total population of London as of 2021 is 8,799,800.

White British is an ethnicity classification used for the native white population identifying as English, Scottish, Welsh, Cornish, Northern Irish, or British in the United Kingdom Census. In the 2011 census, the White British population was 49,997,686, 81.5% of Great Britain's total population. For the United Kingdom entirely, due to different reporting measures within Northern Ireland which includes all those who identified as British with those who identified as Irish, an amalgamated total of 52,320,080 including those who identified as White Irish in Great Britain is given making up 82.8% of the population.

This article is intended to give an overview of the demography of Slough. In 2016, Slough had a population of 149,000 people.
Mixed is an ethnic group category that was first introduced by the United Kingdom's Office for National Statistics for the 2001 Census. Colloquially it refers to British citizens or residents whose parents are of two or more different races or ethnic backgrounds. The Mixed or Multiple ethnic group in England and Wales numbered 1.7 million in the 2021 census, 2.9% of the population.
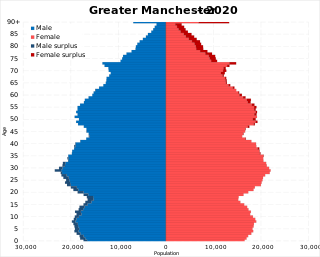
The demography of Greater Manchester is analysed by the Office for National Statistics and data is produced for each of its ten metropolitan boroughs, each of the Greater Manchester electoral wards, the NUTS3 statistical sub-regions, each of the Parliamentary constituencies in Greater Manchester, the 15 civil parishes in Greater Manchester, and for all of Greater Manchester as a whole; the latter of which had a population of 2,682,500 at the 2011 UK census. Additionally, data is produced for the Greater Manchester Urban Area. Statistical information is produced about the size and geographical breakdown of the population, the number of people entering and leaving country and the number of people in each demographic subgroup.

The term Other White is a classification of ethnicity in the United Kingdom and has been used in documents such as the 2011 UK Census to describe people who self-identify as white persons who are not of the English, Welsh, Scottish, Romani or Irish ethnic groupings.

British Arabs are British citizens of Arab descent. They share a common Arab ethnicity, culture, language and identity from different Arab countries. Arabs also come from non-Arab countries as ethnic minorities.

Leicester, England is an ethnically and culturally diverse city. It is the thirteenth most populous city in the United Kingdom.

Nottingham, England is an ethnically and culturally diverse city. It is the sixteenth most populous city in the United Kingdom.

Luton, Bedfordshire, England is an ethnically and culturally diverse town of 203,201 people. It's primarily urban, with a population density of 4,696/km2 (12,160/sq mi). Luton has seen several waves of immigration. In the early part of the 20th century, there was internal migration of Irish and Scottish people to the town. These were followed by Afro-Caribbean and Asian immigrants. More recently immigrants from other European Union countries have made Luton their home. As a result of this Luton has a diverse ethnic mix, with a significant population of Asian descent, mainly Pakistani 29,353 (14.4%) and Bangladeshi 13,606 (6.7%).

Bradford, England is an ethnically and culturally diverse city. The City of Bradford metropolitan borough is the sixth most populous local authority district in the United Kingdom, and includes not only Bradford but also the towns and villages of Keighley, Shipley, Bingley, Ilkley, Haworth, Silsden, Queensbury, Thornton and Denholme.

Leeds, England is the third most populous city in the United Kingdom.

Bristol, England is the tenth most populous city in the United Kingdom.

Coventry, England is an ethnically and culturally diverse city. It is the fifteenth most populous city in the United Kingdom.
MixedWhite and Black Caribbean is an ethnic group category that was first introduced by the United Kingdom's Office for National Statistics for the 2001 Census. Colloquially it refers to British citizens or residents whose parents are of a White ethnic background and Black Caribbean ethnic background. This classification is only used in England and Wales, as Scotland and Northern Ireland do not have sub categories for their mixed group options.
MixedWhite and Asian is an ethnic group category that was first introduced by the United Kingdom's Office for National Statistics for the 2001 Census. Colloquially it refers to British citizens or residents whose parents are of a White (unspecificed) ethnic background and Asian (unspecified) ethnic background. This classification is only used in England and Wales, as Scotland and Northern Ireland do not have sub categories for their mixed group options.
