Perceptual mapping

Last updated

Perceptual mapping / Market mapping is a diagrammatic technique used by asset marketers that attempts to visually display the perceptions of customers or potential customers. The positioning of a brand is influenced by customer perceptions rather than by those of businesses. For example, a business may feel it sells upmarket products of high quality, but if customers view the products as low quality, it is their views which will influence sales. Typically the position of a company's product, product line, or brand is displayed relative to their competition. [1] Perceptual maps, also known as market maps, usually have two dimensions but can be multi-dimensional or use multiple colours to add an extra variable. They can be used to identify gaps in the market and potential partners or merger targets as well as to clarify perceptual problems with a company's product. So, if a business wants to find out where its brand is positioned in the market, it might carry out market research. This will help them to find out how the customers sees their brand in relation to others in the market.

Contents

Uses

Perceptual mapping enables companies to better understand their customers: the who, why, where, how and what of their behaviour. [2] [3] [4] [5] [6] If a business is perceived in a manner they find unsatisfactory, further research then identifies what can be done to change that. Perceptual mapping also allows businesses to see what consumers think of other brands, particularly their competitors. Regular uses of the maps can help track preferences, and see changes as they happen. Perceptual mapping can help define market segments, showing clusters of businesses differentiated by key aspects (such as higher class or number of restaurants). Within the clusters found in perceptual maps of entire industries, a business can classify potential partners or possible businesses to merge with, since the clustering of brands signifies the similarity in businesses, meaning they have corresponding attributes. It can also help identify gaps in a market where a new product or service could be introduced. [1]

Perceptual maps can also be used to help keep track of how a new product, such as a recently introduced smartphone, is being viewed in a specific market. It is important to see that the way a business is marketing its product is not only successful, but successful in a manner that aligns with the business’s overarching goal for positioning.

Some companies seem to have fallen out of favor with the public, such as Quicken Loans [7] and VW. [8] Perceptual mapping can help elicit the extent of the damage.

Limitations

There are many limitations to perceptual mapping. The largest is the number of variables used. Traditionally, the map uses two variables and does not account for others, because these first two variables include the most variance. This assumption can hinder the reliability of results, as in some cases, it is not safe to assume that there are only two major factors influencing the decision of purchase for a consumer. For example, a graph may use quality of food and pricing, but not take into account other relevant variables such as the number of visits and locations. Also, there is often a blurred line between what a business can offer and what a consumer thinks the business can offer. This could be due to miscommunication, lack of knowledge, impact from social media, and so on. These untruths can influence the result, creating a slight bias in the statistics. Another limitation is data gathering. The data needed to form a perceptual map is usually obtained through surveys, and can be difficult to obtain. The range of behaviours that the map covers is also a constraint, as the limitation to two variables means that its application works mainly with purchase decisions made with little thought and effort, such as purchasing a beverage at a store or going to a fast food restaurant.

Examples

Perceptual maps can have any number of dimensions but the most common is two dimensions. The first perceptual map below shows consumer perceptions of various automobiles on the two dimensions of sportiness/conservative and classy/affordable. This sample of consumers felt Porsche was the sportiest and classiest of the cars in the study (top right corner). They felt Plymouth was most practical and conservative (bottom left corner).

Perceptual map of competing products PerceptualMap1.png
Perceptual map of competing products

Cars that are positioned close to each other are seen as similar on the relevant dimensions by the consumer. For example, consumers see Buick, Chrysler, and Oldsmobile as similar. They are close competitors and form a competitive grouping. A company considering the introduction of a new model will look for an area on the map free from competitors. Some perceptual maps use different-sized circles to indicate the sales volume or market share of the various competing products.

Displaying consumers’ perceptions of related products is only half the story. Many perceptual maps also display consumers’ ideal points. These points reflect ideal combinations of the two dimensions as seen by a consumer. The next diagram shows a study of consumers’ ideal points in the alcohol/spirits product space. Each dot represents one respondent's ideal combination of the two dimensions. Areas where there is a cluster of ideal points (such as A) indicate a market segment. Areas without ideal points are sometimes referred to as demand voids.

Perceptual map of ideal points and clusters PerceptualMap2.png
Perceptual map of ideal points and clusters

A company considering introducing a new product will look for areas with a high density of ideal points. They will also look for areas without competitive rivals. This is best done by placing both the ideal points and the competing products on the same map.

Some maps plot ideal vectors instead of ideal points. The map below displays various aspirin products as seen on the dimensions of effectiveness and gentleness. It also shows two ideal vectors. The slope of the ideal vector indicates the ratio of the two dimensions preferred by those consumers within that segment. This study indicates that there is one segment that is more concerned with effectiveness than harshness, and another segment that is more interested in gentleness than strength.

Perceptual map of competing products with ideal vectors PerceptualMap3-new.png
Perceptual map of competing products with ideal vectors

Other types of mapping

Spidergrams

Spidergrams are an alternative to perceptual mapping that similarly are visual marketing tools; however, spidergrams also request customers to rate attributes. [9]

Multidimensional perceptual maps

Example of a multi-dimensional perceptual map Multi-Dimensional Perceptual Map.gif
Example of a multi-dimensional perceptual map

Traditional perceptual maps are built with two visual dimensions (X- and Y-axis). Multidimensional perceptual maps are built with more dimensions visualised as profile charts in small map regions, and then items are mapped to the regions by their similarity to the vectors that represent the region. A common technique to construct this kind of multidimensional perceptual maps is the self-organizing map. This helps pinpoint more variables, allowing for more in-depth research into what influences the consumer. This means that the perceptual map can be applied beyond low-involvement purchases, and also helps with identification of segments in a market.

Intuitive maps

Perceptual maps need not come from a detailed study. There are also intuitive maps (also called judgmental maps or consensus maps) that are created by marketers based on their understanding of their industry. These are limited by not being based on consumer data.

When detailed marketing research studies are done methodological problems can arise, but at least the information is coming directly from the consumer. An assortment of statistical procedures can be used to convert the raw data collected in a survey into a perceptual map. Preference regression will produce ideal vectors. Multi dimensional scaling will produce either ideal points or competitor positions. Factor analysis, discriminant analysis, cluster analysis and logit analysis can also be used. Some techniques are constructed from perceived differences between products, others from perceived similarities, and still others from cross price elasticity of demand data from electronic scanners.

Modern techniques

Marketers can reveal shoppers' collective perceptual map with increasing precision and detail by aggregating and analysing their data; this is done, for example, in the smartphone and laptop industries. [10] [11]

Furthermore, they can be used in non-commercial applications, such as identifying factors involved in dangerous driving. [12]

See also

Related Research Articles

Marketing Study and process of exploring, creating, and delivering value to customers

Marketing is the process of exploring, creating, and delivering value to meet the needs of a target market in terms of goods and services; potentially including selection of a target audience; selection of certain attributes or themes to emphasize in advertising; operation of advertising campaigns; attendance at trade shows and public events; design of products and packaging attractive to buyers; defining the terms of sale, such as price, discounts, warranty, and return policy; product placement in media or with people believed to influence the buying habits of others; agreements with retailers, wholesale distributors, or resellers; and attempts to create awareness of, loyalty to, and positive feelings about a brand. Marketing is typically done by the seller, typically a retailer or manufacturer. Sometimes tasks are contracted to a dedicated marketing firm or advertising agency. More rarely, a trade association or government agency advertises on behalf of an entire industry or locality, often a specific type of food, food from a specific area, or a city or region as a tourism destination.

Marketing research is the systematic gathering, recording, and analysis of qualitative and quantitative data about issues relating to marketing products and services. The goal is to identify and assess how changing elements of the marketing mix impacts customer behavior.

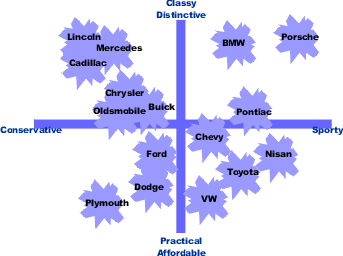
Positioning refers to the place that a brand occupies in the minds of the customers and how it is distinguished from the products of the competitors and different from the concept of brand awareness. In order to position products or brands, companies may emphasize the distinguishing features of their brand or they may try to create a suitable image through the marketing mix. Once a brand has achieved a strong position, it can become difficult to reposition it.

Pricing Process of determining what a company will receive in exchange for its products

Pricing is the process whereby a business sets the price at which it will sell its products and services, and may be part of the business's marketing plan. In setting prices, the business will take into account the price at which it could acquire the goods, the manufacturing cost, the marketplace, competition, market condition, brand, and quality of product.

In marketing, market segmentation is the process of dividing a broad consumer or business market, normally consisting of existing and potential customers, into sub-groups of consumers based on some type of shared characteristics.

Brand equity, in marketing, is the worth of a brand in and of itself — i.e., the social value of a well-known brand name. The owner of a well-known brand name can generate more revenue simply from brand recognition, as consumers perceive the products of well-known brands as better than those of lesser-known brands.

Marketing management is the organizational discipline which focuses on the practical application of marketing orientation, techniques and methods inside enterprises and organizations and on the management of a firm's marketing resources and activities.

Preference regression

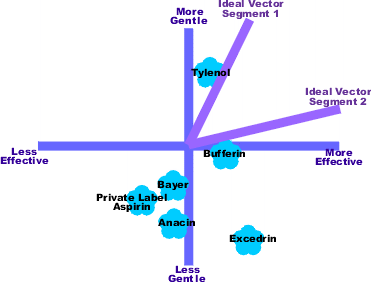
Preference regression is a statistical technique used by marketers to determine consumers’ preferred core benefits. It usually supplements product positioning techniques like multi dimensional scaling or factor analysis and is used to create ideal vectors on perceptual maps.

Multidimensional scaling Set of related ordination techniques used in information visualization

Multidimensional scaling (MDS) is a means of visualizing the level of similarity of individual cases of a dataset. MDS is used to translate "information about the pairwise 'distances' among a set of objects or individuals" into a configuration of points mapped into an abstract Cartesian space.

Consumer behaviour Study of individuals, groups, or organizations and all the activities associated with consuming

Consumer behavior is the study of individuals, groups, or organizations and all the activities associated with the purchase, use and disposal of goods and services. Consumer behaviour consists of how the consumer's emotions, attitudes, and preferences affect buying behaviour. Consumer behaviour emerged in the 1940–1950s as a distinct sub-discipline of marketing, but has become an interdisciplinary social science that blends elements from psychology, sociology, social anthropology, anthropology, ethnography, marketing, and economics.

Advertising campaign Series of advertisements centered around a particular theme or character

An advertising campaign is a series of advertisement messages that share a single idea and theme which make up an integrated marketing communication (IMC). An IMC is a platform in which a group of people can group their ideas, beliefs, and concepts into one large media base. Advertising campaigns utilize diverse media channels over a particular time frame and target identified audiences.

In marketing, geodemographic segmentation is a multivariate statistical classification technique for discovering whether the individuals of a population fall into different groups by making quantitative comparisons of multiple characteristics with the assumption that the differences within any group should be less than the differences between groups.

In marketing, segmenting, targeting and positioning (STP) is a broad framework that summarizes and simplifies the process of market segmentation. Market segmentation is a process, in which groups of buyers within a market are divided and profiled according to a range of variables, which determine the market characteristics and tendencies. The processes of segmentation, targeting and positioning are parts of a chronological order for market segmentation.

A target audience is the intended audience or readership of a publication, advertisement, or other message catered specifically to said intended audience. In marketing and advertising, it is a particular group of considered within the predetermined target market, identified as the targets or recipients for a particular advertisement or message. Businesses that have a wide target market will focus on a specific target audience for certain messages to send, such as The Body Shops Mother's Day advertisements, which were aimed at the children and spouses of women, rather than the whole market which would have included the women themselves.

A market analysis studies the attractiveness and the dynamics of a special market within a special industry. It is part of the industry analysis and thus in turn of the global environmental analysis. Through all of these analyses, the strengths, weaknesses, opportunities and threats (SWOT) of a company can be identified. Finally, with the help of a SWOT analysis, adequate business strategies of a company will be defined. The market analysis is also known as a documented investigation of a market that is used to inform a firm's planning activities, particularly around decisions of inventory, purchase, work force expansion/contraction, facility expansion, purchases of capital equipment, promotional activities, and many other aspects of a company.

The following outline is provided as an overview of and topical guide to marketing:

A touchpoint can be defined as any way consumers can interact with a business organization, whether it be person-to-person, through a website, an app or any form of communication. When consumers come in contact with these touchpoints it gives them the opportunity to compare their prior perceptions of the business and form an opinion.

Customer experience Interaction between an organization and a customer

Customer experience (CX) is a totality of cognitive, affective, sensory, and behavioral consumer responses during all stages of the consumption process including pre-purchase, consumption, and post-purchase stages. Pine and Gilmore described the experience economy as the next level after commodities, goods, and services with memorable events as the final business product. Four realms of experience include esthetic, escapist, entertainment, and educational components.

Brand Identification for a good or service

A brand is a name, term, design, symbol or any other feature that distinguishes one seller's good or service from those of other sellers. Brands are used in business, marketing, and advertising for recognition and, importantly, to create and store value as brand equity for the object identified, to the benefit of the brand's customers, its owners and shareholders. Brand names are sometimes distinguished from generic or store brands.

In marketing, "frame of reference" is how a new product, service, or concept is seen by the target market.. This creates a specific picture or idea about or surrounding a product, service, or concept being marketed. This picture can form the basis of a marketing strategy focused on a particular target market, or can be used to compare the product being marketed to other products of a similar vein. Consumers will compare newly introduced or discovered products to other products of which they have prior knowledge or experience with.

References

  1. 1 2 Mccarthy, E. J., Mcguiggan, I. R., Perreault, D. W., & Quester, G. P. (2007). Marketing: Creating and delivering value. Australia, Sydney: McGraw-Hill
  2. Drucker, Peter F (2007). The Practice of Management (2nd ed.). London: Routledge. p. x Foreword. ISBN   978-0750685047.
  3. Brassington, Frances; Pettitt, Stephen (2013). "6". Essentials of Marketing (3 ed.). Harlow: Pearson Education. p. 243. ISBN   9780273728139.
  4. Jobber, David; Ellis-Chadwick, Fiona (2013). "8" (Paperback). Principles and Practice of Marketing (7 ed.). Maidenhead: McGraw-Hill. p. 290. ISBN   9780077140007.{{cite book}}: |chapter-format= requires |chapter-url= (help)
  5. Feintzeig, Rachel (24 December 2015). "Business News: Holiday Stress for Businesses". Wall Street Journal (Europe edition). p. B2.
  6. Jenkins, Holman W Jr (19 November 2015). "The Broadband Future And Its Enemies". New York: Wall Street Journal (Europe edition). p. A.10.
  7. Rudegeair, Peter (16 June 2015). "At Quicken Loans, a Will to Do Battle". Wall Street Journal (Europe edition). p. 25.
  8. Anonymous (26 September 2015). "A mucky business; The Volkswagen scandal". Vol. 416, no. 8957. The Economist. pp. 23–25.
  9. Jobber, David; Ellis-Chadwick, Fiona (2013). "8" (Paperback). Principles and Practice of Marketing (7 ed.). Maidenhead: McGraw-Hill. p. 291. ISBN   9780077140007.{{cite book}}: |chapter-format= requires |chapter-url= (help)
  10. Lee, Anthony JT; Sun, Chih-Yuan; Yang, Fu-Chen; Chen, Chao-Hung; Wang, Chun-Sheng (2016). "Mining perceptual maps from consumer reviews". Decision Support Systems. Elsevier B.V. 82 (February): 12–25. doi:10.1016/j.dss.2015.11.002. ISSN   0167-9236.
  11. Zaribaf, Mehdi; Shameli, Nora (Fall 2012). "Notebook Positioning by Perceptual Map and Laddering Method". New Marketing Research Journal (in Persian). University of Isfahan, Iran. 2 (3): 121–134. ISSN   2228-7744.
  12. Vanlaar, Ward; Simpson, Herb; Robertson, Robyn (2008). "A perceptual map for understanding concern about unsafe driving behaviours". Accident Analysis and Prevention. Elsevier B.V. 40 (5): 1667–1673. doi:10.1016/j.aap.2008.05.009. ISSN   0001-4575. PMID   18760094.