Related Research Articles
Analysis of variance (ANOVA) is a collection of statistical models and their associated estimation procedures used to analyze the differences among means. ANOVA was developed by the statistician Ronald Fisher. ANOVA is based on the law of total variance, where the observed variance in a particular variable is partitioned into components attributable to different sources of variation. In its simplest form, ANOVA provides a statistical test of whether two or more population means are equal, and therefore generalizes the t-test beyond two means. In other words, the ANOVA is used to test the difference between two or more means.
In statistics, the likelihood principle is the proposition that, given a statistical model, all the evidence in a sample relevant to model parameters is contained in the likelihood function.

Statistics is the discipline that concerns the collection, organization, analysis, interpretation, and presentation of data. In applying statistics to a scientific, industrial, or social problem, it is conventional to begin with a statistical population or a statistical model to be studied. Populations can be diverse groups of people or objects such as "all people living in a country" or "every atom composing a crystal". Statistics deals with every aspect of data, including the planning of data collection in terms of the design of surveys and experiments.

Statistical inference is the process of using data analysis to infer properties of an underlying distribution of probability. Inferential statistical analysis infers properties of a population, for example by testing hypotheses and deriving estimates. It is assumed that the observed data set is sampled from a larger population.
The following outline is provided as an overview of and topical guide to statistics:

A statistical hypothesis test is a method of statistical inference used to decide whether the data sufficiently support a particular hypothesis. A statistical hypothesis test typically involves a calculation of a test statistic. Then a decision is made, either by comparing the test statistic to a critical value or equivalently by evaluating a p-value computed from the test statistic. Roughly 100 specialized statistical tests have been defined.
The likelihood function is the joint probability mass of observed data viewed as a function of the parameters of a statistical model. Intuitively, the likelihood function is the probability of observing data assuming is the actual parameter.
In statistics, point estimation involves the use of sample data to calculate a single value which is to serve as a "best guess" or "best estimate" of an unknown population parameter. More formally, it is the application of a point estimator to the data to obtain a point estimate.
In statistics, interval estimation is the use of sample data to estimate an interval of possible values of a parameter of interest. This is in contrast to point estimation, which gives a single value.
In statistics, the power of a binary hypothesis test is the probability that the test correctly rejects the null hypothesis when a specific alternative hypothesis is true. It is commonly denoted by , and represents the chances of a true positive detection conditional on the actual existence of an effect to detect. Statistical power ranges from 0 to 1, and as the power of a test increases, the probability of making a type II error by wrongly failing to reject the null hypothesis decreases.
The posterior probability is a type of conditional probability that results from updating the prior probability with information summarized by the likelihood via an application of Bayes' rule. From an epistemological perspective, the posterior probability contains everything there is to know about an uncertain proposition, given prior knowledge and a mathematical model describing the observations available at a particular time. After the arrival of new information, the current posterior probability may serve as the prior in another round of Bayesian updating.
In statistical inference, specifically predictive inference, a prediction interval is an estimate of an interval in which a future observation will fall, with a certain probability, given what has already been observed. Prediction intervals are often used in regression analysis.
This glossary of statistics and probability is a list of definitions of terms and concepts used in the mathematical sciences of statistics and probability, their sub-disciplines, and related fields. For additional related terms, see Glossary of mathematics and Glossary of experimental design.

In Bayesian statistics, a credible interval is an interval used to characterize a probability distribution. It is defined such that an unobserved parameter value has a particular probability to fall within it. For example, in an experiment that determines the distribution of possible values of the parameter , if the probability that lies between 35 and 45 is 0.95, then is a 95% credible interval.
In clinical trials and other scientific studies, an interim analysis is an analysis of data that is conducted before data collection has been completed. Clinical trials are unusual in that enrollment of subjects is a continual process staggered in time. If a treatment can be proven to be clearly beneficial or harmful compared to the concurrent control, or to be obviously futile, based on a pre-defined analysis of an incomplete data set while the study is on-going, the investigators may stop the study early.
Frequentist inference is a type of statistical inference based in frequentist probability, which treats “probability” in equivalent terms to “frequency” and draws conclusions from sample-data by means of emphasizing the frequency or proportion of findings in the data. Frequentist inference underlies frequentist statistics, in which the well-established methodologies of statistical hypothesis testing and confidence intervals are founded.
In particle physics, CLs represents a statistical method for setting upper limits on model parameters, a particular form of interval estimation used for parameters that can take only non-negative values. Although CLs are said to refer to Confidence Levels, "The method's name is ... misleading, as the CLs exclusion region is not a confidence interval." It was first introduced by physicists working at the LEP experiment at CERN and has since been used by many high energy physics experiments. It is a frequentist method in the sense that the properties of the limit are defined by means of error probabilities, however it differs from standard confidence intervals in that the stated confidence level of the interval is not equal to its coverage probability. The reason for this deviation is that standard upper limits based on a most powerful test necessarily produce empty intervals with some fixed probability when the parameter value is zero, and this property is considered undesirable by most physicists and statisticians.
Predictive probability of success (PPOS) is a statistics concept commonly used in the pharmaceutical industry including by health authorities to support decision making. In clinical trials, PPOS is the probability of observing a success in the future based on existing data. It is one type of probability of success. A Bayesian means by which the PPOS can be determined is through integrating the data's likelihood over possible future responses.
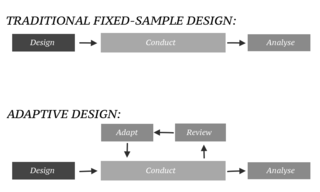
In an adaptive design of a clinical trial, the parameters and conduct of the trial for a candidate drug or vaccine may be changed based on an interim analysis. Adaptive design typically involves advanced statistics to interpret a clinical trial endpoint. This is in contrast to traditional single-arm clinical trials or randomized clinical trials (RCTs) that are static in their protocol and do not modify any parameters until the trial is completed. The adaptation process takes place at certain points in the trial, prescribed in the trial protocol. Importantly, this trial protocol is set before the trial begins with the adaptation schedule and processes specified. Adaptions may include modifications to: dosage, sample size, drug undergoing trial, patient selection criteria and/or "cocktail" mix. The PANDA provides not only a summary of different adaptive designs, but also comprehensive information on adaptive design planning, conduct, analysis and reporting.
References
- ↑ Tang, Z (2015-05-28). "PPOS design". slideshare.
- ↑ Tang, Z (2015). "Optimal futility interim design: a predictive probability of success approach with time to event end point". Journal of Biopharmaceutical Statistics. 25 (6): 1312–1319. doi:10.1080/10543406.2014.983646. PMID 25379701.
- ↑ Tang, Z (2017). "Defensive Efficacy Interim Design: dynamic benefit/risk ratio view using probability of success". Journal of Biopharmaceutical Statistics. 27 (4): 683–690. doi:10.1080/10543406.2016.1198370. PMID 27295497.
- ↑ Tang, Z (2017-03-19). "Defensive Efficacy Interim design". slideshare.